Each year disturbance events such as avalanches, landslides, floods, fires, and clearcuts alter the landscape in and around the parks in the North Coast and Cascade Network (NCCN). These disturbances vary in duration, size, and severity, from a sudden small flood in a riparian zone to a fire that burns thousands of acres over several weeks.
Natural disturbance events inside the park can have lasting effects on park ecosystems and can significantly impact cultural resources. Disturbances outside the parks, such as clearcuts and development, alter the ecological connections that tie resources within the park to the broader ecosystem in which each park is located. The NCCN landscape dynamics monitoring program was developed in order to track the location, type, severity and duration of common landscape disturbances. Observations from the program will also provide a broader context for changes observed in other NCCN monitoring programs.
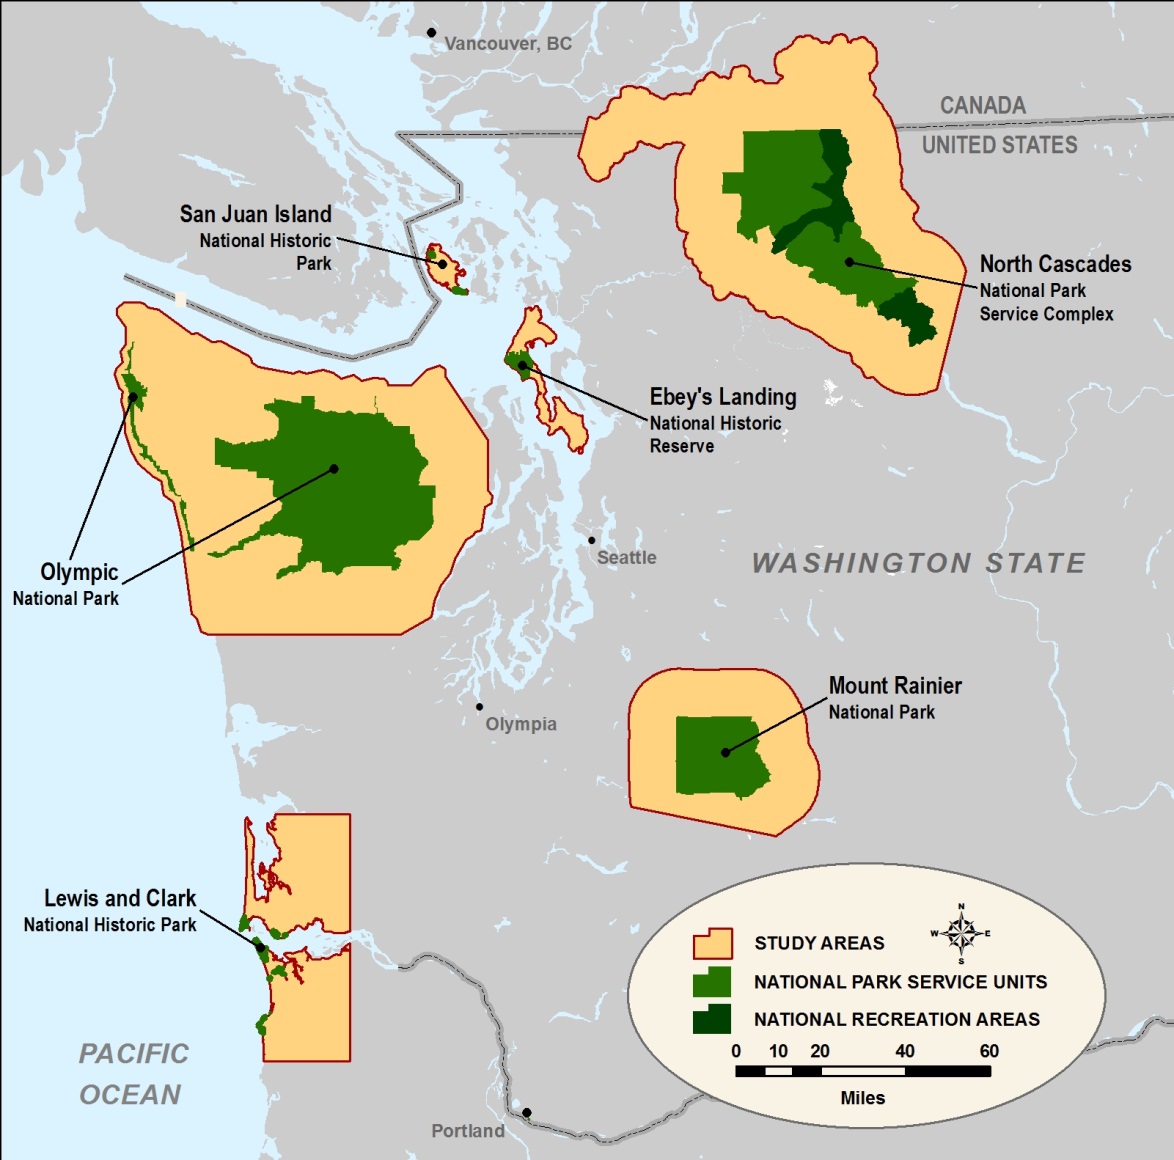
Due to advancements in satellite image processing techniques, landscape changes can be efficiently detected over large areas at a relatively low cost. The NCCN landscape dynamics monitoring program uses satellite imagery, Geographic Information Systems (GIS), and statistical analyses to map and categorize disturbance events in and around NCCN parks. The study area for each park includes all watersheds inside and within 10 miles outside of park boundary, as well as areas of particular interest to the park.
The study areas used in the NCCN Landscape Dynamics Monitoring Program.
The specific objectives of the monitoring program are:
-
Detect and map areas within the NCCN study areas larger than 2.5 acres (0.5 ha) which have experienced a minimum 10% loss in cover.
-
Use aerial photography and/or image classification models to map and categorize disturbance types.
The landscape dynamics monitoring program uses Landsat imagery to detect significant landscape changes by comparing annual images and other information. Imagine looking down on a forest of several thousand trees. On a Landsat true-color image, this forest would appear as hundreds of green-shaded pixels. Next, imagine that a large landslide sweeps through the middle of this forest, leaving a gash of rock and bare soil where trees once stood. On the next Landsat image, wherever the landslide removed the trees, the pixels would now appear light brown or grey, indicating bare rock.
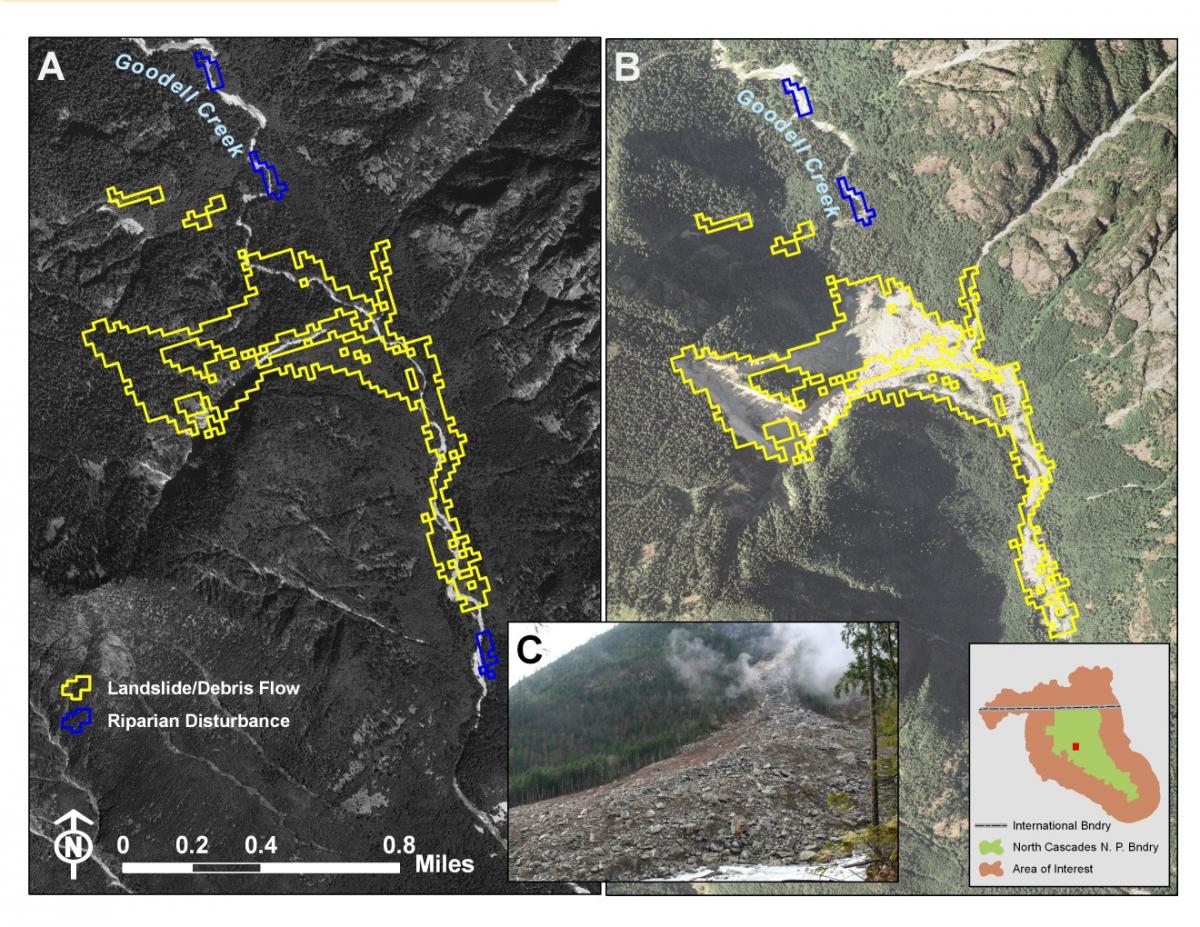
The process to identify disturbance events has been automated by a computer program called LandTrendr, developed by a group of scientists at Oregon State University. The figure below shows how LandTrendr detects a landslide at North Cascades National Park (NOCA). Each year, the Landsat images covering the NCCN Parks and surrounding areas undergo LandTrendr statistical analysis to detect all new areas that have changed compared to the previous years.
An example of a disturbance event detected by LandTrendr. The photo in A was taken in the 1990s. The 2006 color photo in B shows the extent of the recent mass movement. Photo C shows the same Mass Movement from the ground.
Once individual disturbance events are delineated, NPS researchers apply a statistical model to the data to label the event with a disturbance agent, such as Fire, Mass Movement, or Clearing. The statistical model combines information about the event’s shape, size, and location on the landscape with the information about the event’s duration and magnitude from the LandTrendr algorithm. For example, the irregular shape, location on a valley wall, and full removal of vegetation are all factors that would lead to the NOCA disturbance receiving the Mass Movement label. Maps of the labeled disturbances that are larger than 1 ha (2.5 acres) and where at least 10 percent of vegetative cover was removed are created which show the location of disturbance events inside and outside NCCN parks.
The NCCN’s landscape dynamics monitoring program launched at North Cascades National Park in spring of 2011 and analyzed Landsat images from 1985 to 2010. The figure below shows the total number of acres that were labeled disturbed within the study area of the North Cascades National Park Complex during that time period. Future analyses will investigate the links between Pacific Northwest weather patterns and the frequency and timing of certain disturbance events, potentially leading to more accurate predictions of those events.
Researchers predict that in the Pacific Northwest, global climate change may cause some types of disturbances, such as fires and floods, to increase in frequency and severity. Evidence to evaluate these predictions will come directly from this monitoring program and similar projects around the region. With this study, the NCCN parks will pioneer some of the most expansive and detailed natural resource monitoring in the Pacific Northwest.


