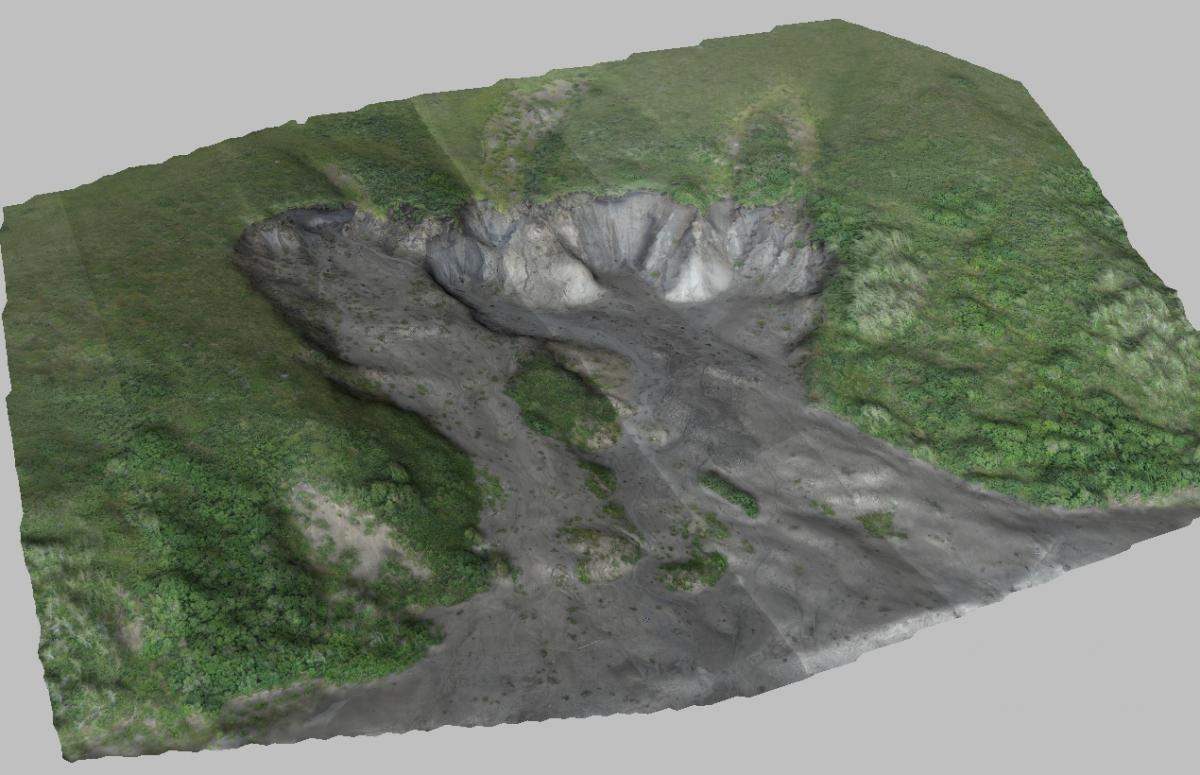
In FY2011, the I&M Arctic Network used IKONOS imagery from 2006-2008 to map slumps and small landslides caused by thaw of permafrost in the Noatak National Preserve (2.6 million ha). Over 1,000 features were located. The results of this analysis were compared to the 1977 color-infrared Alaska High-Altitude Photography (AHAP of the same area to assess volume of change in the landscape due to thawing permafrost.
35 mm oblique aerial photography was also used to create 3D models of selected thaw slumps in the Noatak National Preserve to measure growth of thaw slumps. These measurements show that the margins of some slumps are migrating at over 20 m per year, resulting in tens of thousands of cubic meters of subsidence per slump.
3D model from aerial photography used to monitor the growth of thaw slumps in the Noatak National Preserve.


