Reclamation is charged with measuring consumptive water use (water that is removed from a watershed) within the Colorado River Basin. Irrigated agriculture accounts for the majority of consumptive use, and historically Reclamation has combined estimates of crop acreage with local weather and crop development information to estimate seasonal consumptive water use by agriculture. But actual water use can decline from reference values due to crop stress caused by salinity problems, damage due to pests or disease, or water shortage. Reclamation is researching the use of remote-sensing-based energy balance models to map actual consumptive water use by agricultural crops. Because crops under stress exhibit changes in surface reflectance and emitted thermal radiation, satellite measurements of these variables can be used in the energy balance models to provide a better estimate of actual consumptive use than traditional methods.
Remotely sensed measurements of surface albedo (reflectance) and emitted thermal radiation are used to estimate the net radiation available to drive the evapotranspiration (ET) process at each pixel location. Vegetation index values derived from satellite imagery are used to estimate the amount of heat lost to the soil and the air at each pixel. The residual net (minus losses to soil and air) represents the energy available to evaporate water at each pixel. The residuals are summed for a 24-hour period and converted to a daily depth of evaporated water, and local weather data are used to estimate daily water use between image acquisition dates.
Landsat Thematic Mapper (TM) and Enhanced Thematic Mapper Plus (ETM+) images are uniquely suited for this work because: 1) they offer the spectral bands in the visible through thermal wavelengths needed to characterize net radiation, 2) their spatial resolution is adequate for mapping ET within individual agricultural fields, and 3) they are acquired on a frequent schedule that allows characterization of crop phenological development.
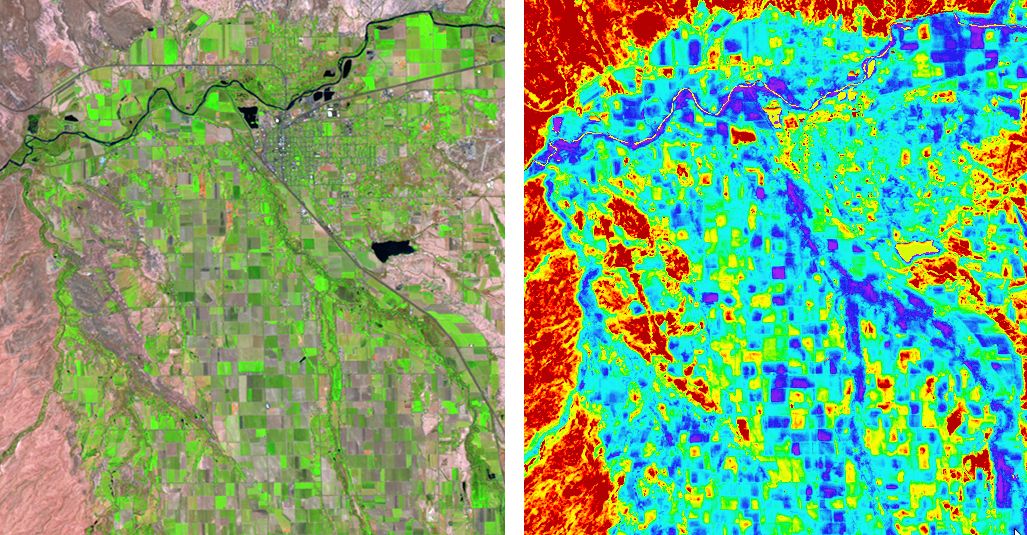
6/17/06 TM image of portions of the Uncompahgre and Lower Gunnison Valleys near Delta, Colorado (left) and 24-hour evapotranspiration image developed using a remote-sensing -based energy balance model (right). The TM image is displayed as TM bands 5,4,3 as R,G,B. The evapotranspiration image is color-ramped between red (0 mm ET) and purple (8 mm ET).
http://www.usbr.gov/uc/library/envdocs/reports/crs/crsul.html


