Buffelgrass is a perennial grass that is invasive to the Sonoran Desert, where it threatens desert ecosystems by out-competing native plants and altering fire regimes. Buffelgrass forms a continuous mat of highly flammable vegetation that carries fire quickly and broadly across the landscape; fires fueled by buffelgrass ultimately transform the Sonoran Desert ecosystem from a diverse assemblage of plants to a grassland monoculture. The USGS has teamed up with the NPS, the USA National Phenology Network (USA-NPN), and the Sonoran Desert Buffelgrass Coordination Center (SABCC) to map where buffelgrass is located and detect when it is green. The ability to map the location and growing status of buffelgrass will enable the strategic application of herbicide, which is most effective when the vegetation is photosynthetically active. We integrated ground observations of buffelgrass phenology collected by citizen scientists and professionals, a map of buffelgrass distribution in Saguaro National Park, climate information and MODIS imagery to understand the dynamics, relationships and resonance between these variables. Statistical analyses of data collected at observer field sites reveal strong correlations between observed buffelgrass greenness and current MODIS vegetation indices as well as between observed buffelgrass greenness and lagged precipitation values. The results indicate that buffelgrass has a stronger and more rapid response to precipitation events than native vegetation, and that precipitation data can predict greenup, but MODIS data can confirm greenup.
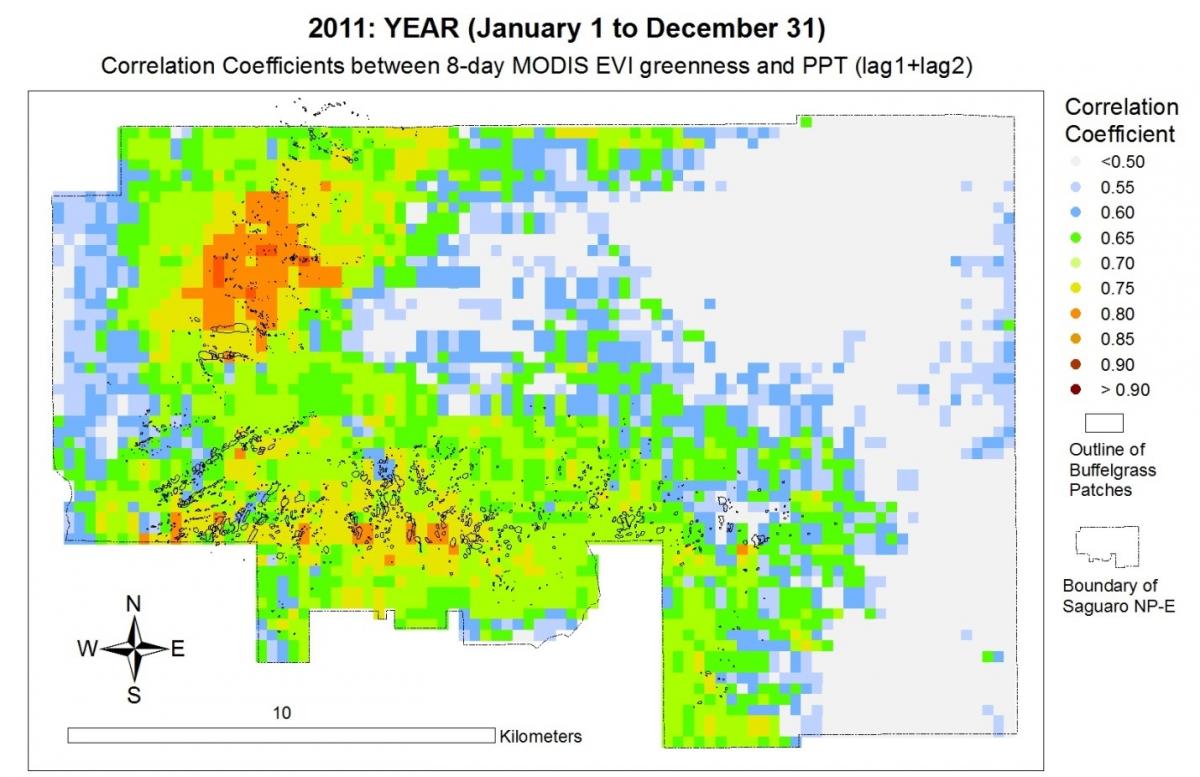
Regional buffelgrass distributions are mapped using correlations quantified at the observer field sites. At each pixel, the correlation between MODIS data and precipitation from prior time periods is calculated for a year, and the correlation coefficient extracted and mapped. These correlation coefficients quantify the strength of the relationship between MODIS data and the lagged precipitation values. This example for 2011 uses 8-day composite MODIS-EVI values with 8-day PRISM precipitation totals (http://prism.oregonstate.edu/) summed for the prior two time periods. Higher correlation values are associated with denser patches of buffelgrass (small black outlines).

