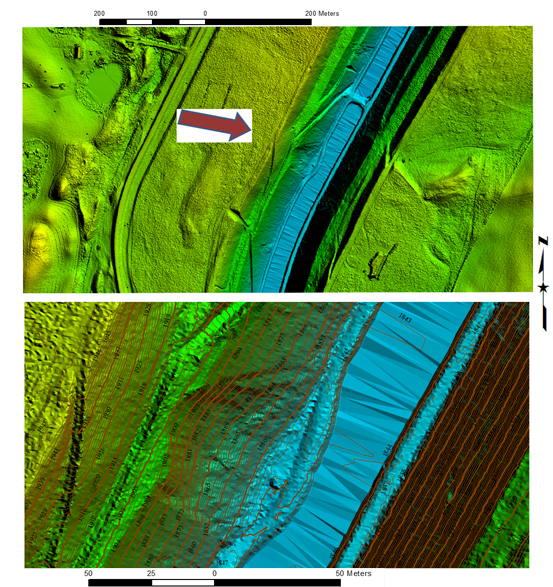
High-resolution lidar data were collected and compared to historical contour data to evaluate the condition of canal banks. Lidar point cloud data with a horizontal accuracy of 0.6-m root mean square error (RMSE) and vertical accuracy of 15-cm RMSE were used to create 1–foot (0.3-m) contours of a canal side-slope that had been slipping. This contour map was compared to the original AutoCAD contours to calculate the amount of change and the areas impacted. This comparison was not straightforward. The AutoCAD contours were based on older coordinate system information—the North American Datum of 1927 (NAD27) and the Clark Ellipsoid of 1866--while lidar data were based on the more recent Geodetic Reference System of 1980. The difference in ellipsoid definitions can result in elevation discrepancies of over a meter in this area. North Dakota has also risen in elevation by approximately 1.4 to 1.6 feet (0.4 to 0.5-m) in the last 80 years due to isostatic rebound, as huge, heavy glaciers have melted and receded from the Earth’s surface. Thus a given elevation in the old drawing does not necessarily equal the same elevation in a modern lidar dataset. Ground controls (i.e., original benchmark elevations) were used to help compute the difference between these two layers for a standardized comparison.

The top image is the lidar data showing the slump in the canal (red arrow) using GlobalMapper software. The bottom image is a close-up of the 1–foot (0.3-m) contours on the slide area.

