When railway tracks are located close to wetlands, rivers, or lakes, dynamic water level changes can have substantial economic and environmental impacts on railroad operations. For example, BNSF Railway is spending millions of dollars to raise track beds through the Devils Lake region of North Dakota, where rising lake levels threaten to flood the existing tracks. As a result, there is a need to accurately model watersheds and landscapes for environmental engineering and railroad operations purposes using wetland and surface water mapping tools. A recent large-area application used a state-of-the-art, semi-automated process to create the new Minnesota National Wetland Inventory (MNWI) for east-central Minnesota. The new MNWI incorporated high-resolution, multispectral aerial imagery from multiple seasons, high-resolution elevation data derived from lidar, and other image and geospatial datasets. Image object segmentation and random forest classification techniques were used along with a final digital image interpretation review to create new wetland maps. More than 1,000 validation data points were acquired using both independent image interpretation and field reconnaissance. Overall accuracy for wetland identification was 90% compared to field data and 93% compared to image interpretation data. Railroads can use both these data and this approach to keep their geospatial wetland maps and surface water infrastructure current.
http://www.dnr.state.mn.us/eco/wetlands/nwi_proj.html


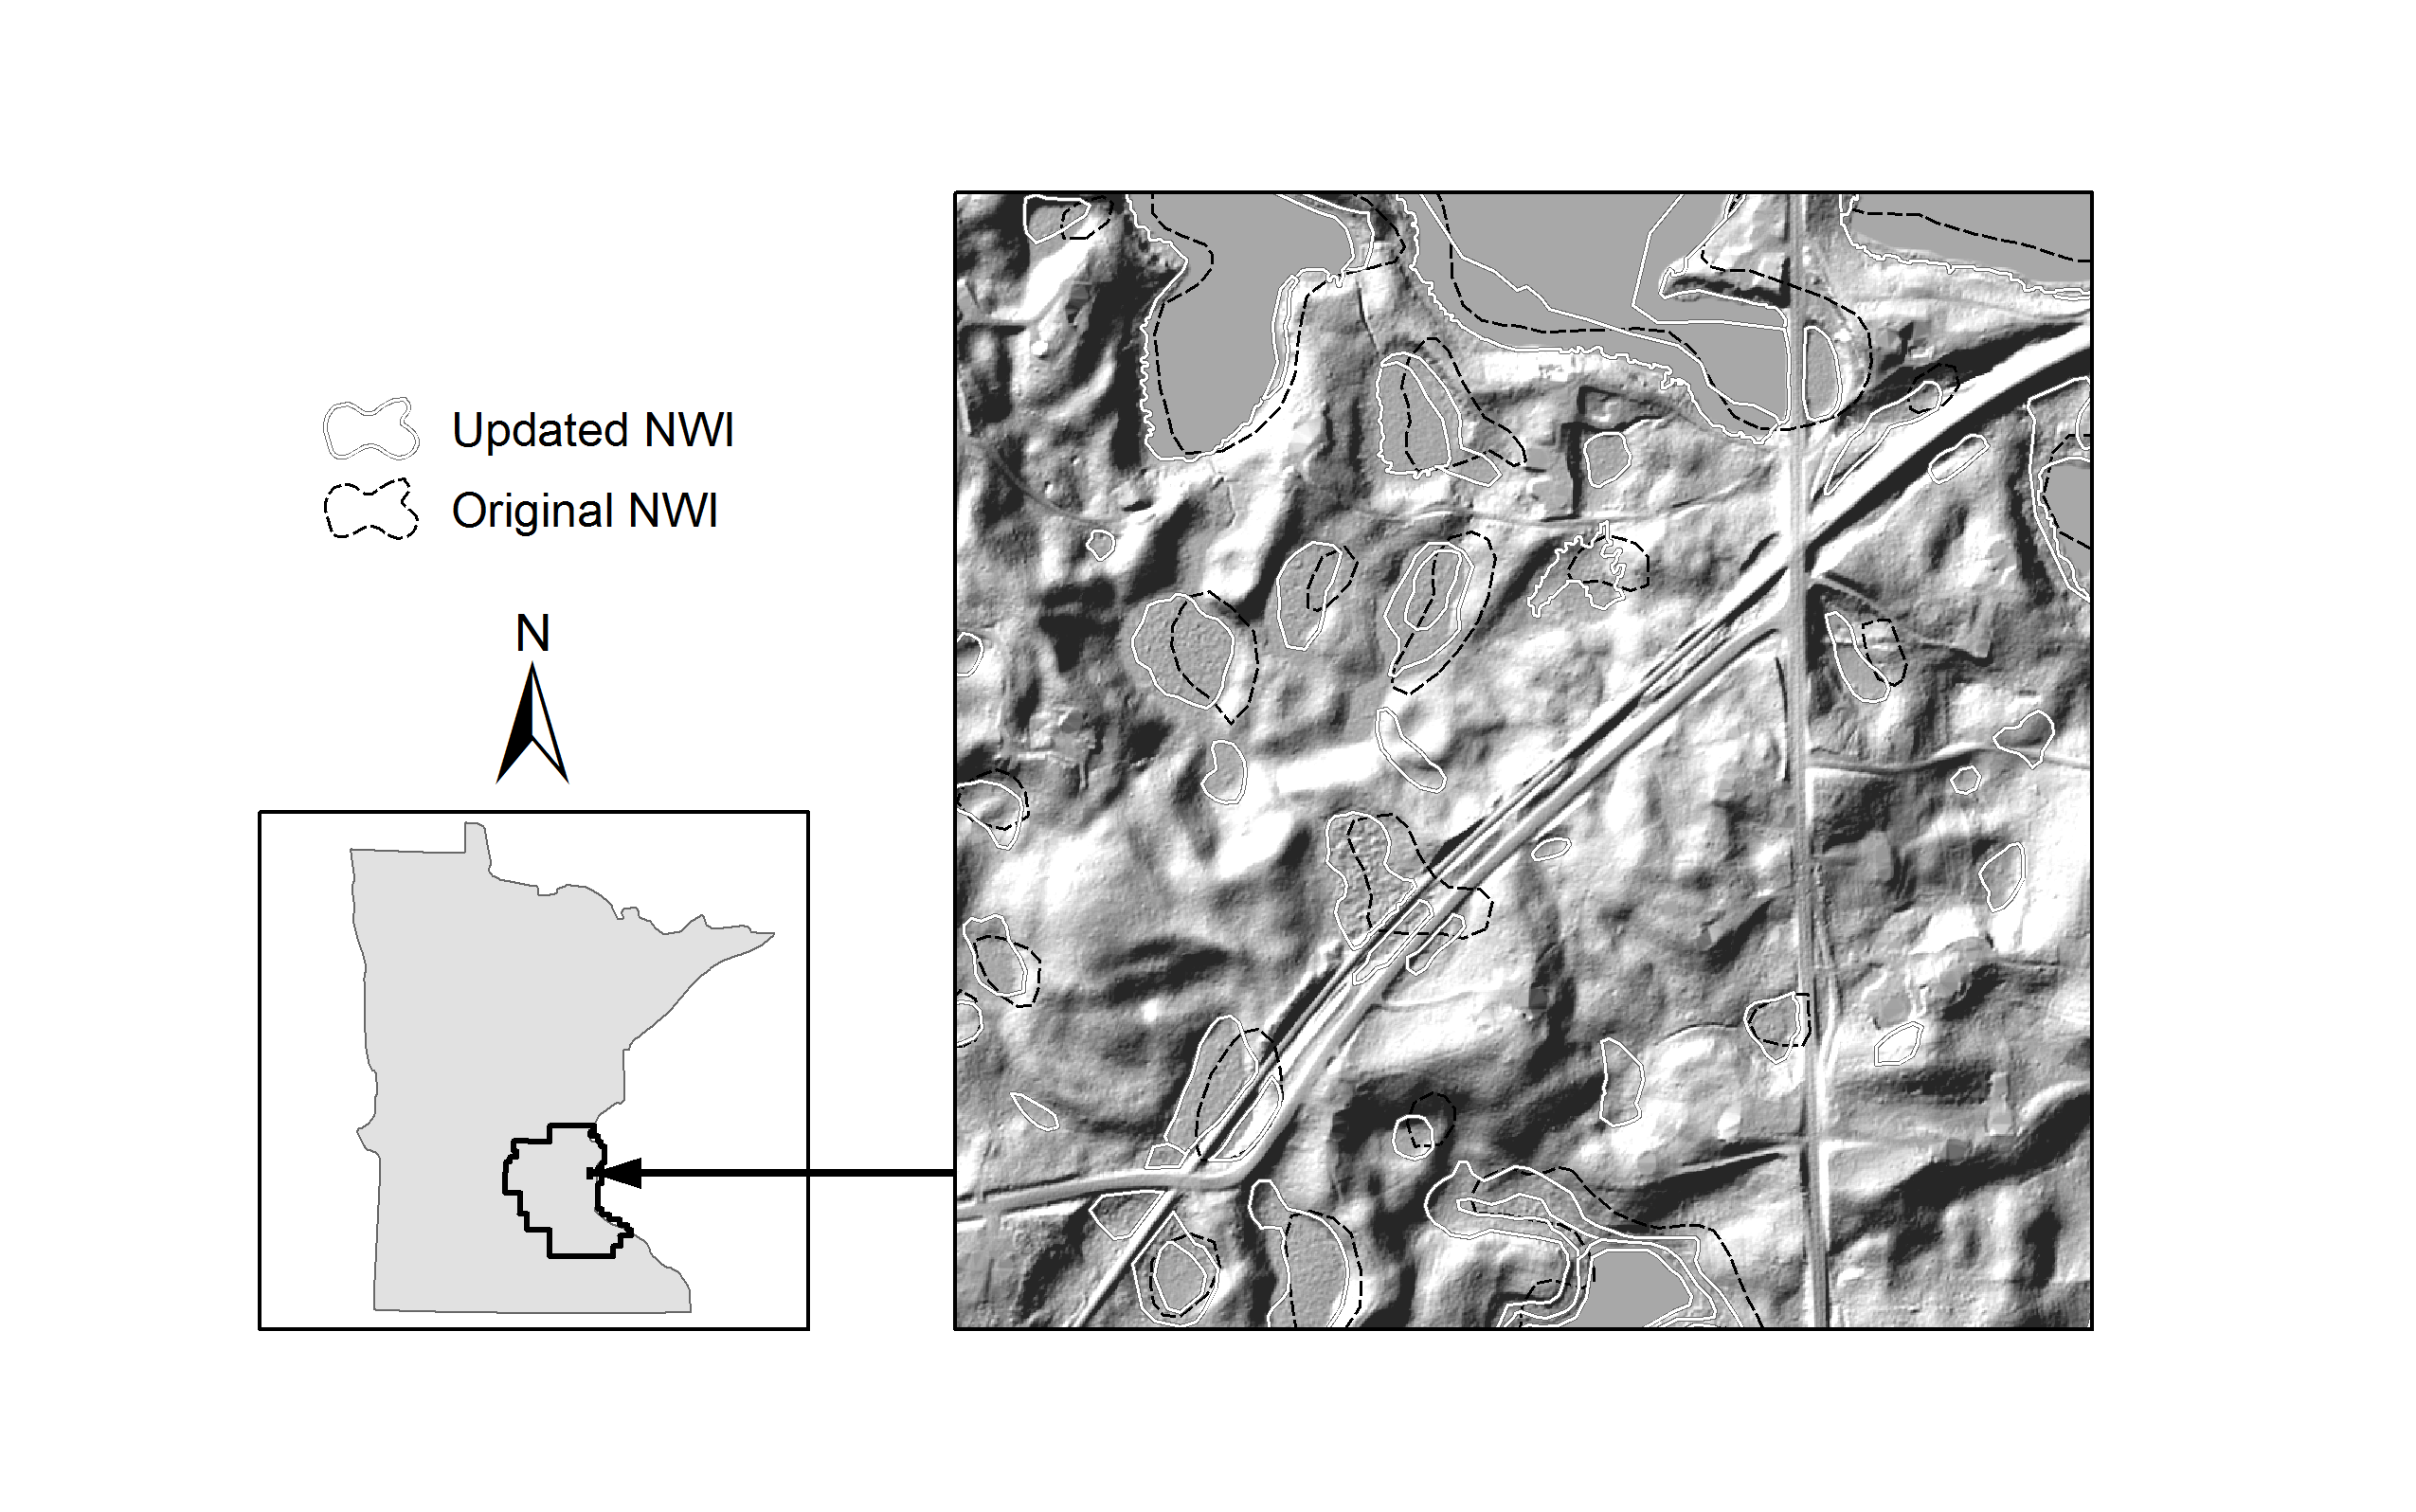
(Top) Project area map with a comparison of the original NWI to the updated Minnesota NWI on a shaded relief map derived from lidar. The Canadian National Railroad runs from the bottom left to the upper right of the image map; intersecting lines are road crossings. The black dashed lines indicate that the original NWI inaccurately mapped wetlands as crossing over railroads. The locations of the new wetland polygons (solid gray lines) more accurately conform to the landscape.
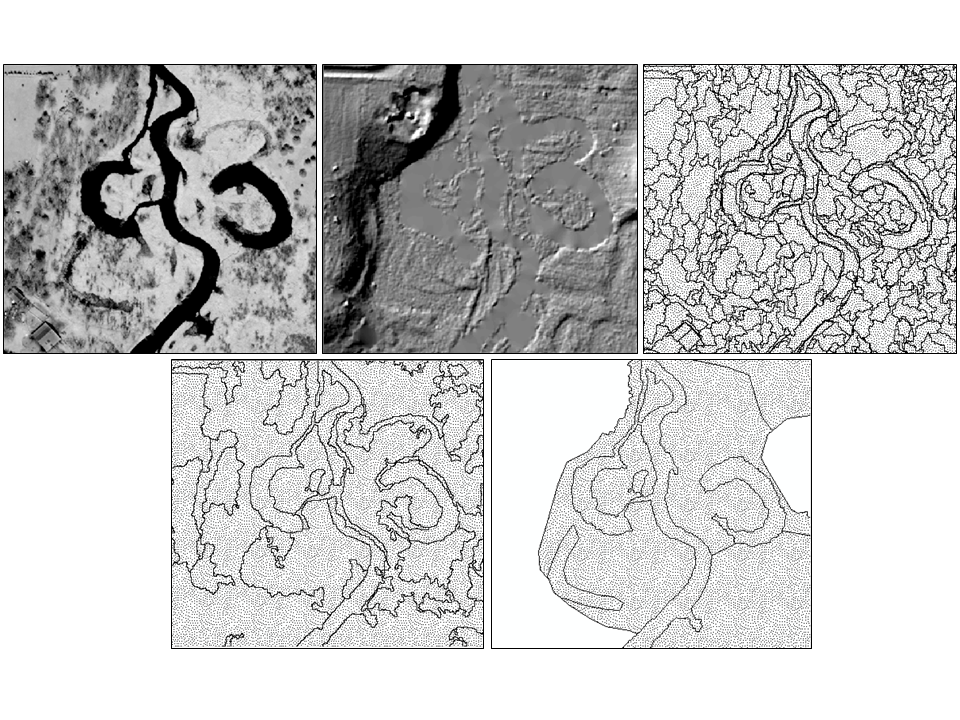
(Bottom) Image object mapping of wetlands as shown with the spring aerial image (upper left), the shaded relief image (upper center), the initial image segmentations (upper right), the refined image objects (lower left), and the final wetland inventory map (lower right, with uplands represented by white areas). The images are 1,000 m wide with North oriented toward the top.

