With a greater focus on landscape conservation to support and integrate existing program activities, FWS core responsibilities increasingly require standardized, regularly updated landscape-scale mapping products. To support this effort and leverage existing Government investments in nationally available data, the FWS is developing a suite of analysis tools using open-source components and publishing them to the source repository GitHub. This development model provides the maximum likelihood that other practitioners, both inside and outside of FWS, can generate standardized products that encourage collaboration and reduce uncertainty due to differences in underlying data.
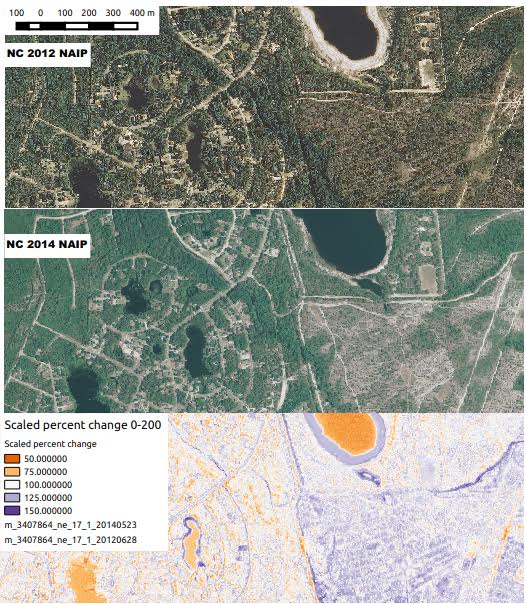
The U.S. Department of Agriculture National Agriculture Imagery Program (NAIP) acquires 4-band imagery (near-infrared, red, green, and blue) for much of the conterminous United States at 1-m resolution. The standard repeat time interval is 2 years. As a demonstration, the entire North Carolina NAIP image datasets for 2012 and 2014 were analyzed on a per tile basis using the Normalized Difference Vegetation Index (NDVI) created from the red and near-infrared bands. Existing Python scripts, written with the open source Geospatial Data Abstraction Library (GDAL) and NumPy libraries, formed the backbone of a class-based approach to interpreting high-resolution data with limited spectral bands. From the NDVI calculations, difference scores between the two years were converted to percentages and scaled to values from 200 to 0 (200 = 100 percent change , 0 = –100 percent change).
By leveraging open-source geospatial components and highly-optimized code, statewide and high-resolution analysis is feasible on modern computer architectures with minimal overhead. For example, the percent NDVI change for North Carolina can be processed in approximately 28 hours at a speed of 27 seconds per tile. The resulting data layer can be colorized and served as a Web mapping service to create a standard, accessible depiction of environmental change, enabling environmental scientists to quickly make visual evaluatations of land cover change in their areas of interest. As a collaborative, open-source toolset, the FWS is integrating additional functions such as Hydrologic Unit Code summarization, integration with climate data (NetCDEF products), and classification masks of basic cover types such as forest and water. The resulting code-base is in the public domain and creates a continually updated set of analytic tools that support FWS goals in science applications.

Example analysis showing mapped changes between two subsequent NAIP acquisitions. Values are rescaled, with 0 percent change shown as 100, 100 percent decrease in NDVI shown as 0, and 100 percent increase shown as 200. North is oriented toward the top of the image.

