WaterSMART (Sustain and Manage America’s Resources for Tomorrow) is an interdisciplinary and collaborative DOI initiative focused on improving water conservation and helping resource managers make sound water-use decisions. The USGS is focusing work on developing a national framework for monitoring water use and water productivity on irrigated lands using remote sensing and modeling approaches to better understand the relationships between croplands, drought, water, and food security.
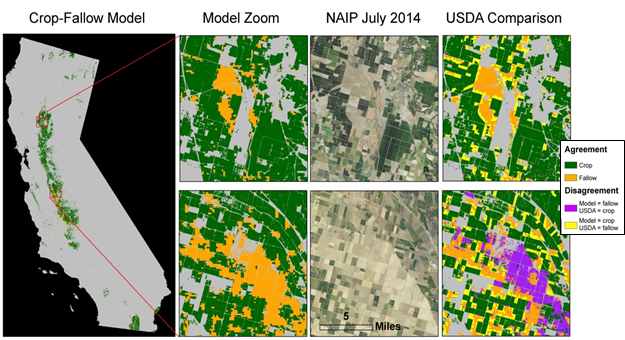
USGS scientists have developed an automated cropland classification algorithm (ACCA) that can routinely map cropland status (planted or fallowed) annually and is transferrable to any area of the Nation using Moderate Resolution Imaging Spectroradiometer (MODIS) Normalized Difference Vegetation Index (NDVI) data as a measure of vegetation greenness. The algorithm compares the current greenness of a cultivated pixel to its historic greenness and to the greenness of all cultivated pixels within its climate division. Croplands are identified as those which are statistically similar to the greenest pixels (i.e., a “pure cropland signal”, defined as above the median value) in both relative greenness and dynamic range of greenness when compared to pixels both historically and within its neighborhood. In other words, to be classified as a cropland, the pixel must “look” and “act” like a crop when compared to either historic or neighborhood values. The model has been applied to the cultivated lands in California’s Central Valley and validated with field data collected in 2014, producing a higher overall accuracy than a Landsat-based U.S. Department of Agriculture (USDA) model, including a 25% increase in the user’s accuracy of fallowed cropland. The model will be applied to the entire United States beginning in 2016.
This research highlights USGS capabilities to supply science to decision makers so that they can act locally, where issues interlinking water, climate, and food are of critical importance for the sustaining environment, ecology, and the economy.
http://www.usgs.gov/climate_landuse/lcs/projects/wsmartmap.asp

Automated mapping of croplands and cropland fallows. The ACCA model (Figure left, with zoomed insets adjacent) compares the current MODIS monthly greenness to historical greenness patterns observed between 2001 and 2013 and to cultivated pixels with its current NOAA Climate Division neighborhood. The insets at right show how well this model fits with the model produced by the USDA, which uses Landsat 8, Deimos, and Farm Service Agency data. The center insets show the NAIP aerial imagery collected in July 2014. This model can easily translate to new areas because it looks at the relative greenness of a pixel temporally and spatially, thereby self-calibrating to new locations.

