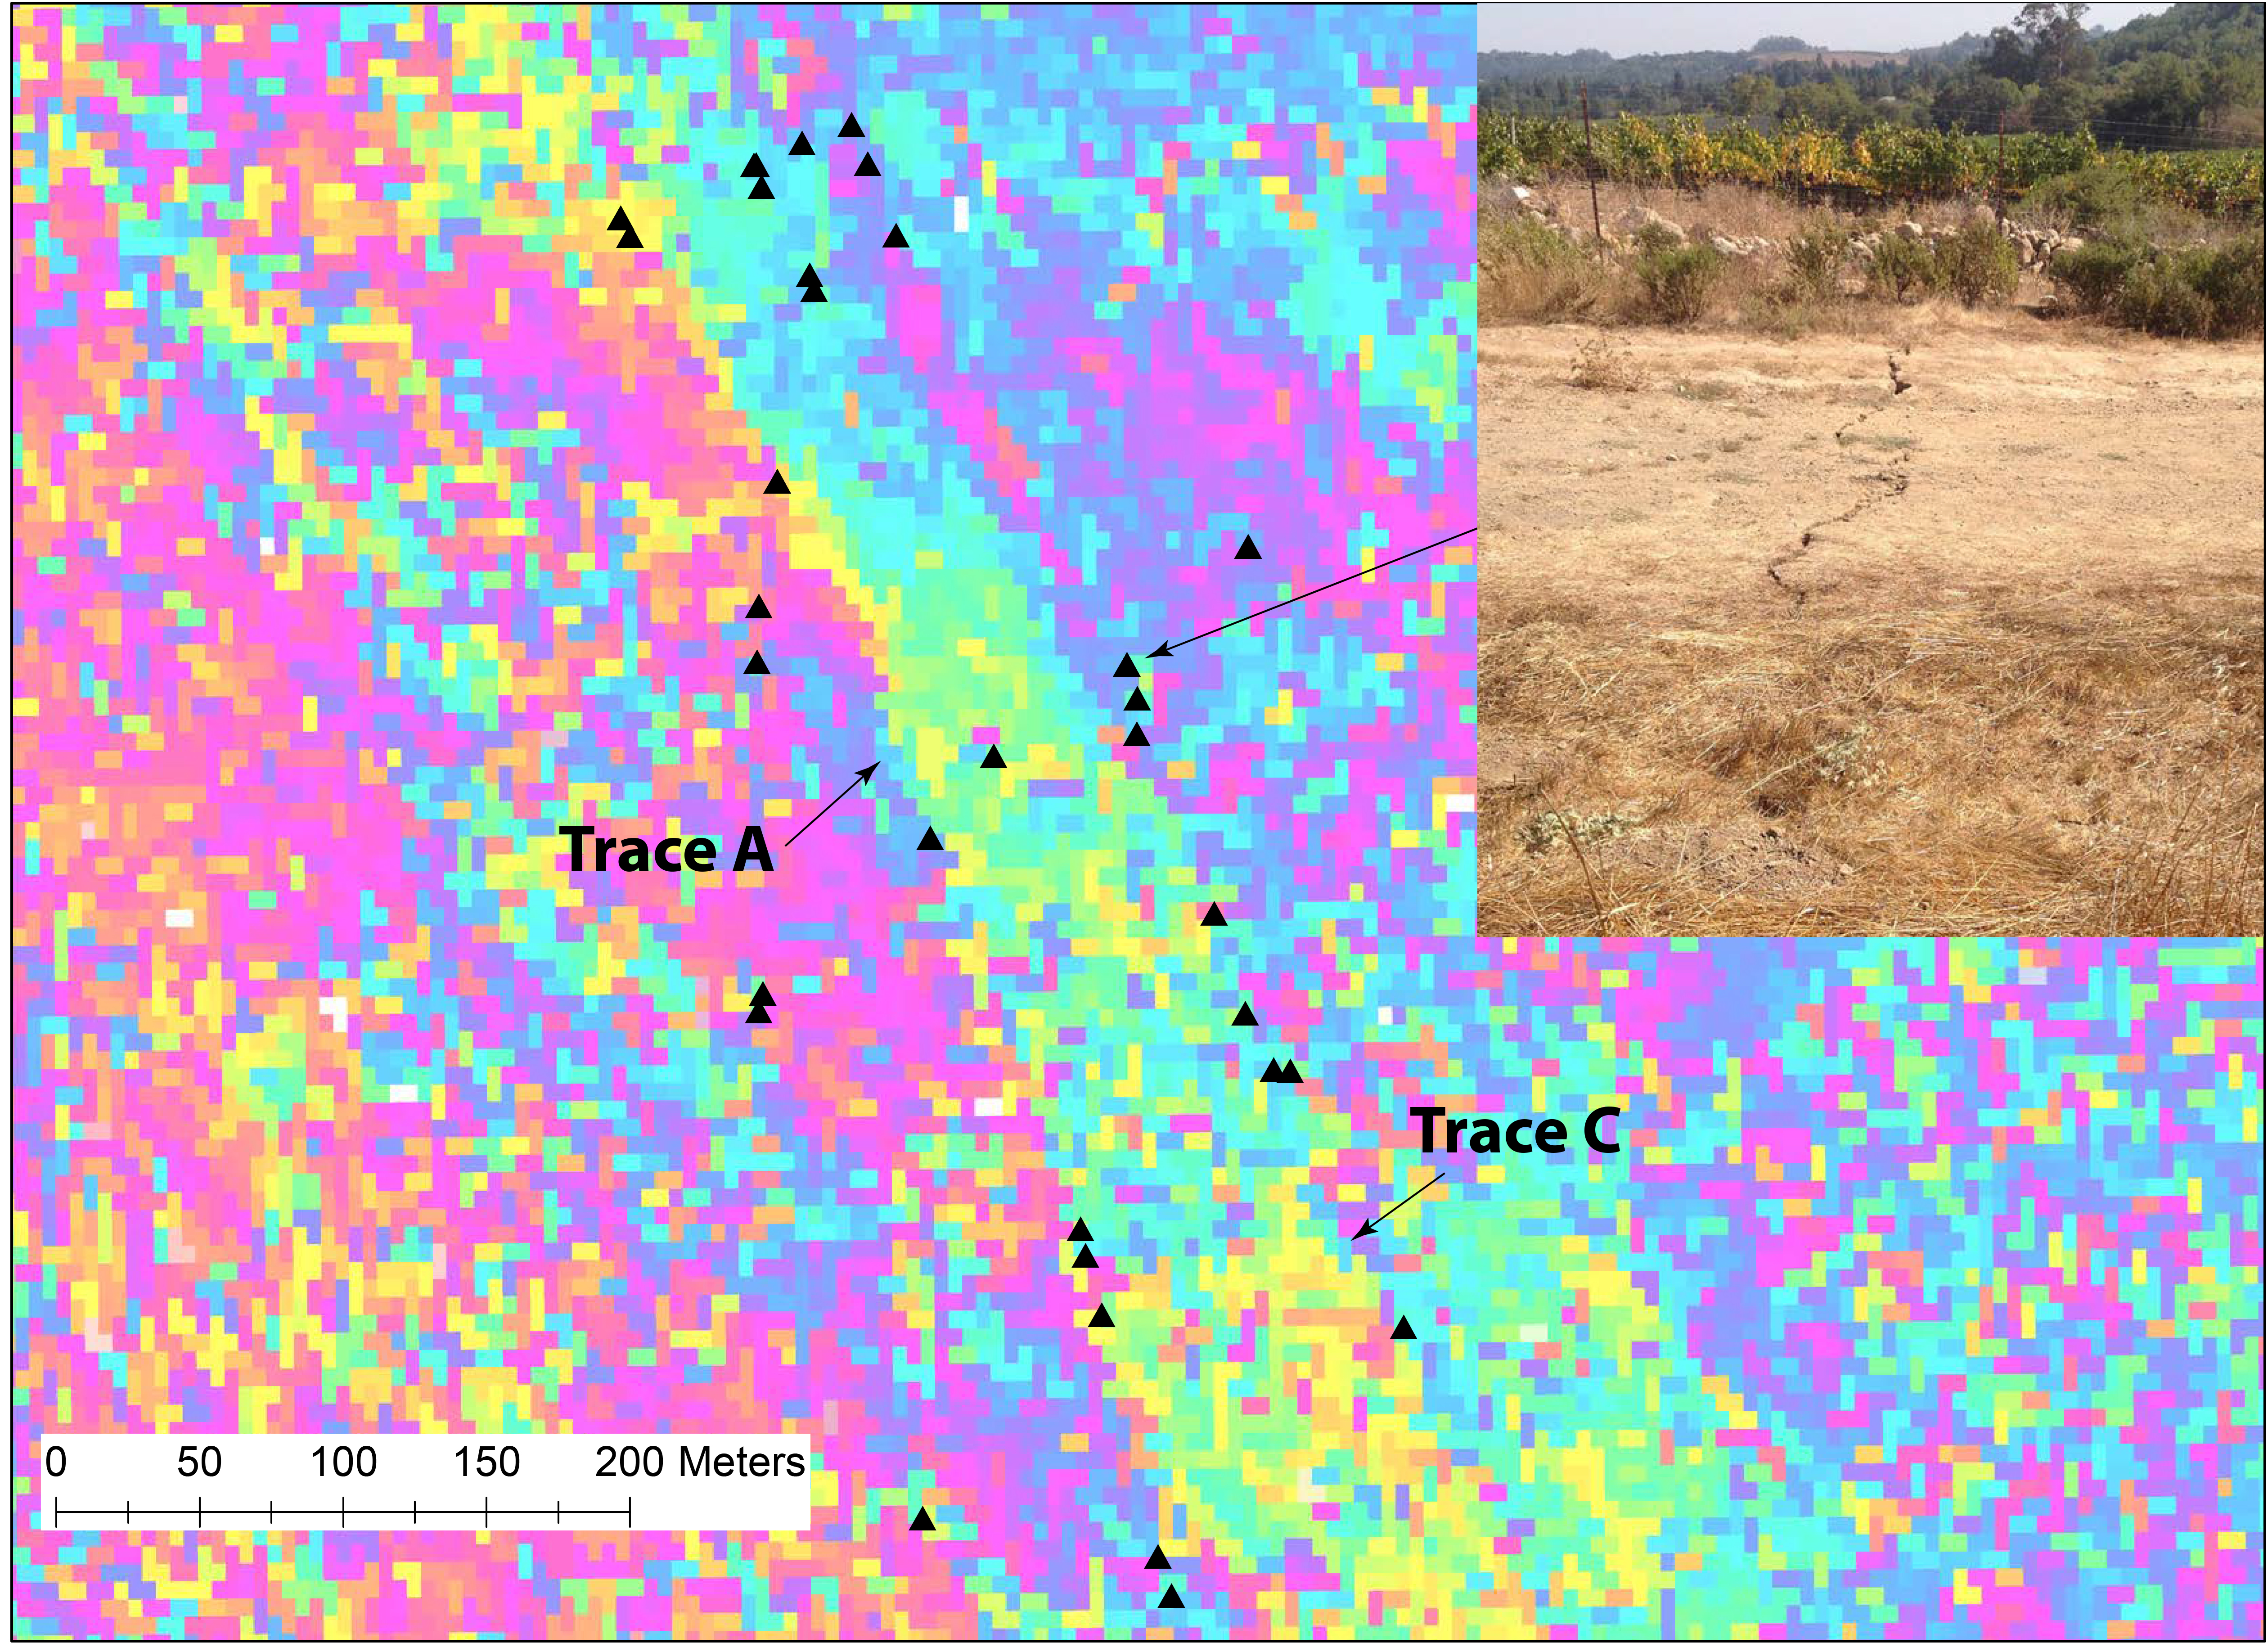
The magnitude 6.0 South Napa earthquake produced the largest and most extensive coseismic surface rupture of any documented California earthquake of similar magnitude. While most of the fault displacement occurred along a single fault trace, as much as 25% of the total fault slip occurred on at least five additional traces across a zone more than 2 km wide. Most of the secondary fault slip was of small displacement ( 8 cm), occurred discontinuously, and was difficult to trace in the field. Recognition of the full scope and complexity of the rupture was possible through use of Uninhabited Aerial Vehicle Synthetic Aperture Radar (UAVSAR) imagery acquired and processed by NASA’s Jet Propulsion Laboratory. “Coseismic” interferograms (May 29, 2014–August 29, 2014 image pairs) were made available to USGS field crews and the public on September 1, 2014, one week following the earthquake. At that time, field crews had documented ~12 km of rupture on the principal trace north of the epicenter, and ~5 km of rupture on a secondary trace, along with numerous observations of “anomalous” ground deformation at individual sites where the tectonic origin or continuity of faulting was unclear. The UAVSAR imagery, which in this case was capable of detecting line-of-site displacements of 2 cm, showed that small displacements apparently had occurred along additional parallel fault traces previously undocumented, as well as linear continuity of deformation between sites where “anomalous” deformation was observed, supporting a tectonic origin for displacements where such an interpretation was unclear based solely on ground observations.
The UAVSAR data have allowed field crews to work more effectively at locating and documenting the complex rupture pattern as well as extending the map of the principal rupture several kilometers to the north. In addition, the region south of the epicenter comprises tidal marsh and sloughs—much of which was inaccessible to field crews or heavily vegetated such that small displacements would be difficult to observe. Discontinuous UAVSAR lineaments within the marshes along strike of the main trace, observable in both the May 29–August 29, 2014, and subsequent August 29–October 22, 2014, Interferometric Synthetic Aperture Radar (IfSAR) images, show that coseismic displacement of up to 4 cm and postseismic slip of up to 2 cm likely extended at least 8 km south of the epicenter, expanding the coseismic surface rupture length to ~23 km.

Portion of UAVSAR interferogram (Line 23511) near the northern end of the South Napa earthquake rupture zone, showing lineaments associated with the principal fault trace (Trace A), where the largest displacements and postseismic slip was observed, and a secondary trace (Trace C). Triangles are field locations where ground cracks have been observed. UAVSAR imagery was instrumental in directing field crews to locations where small-displacement faulting could be documented (photo; 6 cm dextral slip on Trace C). North is oriented toward the top of the image.

