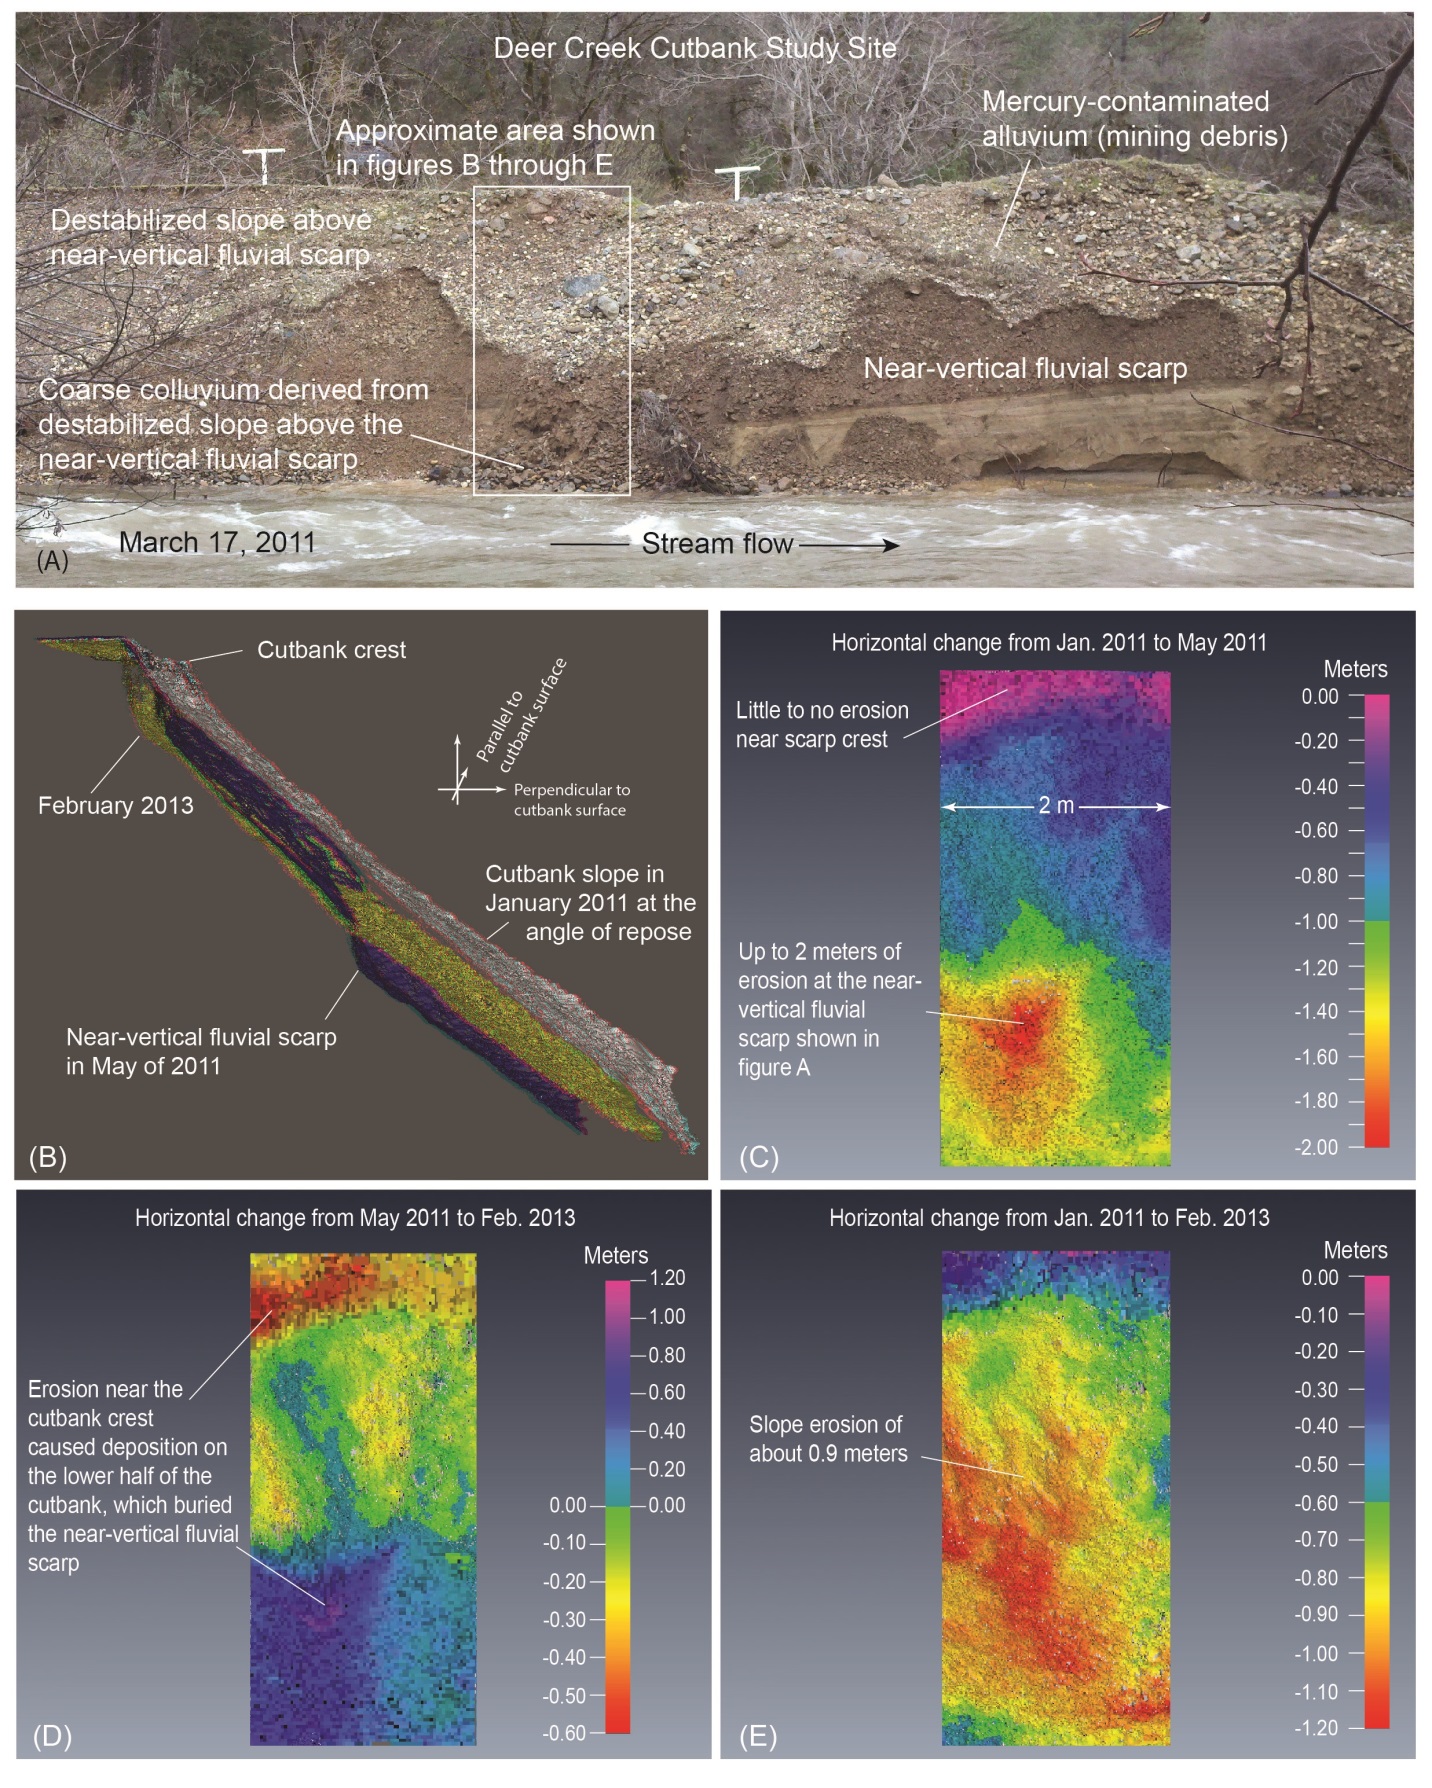
At the Deer Creek study site in Nevada County, California, the USGS Western Remote Sensing and Visualization Center (WRSVC) has utilized tripod-mounted lidar to quantify the eroded volume of mercury-contaminated sediment associated with historical gold mining from a discrete section of cutbank for three periods between 2010 and 2013. The eroded volumes were combined with laboratory analyses of mercury concentration and grain-size distribution in the sediment to estimate the amount of mercury mobilized by Deer Creek for the various periods. Depending on the amount of precipitation in a given period, the eroded volumes ranged from tens to hundreds of cubic meters.

(A) A section of the 8-m-high and 50-m-long cutbank is shown during a high streamflow event in March 2011. This event and others in early 2011 caused a near-vertical fluvial scarp to be formed and mobilized more than 200 m3 of mercury-contaminated sediment into Deer Creek. (B) An oblique 3D anaglyph for a selected section of the cutbank. Red/blue 3D glasses (with red lens on the right side) are needed for enhanced 3D viewing. The image shows the cutbank surface at three time periods: January 2011, (white) cutbank slope is at the stable angle of repose; May 2011 (dark blue) destabilized slope after the high streamflow events; and February 2013 (yellow) retreat of cutbank slope. (C) through (E) are color-coded change maps showing the amount of horizontal change in meters for the same area and time periods shown in (B).

