On the San Carlos Apache Reservation in east-central Arizona, vegetation types such as ponderosa pine forests, pinyon-juniper woodlands, and grasslands have important ecological, cultural, and economic value for the Tribe. This value extends beyond the Tribal lands and across the western United States. Vegetation across the southwestern United States is susceptible to drought conditions and fluctuating water availability. Remotely sensed vegetation indices can be used to measure and monitor spatial and temporal vegetative response to these water and drought dynamics. USGS scientists derived the Modified Soil Adjusted Vegetation Index II (MSAVI2) from Moderate Resolution Imaging Spectroradiometer (MODIS) imagery to measure the condition of three dominant vegetation types (ponderosa pine forest, woodland, and grassland) in response to two fluctuating environmental variables: precipitation and the Standardized Precipitation Evapotranspiration Index (SPEI). The analysis, conducted for 2002 through 2014, showed that grassland and woodland have a similar moderate to strong, year-round, positive relationship with both precipitation and SPEI. This suggests that these vegetation types respond negatively to drought conditions and are more susceptible to initial precipitation deficits. Ponderosa pine forest had a comparatively weaker relationship with monthly precipitation and summer SPEI, indicating that it is more buffered against short-term drought conditions. This research highlights the response of multiple dominant vegetation types to seasonal and interannual water availability and demonstrates the effectiveness of multitemporal remote sensing imagery as a tool for the detection of vegetation response to climate change at regional scales. Such tools can provide cost-effective monitoring to inform management of drought-affected areas.
https://www2.usgs.gov/climate_landuse/lcs/projects/vcarbon.asp
http://geography.wr.usgs.gov/science/TribalLandVegetation/index.html

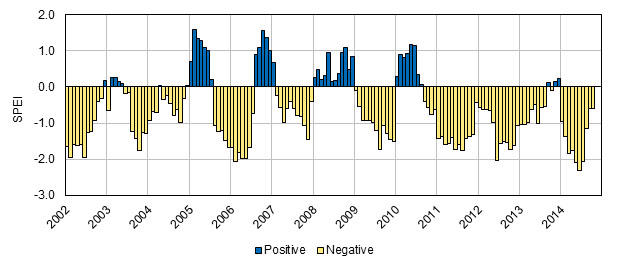
Time series for Standardized Precipitation Evapotranspiration Index (SPEI) for the study period. Positive SPEI values are shown in blue while negative SPEI values (drought) are shown in yellow.

