In the summer of 2015 Crater Lake National Park (CRLA) hosted a research fellow with the George Melendez Wright Young Leaders in Climate Change program; Donal O’Leary, then a Masters student in Geography at Western Washington University, examined the link between two of Crater Lake’s prized resources: snowpack and alpine plants. The focus of this study was to examine the effect that a declining snowpack would have on plant phenology in the CRLA landscape. For alpine zones in the Mountain West, climate change is expected to bring an earlier spring and warmer temperatures, leading to a general decline in mountain snowpack. By studying this issue and related questions, park managers may begin to identify adaptation strategies for dealing with climate change’s influence on park resources.
Trends and changes in daily Moderate Resolution Imaging Spectroradiometer (MODIS) images over 10 years capture the dynamics between snow and vegetation, allowing NPS researchers to characterize relationships between the spatial and temporal patterns of snow accumulation, snow melt, vegetation greenup and vegetation dormancy. Results show that, when looking at the park as a whole, an earlier than average snowmelt coincides with a longer than average growing season. Furthermore, it is clear that extreme snow anomalies (e.g., a very large or small snow year) correspond to an inverse growing season anomaly (short or long growing season, respectively). Although the correlations examined are not perfect and there are limitations with the analysis, this work provides a meaningful baseline for further discussions. This method will be easily repeated for other park units, or used with improved satellite imagery as they become available.
https://vimeo.com/user40294023

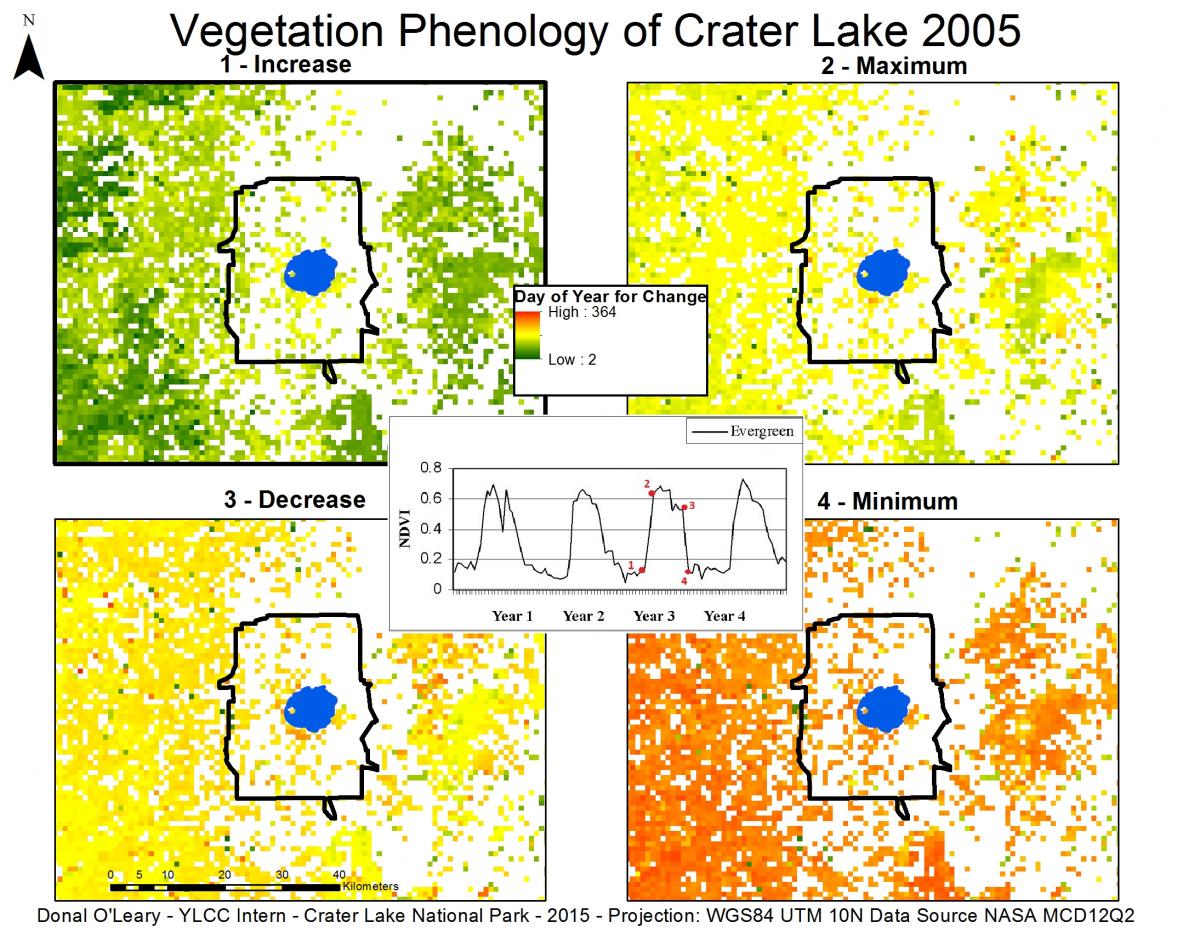
Maps of phenology metrics based on MODIS Normalized Difference Vegetation Index (NDVI) profiles. The inset profile shows the Day of Year in 2005 (Year 3) for the four key phases of phenology extracted from the NDVI profile at each pixel and mapped in the four images, as follows: 1-Increase = start of the growing season, 2-Maximum = time of maximum green-up, 3-Decrease = end of the growing season, and 4-Minimum = time of maximum loss of greenness.

