Understanding current carbon fluxes is important for developing remediation or mitigation strategies in response to anticipated changes in atmospheric greenhouse gas concentrations under future climate scenarios. Although atmospheric carbon dioxide (CO2) fluxes from rangelands and croplands are small relative to those of forest systems,these land covers make up a large area in the conterminous United States (CONUS). In addition, historical grasslands (Mollisols) typically contain large soil carbon stocks that could be vulnerable to emission under altered climate conditions and land management practices.
To estimate weekly carbon fluxes from rangelands and croplands, data-driven rule-based models were developed using crop and grassland flux tower datasets from the Fluxnet, Ameriflux, and Agriflux networks and from independent flux tower locations. Crop and grassland flux tower estimates for weekly carbon flux associated with gross primary production, ecosystem respiration, and net ecosystem production are estimated with detailed light response curve analysis, which also facilitates the filling of data dropouts caused by temporary equipment failures. Input drivers for the algorithms include weekly Normalized Difference Vegetation Index (NDVI) at 250-m resolution and derived phenological metrics, soil attributes (available water capacity, clay content, soil organic carbon from SSURGO), weather data (precipitation and air temperature), and climate data. To facilitate crop carbon flux mapping, 250-m resolution crop type maps were constructed to capture consistent crop rotation histories back to 2000. Crop type mapping was accomplished with decision tree algorithms using weekly NDVI, phenological metrics, weather data (precipitation and temperature), climate data, elevation, slope, aspect, irrigation, soils (available water capacity, soil organic matter, bulk density, and clay content), ecoregions, and major land resource areas as defined by National Resource Conservation Service (NRCS).
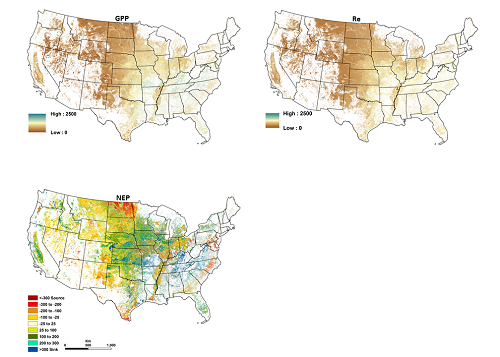
Resultant weekly carbon flux maps are summarized to show annual time series, seasonal trends, and comparisons between various crop types and grasslands. An error map produced for inter-annual carbon flux estimates and combined with extrapolation severity quantified uncertainty and identified optimal future flux tower locations. Preliminary results indicate 129 g C m-2 day-1 of additional carbon is removed from the atmosphere by grasslands when compared to non-irrigated crops. Grasslands were near carbon equilibrium at about 372 mm of annual precipitation, while non-irrigated crops require 629 mm of annual precipitation for carbon equilibrium. Flux tower databases are also being used to conduct regional synthesis of carbon fluxes in legume crops, grain crops, grasslands, shortgrass prairie, mixed grass prairie, and tallgrass prairie systems.
The feasibility of making annual crop type maps at the end of the growing season, which is much more rapid than existing products, will also be assessed.
http://lca.usgs.gov/lca/cflux_gplains/index.php

Mean gross primary production (GPP), ecosystem respiration (Re), and net ecosystem production (NEP) for 2000–2013 masked for grasslands, sagebrush-steppe ecosystems, and five crop types: alfalfa, corn, millet, soybean, and winter wheat.

