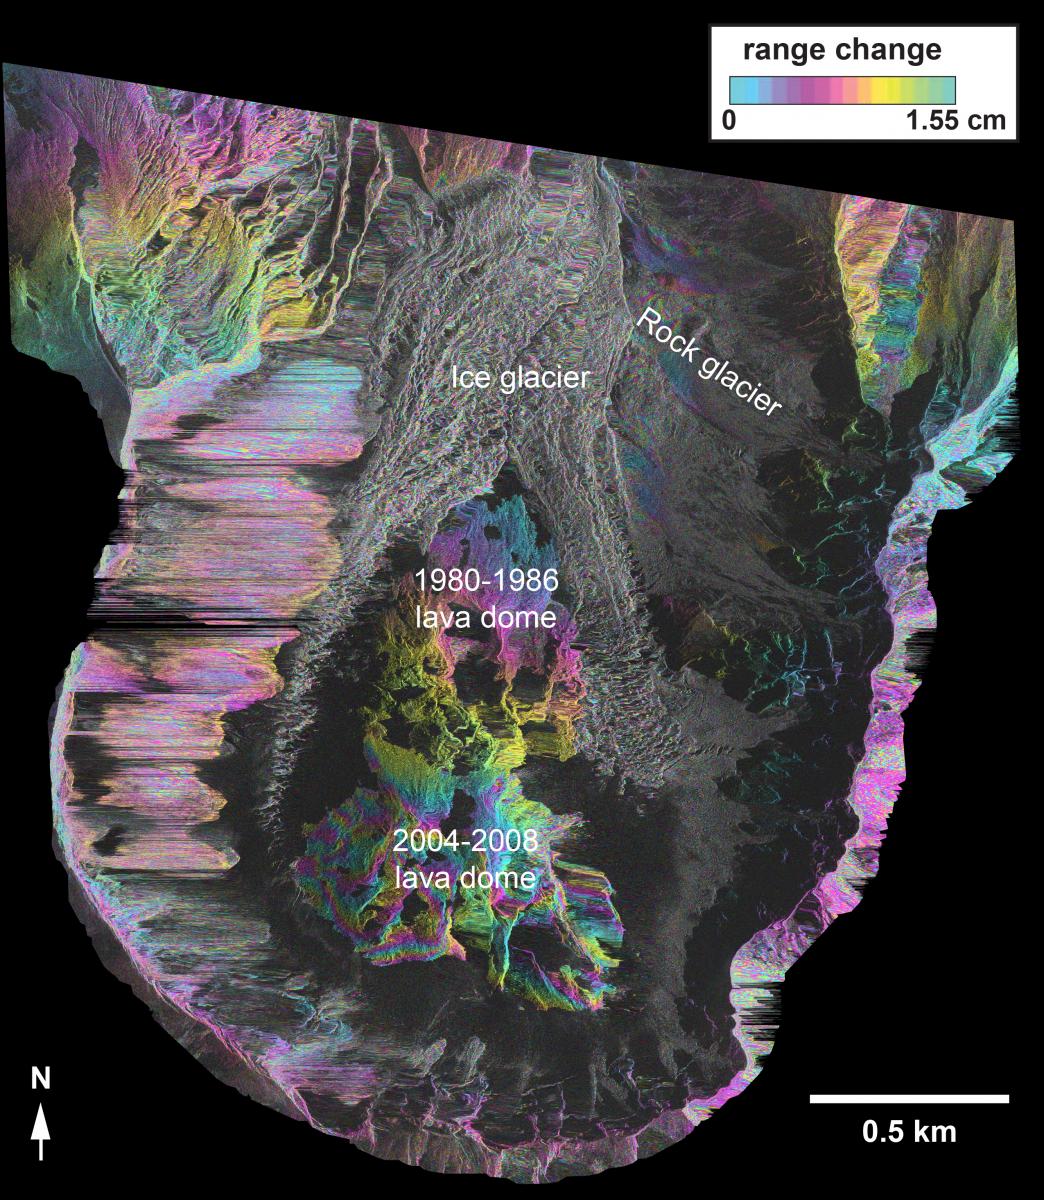
The catastrophic eruption of Mount St. Helens in Washington State on May 18, 1980, removed the upper 400 m of the volcano and left a large horseshoe-shaped crater. Two subsequent eruptive episodes, in 1980–1986 and 2004–2008, partially filled this crater with domes of solidified lava, and glacial ice has coated much of the remaining crater floor. Global Positioning System data suggest that the 1980–1986 lava dome is subsiding by a few centimeters per year, but the spatial pattern of this deformation cannot be discerned from one measurement alone.
New high-resolution “staring spotlight” synthetic aperture radar (SAR) data collected by the German TerraSAR-X satellite, combined with a lidar digital elevation model, provide a high-resolution (25 cm) view of Mount St. Helens crater. By interferometrically combining SAR scenes acquired on different dates, it is possible to measure surface displacements that have occurred over the ensuing time period. These data indicate that the 2004–2008 lava dome is subsiding rapidly, by a few centimeters per week, with spatial variations in deformation date roughly correlative with dome thickness. The 1980–1986 dome is also subsiding, but at a much lower rate of a few centimeters per year, likewise variable according to dome thickness. In addition, motion of rock glaciers along the crater walls is apparent. A better understanding of the post-eruptive behavior of lava domes is critical to monitoring for signs of future activity. Signs of renewed magma ascent beneath the crater will likely disturb the subtle pattern of dome subsidence and should be detectable using high-resolution SAR data. Mapping dome deformation may also reveal the thermal characteristics of the lava and provide a means of estimating thickness—a technique that can be used at other lava dome eruptions worldwide, especially where ground-based monitoring data and observations are not possible.

Interferogram composed of TerraSAR-X staring spotlight SAR images acquired on August 17 and 28, 2014. Colored fringes indicate ground deformation, with one set of fringes equivalent to 1.5 cm of ground motion along the radar line of sight. The large number of fringes on the 2004–2008 lava dome indicate rapid subsidence there, while fewer fringes on the 1980–1986 lava dome attest to lower

