For decades, the USGS has conducted geodetic monitoring of Mauna Loa, the largest volcano in the world, measuring well over 14,000 m from its base beneath the ocean to its summit above sea level. The volcano makes up more than 50% of the island of Hawaiʻi and has been the source of numerous destructive lava flows over the past 200 years. The most recent eruption was in 1984, making the current 31-year period the longest without eruption since the early 1800s. Mauna Loa has, however, experienced several periods of unrest since 1984. Deformation measurements aid in detecting the accumulation and movement of magma beneath the volcano that might predict an eruption. Based on both deformation and seismic activity, the USGS Hawaiian Volcano Observatory raised the alert status of Mauna Loa to “Advisory” in September 2015, indicating that the volcano was no longer at a background level of activity.
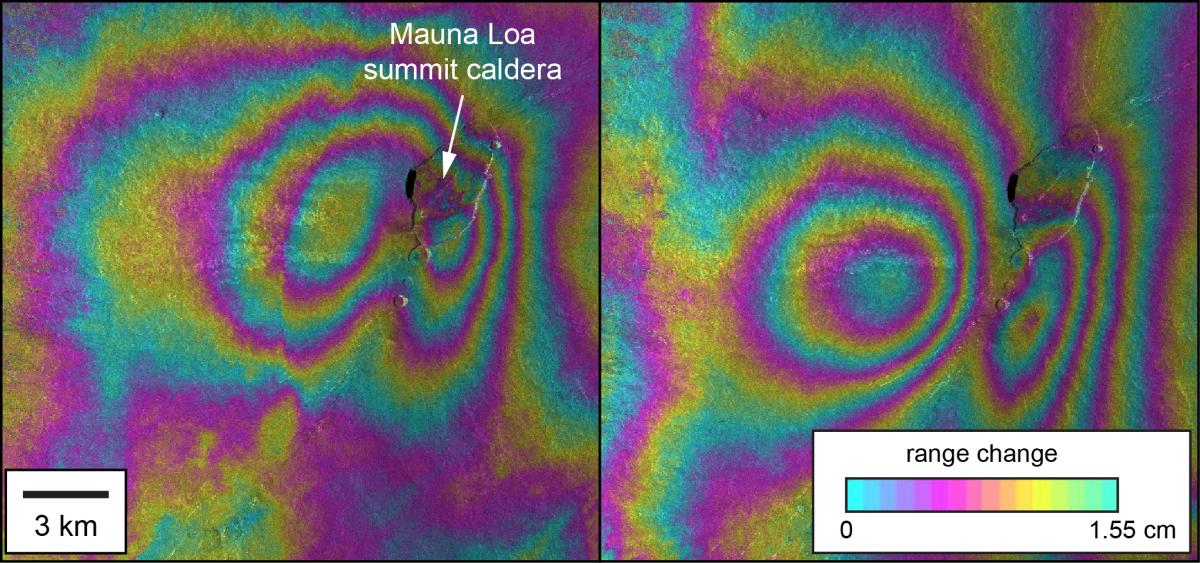
Interferometric Synthetic Aperture Radar (IFSAR) provides a satellite-based means of mapping surface deformation with excellent spatial resolution. Data acquired by the COnstellation of small Satellites for the Mediterranean basin Observation (COSMO)–SkyMed system demonstrate a change in the pattern of deformation at Mauna Loa in mid-2015. The deformation pattern that was present starting in mid-2014 resembled that seen during previous periods of unrest and indicated magma accumulation in an elongated reservoir beneath the volcano’s summit caldera and upper Southwest Rift Zone (SWRZ). Since late 2015, however, IFSAR data show that inflation is occurring only beneath the upper SWRZ—an observation confirmed by numerous ground-based Global Positioning System (GPS) sensors located on the volcano. IFSAR, GPS, seismicity, and other indicators are closely tracking changes at the volcano and will provide warning of any future eruptive activity.

Interferograms from COSMO–SkyMed synthetic aperture radar data showing surface deformation spanning October 25, 2014 – June 22, 2015 (left) and June 22, 2015 – May 23, 2016 (right). The butterfly pattern of fringes reflects magma accumulation in an elongated reservoir that runs along the length of the caldera at a depth of about 3–5 km beneath the surface. The deformation pattern is shifted to the south in the more recent image with respect to the older one, reflecting a change in the pattern of magma accumulation over time. These data were supplied as part of the global Group on Earth Observations Supersite initiative and would not otherwise have been available.

