Airborne Visible/Infrared Imaging Spectrometer (AVIRIS) data collected over the BP oil spill in the Gulf of Mexico (GOM) during May and July 2010 were used to create quantitative maps of oil spill thickness, oil-to-water ratio, areal coverage, and volume. Due to the immense size of the spill, AVIRIS could only cover a portion of the spill on any given day. Two days on which AVIRIS data were collected had favorable sea surface conditions (i.e., low sun glint from waves) allowing an accurate determination of oil volume in thick emulsions. Approximately one-third of the core spill was imaged on May 17 with a much smaller portion imaged on July 9. The AVIRIS data, which span ultraviolet to near-infrared wavelengths in 224 contiguous spectral channels, were analyzed for indications of water-in-oil emulsions by comparing them to reference spectra using the USGS Tetracorder spectral matching algorithm. Reference spectra included the weathered crude oil from the Macondo well and 76 spectra of synthetic emulsions with varied oil:water ratios. Results showed the maximum depth of penetration is about 6 mm for emulsions up to 30 wt% water and decreased depth of penetration (2 to 4 mm) with greater wt% water contents. Ship-based observations during the oil spill suggest emulsions can be as thick as 20 mm; hence AVIRIS would only be probing at most the top 6 mm of those plumes.
AVIRIS data cubes collected over the spill were analyzed by least-squares spectral fitting to the 76 selected emulsion spectra and the weathered crude oil spectrum. Other reference spectra were also used in the spectral analysis to locate and mask non-water and non-emulsion pixels. These spectra included a Sargasso Weed spectrum measured in situ in the GOM to locate pixels dominated by vegetation as well as spectra of wood, plastic, and paint usually associated with the decks of ships and oil platforms. Tetracorder maps for each of the 76 synthetic emulsion spectra and the weathered crude oil spectrum were produced. The aerial extent was calculated using AVIRIS pixel sizes, which varied from 8 to 3 m on a side depending on aircraft altitude. The volume of oil was then calculated using the areal fraction of emulsion that covered each pixel along with the spectrally determined oil:water ratio and emulsion thickness.

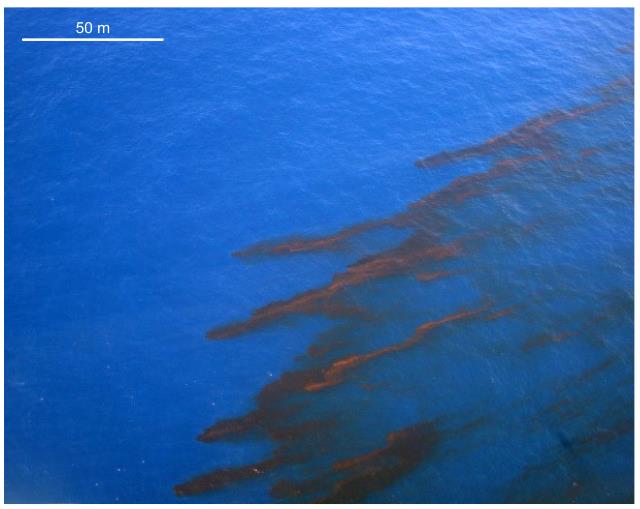
Crude oil upwelling from the leaking Macondo well in July 2010. Elongated brown emulsion plumes form as wind and currents carry oil from upwelling centers.

