The Landsat series of satellites provide remotely sensed data suitable for mapping wildfire disturbance. However, the sensors on board the current and historical Landsat satellites vary in terms of the spatial resolution, number of spectral bands, bandwidths, and overall data quality and calibration characteristics. To date, the USGS and others have used Landsat data collected from the Landsat Thematic Mapper (TM), Enhanced Thematic Mapper Plus (ETM+), and Operational Land Imager (OLI) era (1984–present) to map wildfire disturbance. Historical fire mapping efforts, however, have essentially ignored the era from the launch of Landsat 1 through Landsat 4 (1972–1983). The data collected during this period by Landsat’s Multispectral Scanner (MSS) sensors are suitable for fire mapping but possess different spatial resolution and spectral band characteristics than data collected by TM, ETM+, and OLI. In order to provide a longer time series of fire occurrence and burn severity for the assessment of climate change impacts on burn severity trends, it is necessary to develop a burn severity characterization method that calibrates indices derived from Landsat MSS and TM/ETM+/OLI data.
Both the MSS and TM/ETM+/OLI results must be adjusted to a common spectral and spatial scale to facilitate the comparison of continuous burn severity indices through the full Landsat era. Methodologies have been identified that are suitable to detect, map, and monitor fire disturbances in the 1972–1983 time period using Landsat 1–4 MSS data and then calibrate both MSS results and similar results derived from TM/ETM+/OLI fire data records for 1984–present. Automated scripts have been written to efficiently calibrate multiple fire mapping datasets across large landscapes. Historical MSS, TM, ETM+, and OLI burn mapping datasets have been acquired or derived for study areas in the Mojave bioregion, selected watersheds in Colorado, and other locations across the country. These Landsat image datasets will be used to test and validate the calibration techniques and automated processing algorithms. Perhaps of more critical importance, however, the effort will demonstrate the science value of historical wildland fire disturbance mapping and monitoring for the full Landsat era from 1972 to the present.

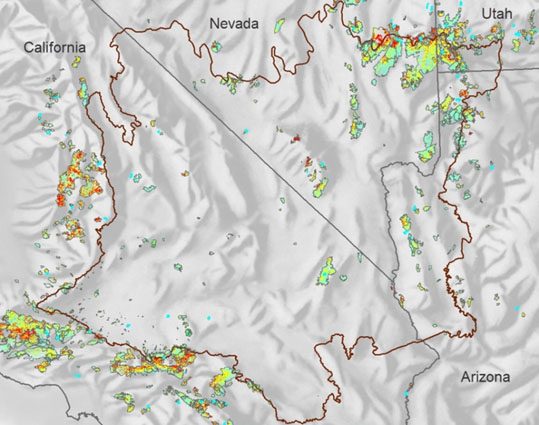
Categorical burn severity for the Mojave bioregion for 1972–2008. Landsat Multispectral Scanner data were used to generate the 1972–1983 fire location and burn severity information. Within the severity map, dark green is non-burn, light blue is low severity, yellow is moderate severity, and red is high severity. The brown line is the Mojave bioregion boundary.

