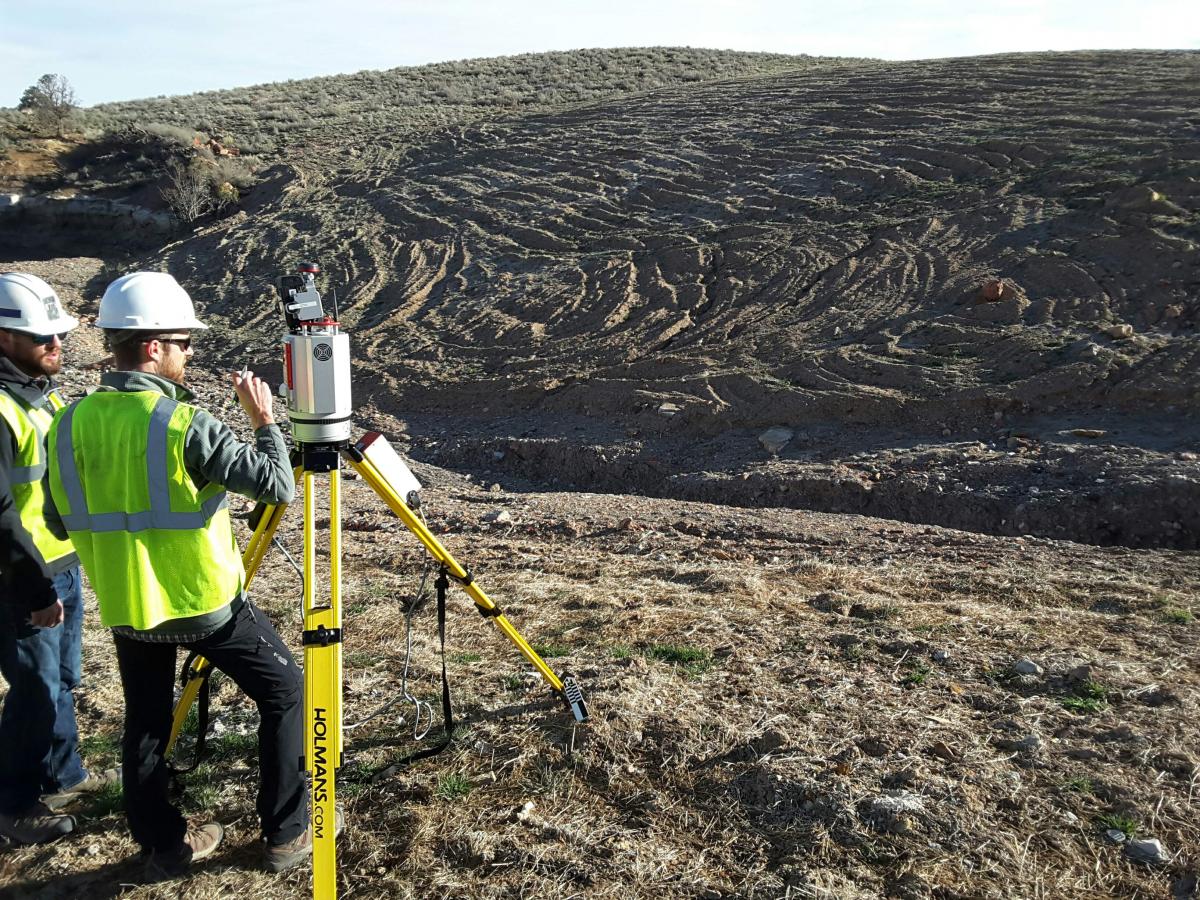
OSMRE is using a RIEGL terrestrial lidar scanner to collect highly detailed elevation data for documenting restoration activities on the landscape. The RIEGL unit is mounted onto a tripod and emits several laser pulses per second and records when each of the pulses returns to the scanner. A Digital Single-Lens Reflex (DSLR) camera is mounted on top of the scanner; after each scan, the camera obtains photos of the area scanned. The scanner data and photos are combined into a lidar dataset that allows users to create realistic-looking three-dimensional (3D) models with better than 1-ft resolution.
During the week of March 27, 2017, OSMRE researchers acquired lidar data at the Kayenta Mine operated by Peabody Western Coal Company in the Navajo Nation in Arizona. Portions of the area scanned have already undergone reclamation, and other sections will be reclaimed in the near future. From the lidar data, analysts can accurately measure lengths, areas, and calculate volumes, identify different vegetation types, determine vegetation biomass, and look at the bare earth. At a later time when additional reclamation has been completed, the site can be revisited to collect new data. Datasets from different time periods can be compared to easily identify where changes have occurred and calculate the volume of earth that has been added or removed from any given area.
The Kayenta Mine was the first mine site where the Geospatial Information Services (GIS) Branch team in the Western Region collected its own lidar data. The team has since collected data at other sites and is working with other regional OSMRE offices and State partners planning additional collection efforts to support active and abandoned mine projects. The RIEGL terrestrial lidar scanner allows collection of detailed and accurate data in a timely manner to meet agency-specific missions and is suited to monitoring reclamation activities.

Setting up the scanner in preparation for collecting data.

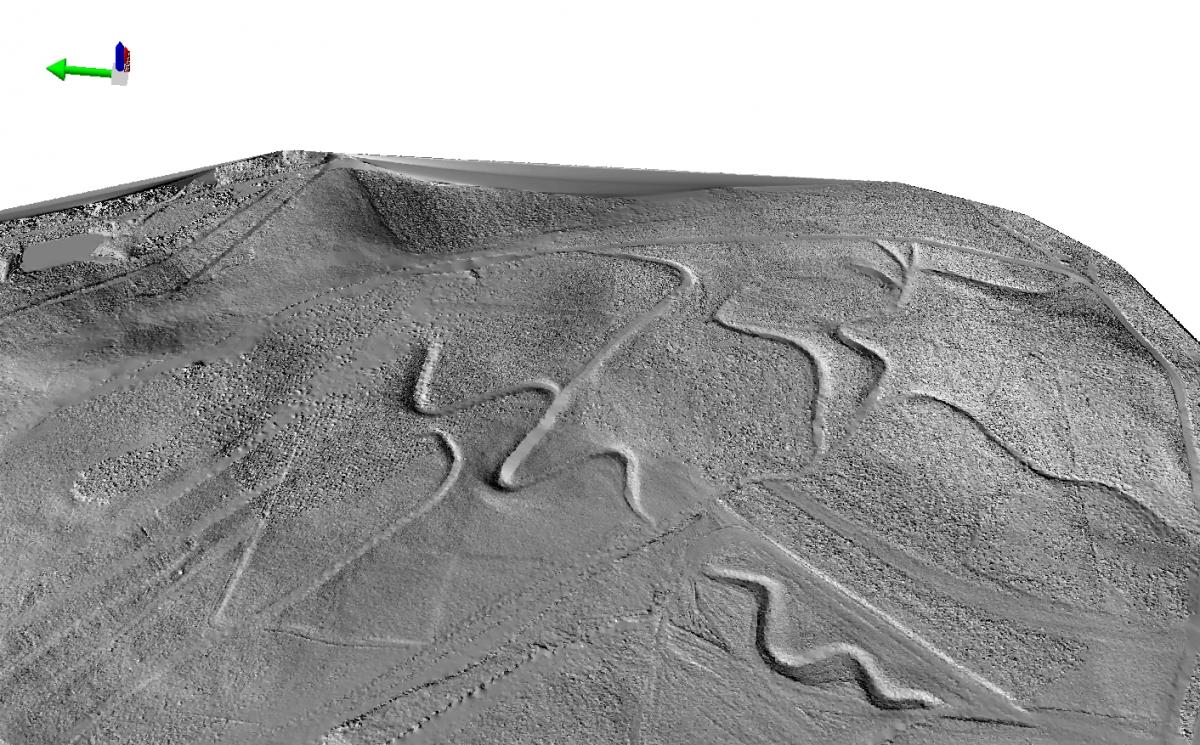
This figure illustrates a hillshade at a 1:10,000 scale derived from the lidar data. Features of interest such as drainage channels (sinuous features in the figure) are easy to identify and visualize in the hillshade.

