An algorithm for the automated analysis of multispectral remote sensing data acquired by the Landsat 8 Operational Land Imager (OLI) sensor has been developed that can efficiently identify surface occurrences of iron sulfate minerals. The algorithm combines thresholded band ratio results into displayed iron sulfate minerals, other minerals and vegetation groups using Boolean algebra. New analysis logic has been implemented to exploit the coastal aerosol band in Landsat 8 OLI data and identify concentrations of iron sulfate minerals that may indicate the presence of near-surface pyrite that can be a potential non-point source of acid rock drainage. Zoned occurrences of iron sulfate minerals mapped using this technique surrounding and downgradient of known sources of pyrite show high correlation with occurrences of iron-rich jarosite-bearing mineral assemblages mapped using airborne imaging spectrometer data and supporting field verification surveys. Mapping the occurrence of iron sulfate minerals (after pyrite) in exposed hydrothermally altered rocks can provide an important indicator of the genetic environment of the alteration and associated mineral deposit type, particularly for advanced argillic alteration. Highly pyritic exposures of quartz-sericite-pyrite (QSP, or phyllic) alteration can be readily identified and differentiated from argillically altered rocks that are low in pyrite. The automated analysis methodology will be published in a USGS Scientific Investigations Report and is being employed to rapidly and cost-effectively generate maps of large regions of the United States in support of USGS mineral resource and mineral-environmental assessments.
The maps generated from analysis of Landsat 8 data are most effective when used in conjunction with mineral maps derived from Advanced Spaceborne Thermal Emission and Reflection (ASTER) data analysis in which diagnostic minerals associated with several types of hydrothermal alteration can be identified. ASTER-derived maps of surface minerals and green vegetation covering the western U.S. were published recently in a USGS data release: https://doi.org/10.5066/F7CR5RK7
https://www.fort.usgs.gov/landsat-study

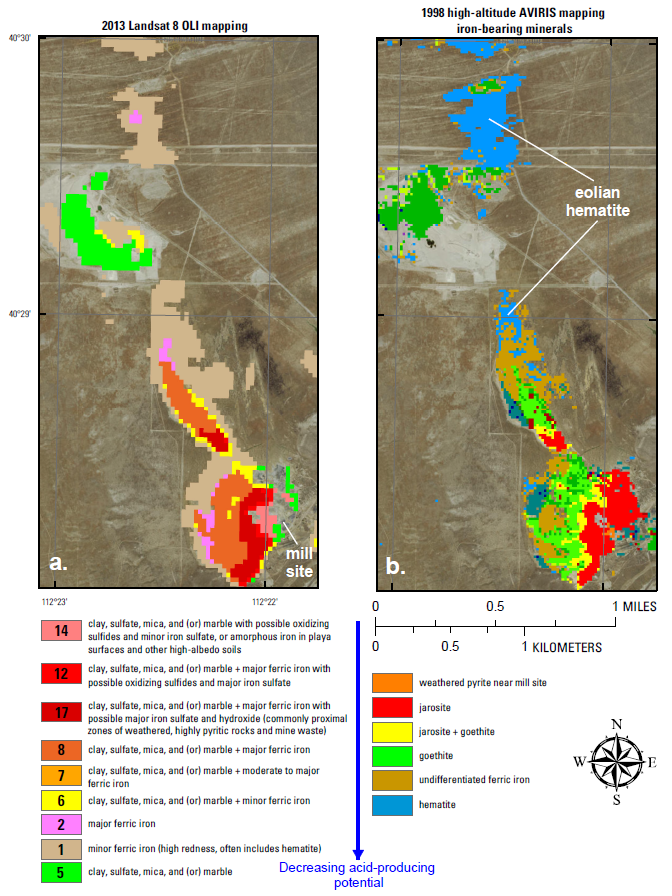
Mineral maps of the Bauer Mill site near Stockton, Utah, derived from analysis of a) Landsat 8 OLI data and b) high-altitude Airborne Visible/Infrared Imaging Spectrometer (AVIRIS) data. Between 1900 and 1957, the Bauer Mill processed sulfide-rich ores derived from the polymetallic vein and replacement deposits of the Stockton mining district in the western Oquirrh Mountains. The mineralogy of the tailings shows marked changes with increased distance from the mill; grading from weathered pyrite detected near the mill to zones of jarosite, jarosite + goethite, goethite, and hematite in distal eolian deposits north of the tailings by the prevailing southerly winds. Landsat 8 data have a 30-m ground resolution and were acquired on June 9, 2013; the AVIRIS data were acquired on August 5, 1998, and have a 17-m resolution. The location of the mill site from which the tailings emanated is shown. Similar patterns of mineralogic variation relative to the mill site are evident in both maps.

