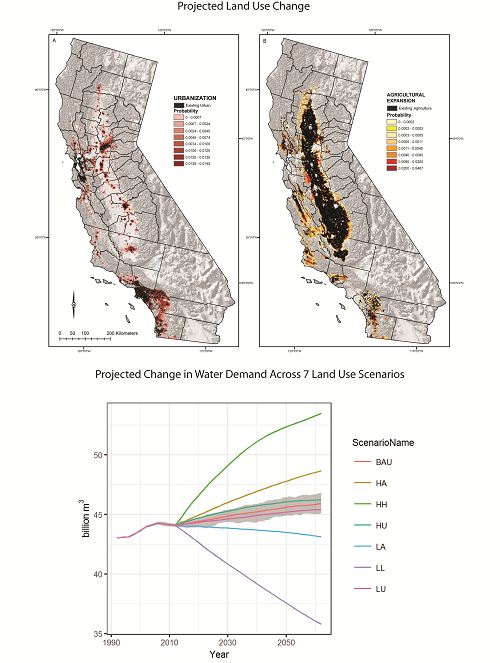
California’s water use future is fraught with uncertainty, given growing demand and highly variable interannual water supplies. A broad suite of spatially explicit future land use scenarios and their associated county-level water use demand projected out to 2062 will be modeled using a state-and-transition simulation modeling approach. Scenarios have been developed by sampling from a 20-year record of historical (1992–2012) aerial photography data to generate low/high change scenarios for urbanization and agriculture as well as “lowest of the low” and “highest of the high” anthropogenic use. Current results indicate the greatest increased water demand in the highest of the high land use scenario at 9.4 billion cubic meters (Bm3), high agricultural expansion (+4.6 Bm3), and high urbanization (+2.1 Bm3) scenarios. Decreased water demand was projected in the lowest of the low (- 8.3 Bm3) in the lowest of the low scenario and decreased 0.8 Bm3 in the low agriculture scenario. Results show agricultural land use decisions will likely drive future water demand more than increasing municipal and industrial uses, yet improved efficiencies across all sectors could lead to potential water use savings. Results provide water managers with information on diverging land use and water use futures, based on historical, observed land change trends and water use histories.

Top panels: Mapped land use projections (expressed as probabilities of conversion) for Mediterranean California for expansion of urban (left) and agricultural (right) areas modeled for 2012–2062 using 40 Monte Carlo iterations for each of the following land use scenarios: 1) Business-as-usual (BAU), 2) High Agriculture (HA), 3) Highest of the High (HH), 4) High Urban (HU), 5) Low Agriculture (LA), 6) Lowest of the Low (LL), and 7) Low Urban (LU). Mapped values represent a cumulative transition probability across all scenarios. Bottom panel: Projected change in land use related water demand expressed in billion cubic meters (Bm3) for each scenario, with variability across the 40 Monte Carlo simulations shown in gray for the BAU scenario.

