Cyanobacterial blooms in eutrophic inland waters are a worldwide concern. Simple and fast detection methods would greatly aid water managers in issuing proper warnings for harmful algae. Blooms are exacerbated by high nutrient inputs and warmer waters, and have been appearing with increasing frequency in water bodies used for drinking water supply or recreation, a problem which will likely worsen as the climate warms. Cyanobacterial blooms are a nuisance for their unsightly surface scums and the production of taste-and-odor compounds, and some strains of cyanobacteria produce toxins that are hazardous to human and animal health. Remote sensing has been used to detect cyanobacterial blooms, but few studies have distinguished between genera of cyanobacteria. Because some genera are more likely to be toxic than others, this is a useful distinction. In this study, hyperspectral imaging reflectance microscopy was used to examine cyanobacteria from Upper Klamath Lake, Oregon, at high spatial and spectral resolution to determine if two genera found commonly in the lake, Aphanizomenon flos-aquae and Microcystis sp., can be separated spectrally. Of the analytical methods applied, a spectral shape algorithm applied to the derivative was found to be most successful in classifying genera in microscope scenes.
https://egsc.usgs.gov/PDS_HSImicro.html

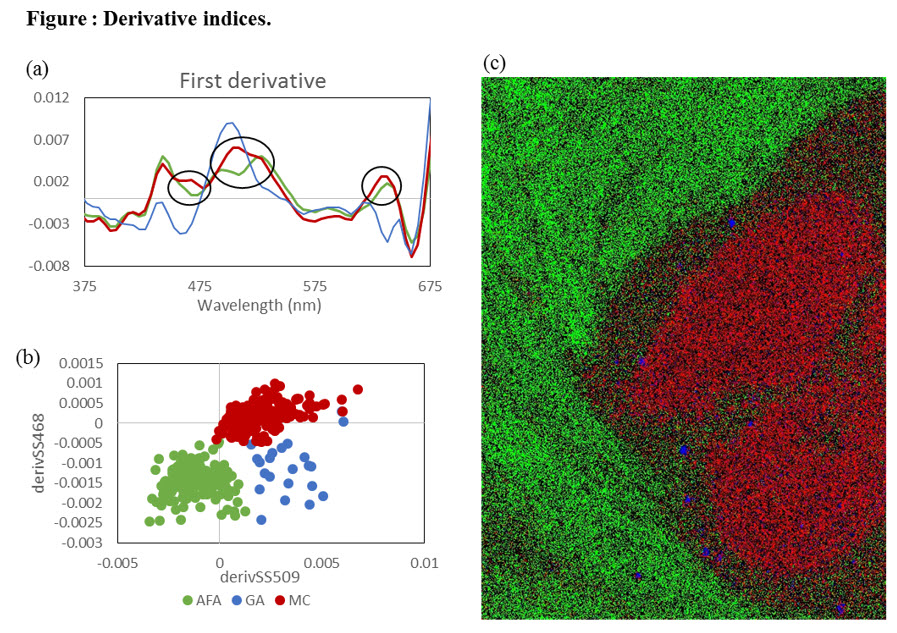
Two indices were developed to quantify the shape of the spectral derivative at 468 nm and 509 nm, the locations circled in (a). When applied to a dataset of over 200 spectra, these indices showed good separation between Aphanizomenon, Microcystis, and green algae (b). An image classified according to these indices and a third index derived from the second derivative at 628 nm is shown in (c).

