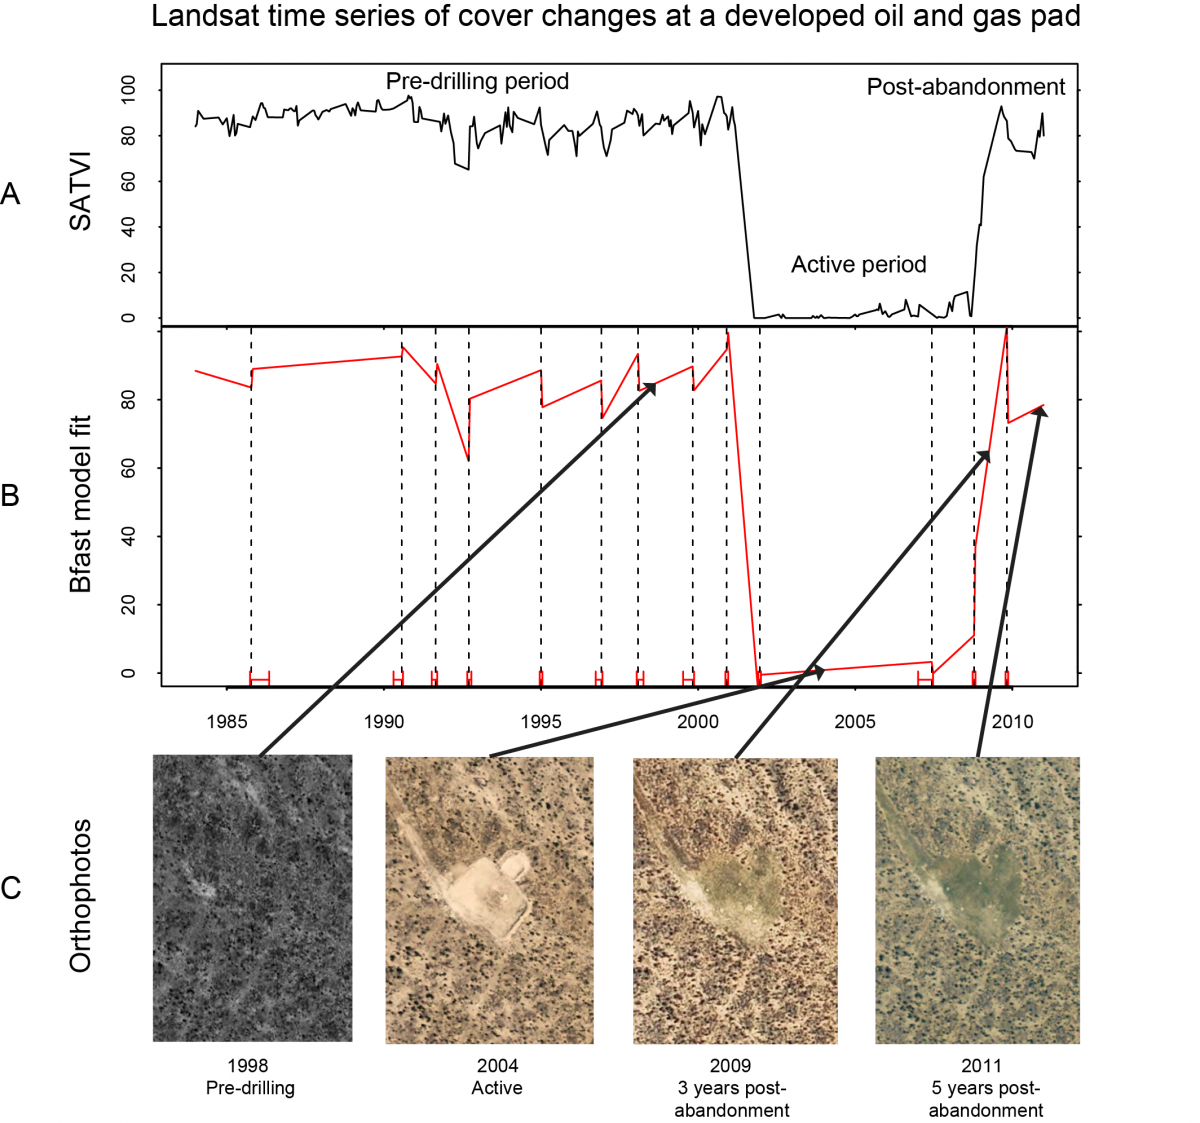
Energy development in the western U.S. has increased substantially in recent decades, contributing to habitat fragmentation, dust emissions, and soil loss from erosion. Oil and gas well pads are often developed and then abandoned when they are no longer sufficiently productive. However, the rate and degree of recovery of these abandoned sites to a relatively natural state remains unclear. The Soil-Adjusted Total Vegetation Index (SATVI), calculated using the red and shortwave infrared (SWIR) bands from Landsat, provides consistent estimates of total vegetation cover in drylands, and was used to assess pad changes over time. USGS scientists used the Google Earth Engine cloud computing platform to develop dense time series (1984-2011) of Landsat data for 510 abandoned well pads as well as nearby control areas of similar environmental conditions, which helped to standardize the assessment. The statistical package BFAST in R was used to identify breaks in the time series related to initial site disturbance and active pad use, and to quantify the magnitude, duration, and rate of vegetation change after abandonment. USGS scientists also analyzed change rates relative to climate and other spatial variables and found vegetation increases are most strongly related to wet and cool conditions of winter-spring months during the year of abandonment. However, high-resolution aerial imagery and Landsat-based phenology indices indicate that many abandoned pads where vegetation increased over time are dominated by exotic grasses and annual plants.

Graph showing A) Landsat time series of the Soil-Adjusted Total Vegetation Index (SATVI) from 1984-2011. Phases include pre-drilling from 1984-2002, active from 2002-2006, and post-abandonment 2006-2011, B) Bfast model of trends used to estimate breaks in the time series, and C) orhtophotos showing the site during different points in time and where those dates fall on the Landsat time series. The rapid cover change from 2006-2009 and the appearance of dense green ground cover that contrasts with surrounding native vegetation suggests the cover at this site consists of exotic grasses and annual plants.

