Substantial loss of coastal wetland caused by the Deepwater Horizon (DWH) oil spill was documented for the first time in recent publications (http://onlinelibrary.wiley.com/doi/10.1002/2016GL070624/full). Those results demonstrated that the 2010 DWH oiling exacerbated wetland shoreline erosion, that erosion magnitude increased with oiling severity, and that oil-related erosion differed from storm-related shoreline erosion. The erosion mapping was done using an in-house designed operational mapping system that used Synthetic Aperture Radar (SAR) data within a remote sensing and GIS-processing structure (https://doi.org/10.14358/PERS.83.3.237). That system delivered a holistic representation of spatial and temporal trends of shoreline lateral movement that were not obtainable from ground measurements. Extending these studies beyond the limited spatial and temporal demonstration period would allow a more comprehensive accountability of oil degradation and loss of coastal wetland and to better understand the long-term damage and recovery from severe storms and anthropogenic modifications.
http://onlinelibrary.wiley.com/doi/10.1002/2016GL070624/full

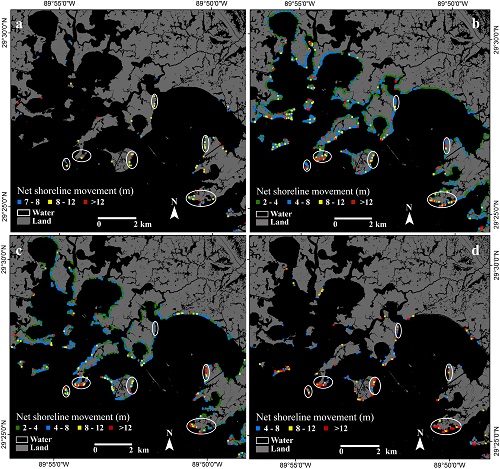
Northeastern Barataria Bay, Louisiana, shoreline recession, June 2009–October 2012. Shoreline recession during (a) June 2009 to June 2010, prior to shore oiling from the Deepwater Horizon spill; (b) June 2010 to June 2011, Year 1 post-spill; (c) June 2011 to July 2012, Year 2 post-spill; and (d) July 2012 to Oct 2012, a three-month period during which Hurricane Isaac made landfall in the vicinity. The white ovals mark areas that show loss both in 2009–2010, i.e., before the oiling, and high loss from Hurricane Isaac in fall 2012.
![Shoreline impact. (a) The length of shoreline experiencing erosion by magnitude category per time period [2009–2010 = pre-spill; 2010–2011 and 2011–2012 = post-spill; July 2012–Oct 2012 = hurricane]. Note the increase in the post-spill erosion and similarity of the pre-spill and post-storm periods. (b) Post-spill periods [2010–2011, 2011–2012 pre-storm] documenting higher shoreline erosion with higher oiling severity, and increased erosion of lightly oiled shorelines in the second post-spill year. Shoreline impact. (a) The length of shoreline experiencing erosion by magnitude category per time period [2009–2010 = pre-spill; 2010–2011 and 2011–2012 = post-spill; July 2012–Oct 2012 = hurricane]. Note the increase in the post-spill erosion and similarity of the pre-spill and post-storm periods. (b) Post-spill periods [2010–2011, 2011–2012 pre-storm] documenting higher shoreline erosion with higher oiling severity, and increased erosion of lightly oiled shorelines in the second post-spill year.](/doi-remote-sensing-activities/sites/default/files/public/USGS/Figure2_ShorelineLoss-NEW.jpg)
Shoreline impact. (a) The length of shoreline experiencing erosion by magnitude category per time period [2009–2010 = pre-spill; 2010–2011 and 2011–2012 = post-spill; July 2012–Oct 2012 = hurricane]. Note the increase in the post-spill erosion and similarity of the pre-spill and post-storm periods. (b) Post-spill periods [2010–2011, 2011–2012 pre-storm] documenting higher shoreline erosion with higher oiling severity, and increased erosion of lightly oiled shorelines in the second post-spill year.

