
The rich archive of Landsat imagery combined with the Operational Simplified Surface Energy Balance (SSEBop) model can be used to estimate and map actual evapotranspiration (ET) across large basins to quantify long-term crop consumptive use. Historical water use for the Upper Rio Grande Basin was calculated from Landsat imagery from 1986 to 2015 and summarized water use from irrigated fields to characterize water-use dynamics. This study demonstrated the consistency and usefulness of historical data from Landsat 5, 7, and 8 and the robustness of the SSEBop ET model for understanding the spatiotemporal dynamics of water use in a large, complex basin.
This study included independent validation of SSEBop actual ET (ETa) where monthly ET was evaluated using six eddy-covariance (EC) flux towers showing strong correspondence with reasonable error rates for multiple sites of varying land cover types. This point-scale validation evaluated monthly ET from 2007–2014 for highland forested sites as well as shrubland and wildland sites. Basin-scale validation of ET estimates was also evaluated from 1986 through 2011 using Max Planck Institute monthly ET estimates with strong correlation found with this independent dataset. These independent evaluations demonstrate the reliability of SSEBop ETa, derived from Landsat imagery, for conducting a spatiotemporal characterization of ETa in diverse agro-climatic settings. A Mann-Kendall trend analysis demonstrated a statistically significant negative trend for SSEBop ET for the Upper Rio Grande Basin as well as in irrigated fields within the New Mexico and Texas sections of the basin.
The approach used in this study is scalable to any basin or region in the world using Landsat and a consistent method such as SSEBop. Irrigation managers and water resource stake holders can utilize these cost-efficient methods for more efficient management of scarce water resources.
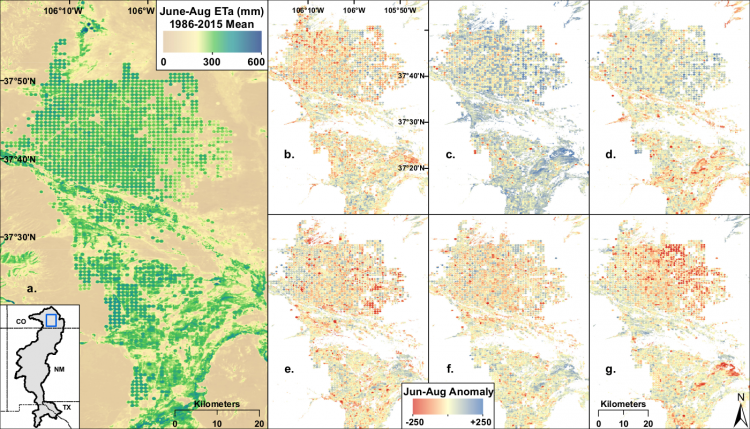
Colorado June–August ETa showing (a) 1986–2015 mean ETa (mm), and the annual anomaly (deviation from the mean, mm) on a 5-year interval for (b) 1990, (c) 1995, (d) 2000, (e) 2005, (f) 2010, and (g) 2015.