
Exotic annual species are of concern in much of the Western U.S. because they have flexible responses to resource availability, high reproductive capacity, and propagules that are readily dispersed, particularly in disturbed areas like those created and maintained for energy development. Once established, exotic annuals like red brome (Bromus rubens) and cheatgrass (Bromus tectorum) can rapidly alter community composition and increase wildfire risk. Red brome and cheatgrass green up earlier than native vegetation, producing a distinct “pulse” of greenness in the early spring. This pulse can be exploited to identify the location of these annuals by using the difference between a spring satellite image with peak cheatgrass greenness and an early summer image where cheatgrass is senescent. Using these approaches, researchers are developing annual Landsat time series to analyze trends and patterns of early season invasive grasses around disturbed wind turbine sites as well as mapping invasive trends across the entire Mojave Desert of southern California.
The team used a cloud-based approach to analyze Landsat imagery from 1985–2018 and develop estimates of invasive grasses surrounding 1,755 wind turbines installed between 1988 and 2013. An annual invasives index was developed that uses the contrast in early season and late season Normalized Difference Vegetation Index (NDVI) to estimate the relative amounts of invasive annuals each year at turbine and control sites. The maximum greenness, as indicated by NDVI, was used for the early season (January through June), and median greenness for the later dry season (July through October).
The results showed an increase in early season invasives after turbines were installed, but also a similar increase over time in some surrounding control areas. Maps of the invasive index show a region-wide increase during the study period. Much of the regional increase occurs near the wind development sites, but the extent to which the disturbance caused by energy development contributed to the spread of invasives across the greater landscape is unknown considering the possible role of confounding land use and climatic factors on invasive spread.
Advances in cloud computing allow rapid calculation of dense time series of NDVI and other spectral indices. These methods show promise for helping land managers identify and map other annuals and exotic weeds that have a less predictable phenological signal but respond to individual precipitation events or summer precipitation.
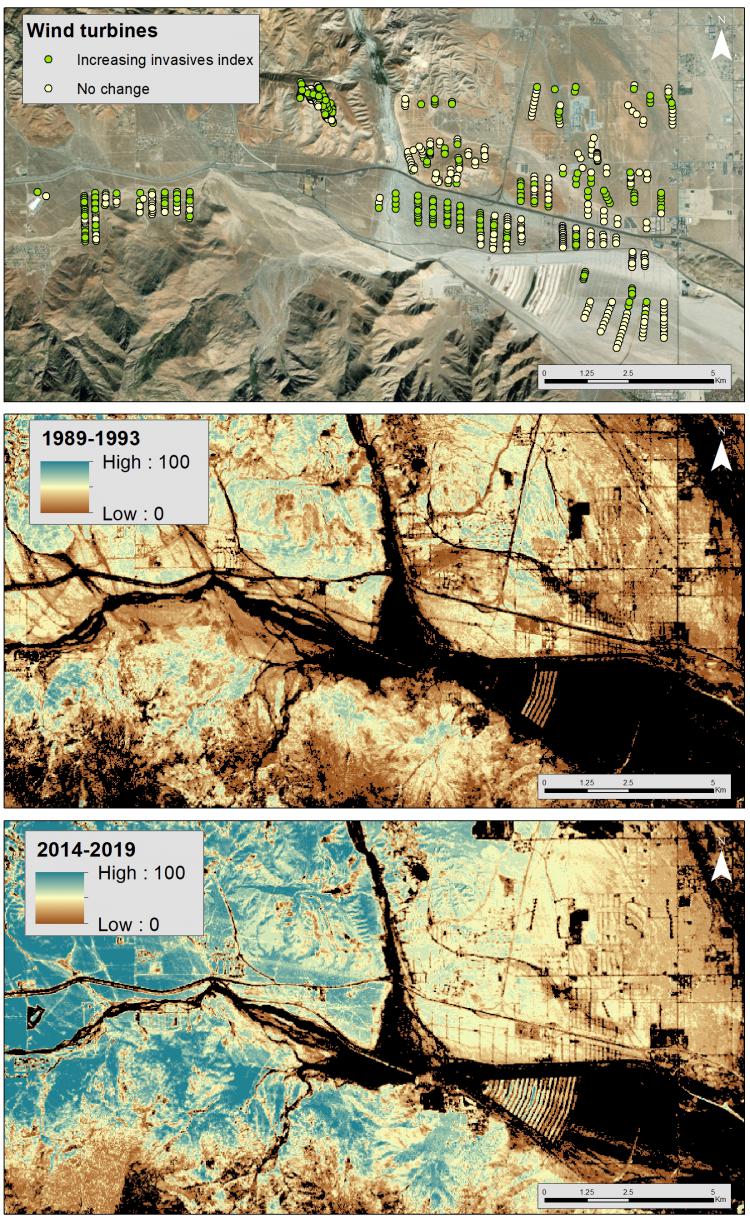
Difference in Early Season Invasives index values before and after turbine construction compared to surrounding control areas (top). Green indicates turbines with higher index values in the period after construction, and yellow indicates no change or lower invasive index values after construction. 5-year average Early Season Invasives index values for 1989–1993 (middle) and 2014–2018 (bottom) illustrating trends across the larger landscape. Green values indicate persistent yearly high NDVI values over each period (greater than 0.2).