
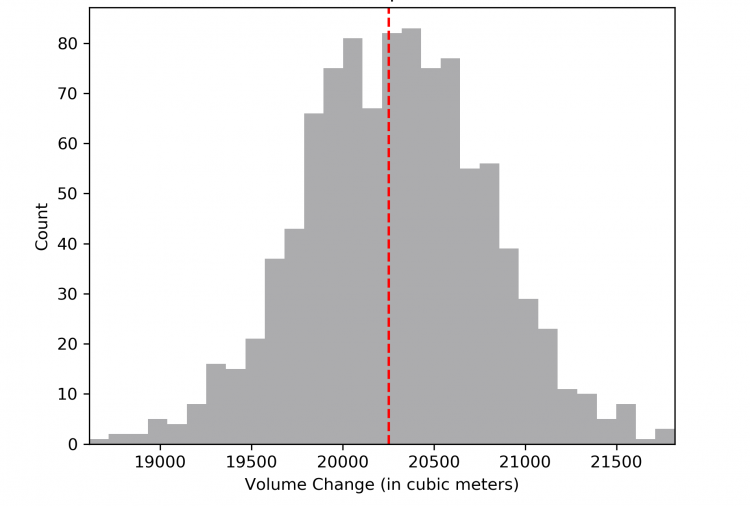
The BLM’s National Operations Center (NOC) frequently assists field offices with production verification at mine sites across the West, but these analyses are often limited by a lack of historical data. To address this problem, stereo imagery from a variety of sources and dates was combined with current light detection and ranging (lidar)-derived elevation data to better document surface change and material extraction over time at a gravel mine near Salida, Colorado. Aerial imagery was collected from 1978 (from the BLM’s aerial film archive) and 2009 (NAIP source imagery), while high-resolution stereo imagery was captured with an unmanned aircraft system (UAS) in June 2019. The NOC applied a rigorous photogrammetric workflow on the imagery from 1978, 2009, and 2019 using “control” points identified in a 2011 lidar collection of the same area. These “control” points were unchanged features across the landscape that were clearly visible in both the imagery and lidar datasets. While direct comparison of the surfaces using a cut-fill analysis provided a spatially explicit map of material added and removed, the NOC developed a Monte Carlo simulation to additionally provide an estimate of uncertainty. The simulation used the horizontal and vertical root mean square error (RMSE) values observed at “control” points to generate random values from a normal distribution, centered at zero with the RMSE values as the standard deviation. These XYZ values generated for each timepoint were used to shift the surfaces in three-dimensional space before performing a cut-fill calculation. This process was repeated 1,000 times for each location evaluated, generating a distribution of net volume change to communicate the uncertainty around each cut-fill calculation. As expected, simulated volume change distributions from locations where the source data displayed greater error, as well as locations with steeper slopes, were considerably broader. Taken together, the use of a variety of elevation sources provides a clearer picture of surface change over time, while the addition of the simulation adds a measure of uncertainty to inform decision making.
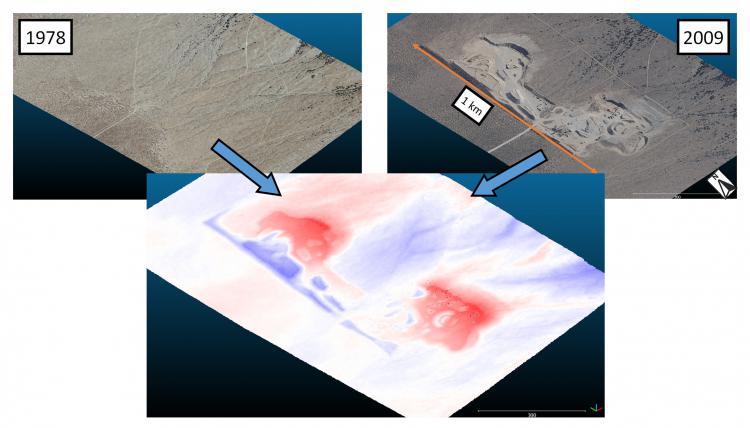
Visualization of surface change of a gravel mine near Salida, Colorado over the course of three decades from 1978 to 2009, with red representing where the surface has become lower and blue representing where material has accumulated. Historical images are from the BLM’s aerial film archive (1978) and the USDA National Agriculture Imagery Program (NAIP, 2009).
Visualization of surface change of a gravel mine near Salida, Colorado over the course of three decades from 1978 to 2009, with red representing where the surface has become lower and blue representing where material has accumulated. Historical images are from the BLM’s aerial film archive (1978) and the USDA National Agriculture Imagery Program (NAIP, 2009).