
Nearly two years ago, the USGS project Patterns in the Landscape–Analyses of Cause and Effect (PLACE) adapted the USGS Dynamic Surface Water Extent (DSWE) model to generate monthly maps across the Landsat archive on the Google Earth Engine (GEE) cloud computing platform. Published works investigating time series of DSWE maps for the Central Valley of California and the country of Cambodia demonstrated the transferability and scalability of the GEE approach. However, the maps also quantified how cloud obstruction poses a major hindrance to creating a complete surface water record capable of identifying spatially explicit flood events. PLACE is currently undertaking a new effort based on the hypothesis that improved temporal resolution can overcome cloud obstruction and result in a more comprehensive record of past floods. To accomplish this goal, USGS researchers have adapted the DSWE model to generate maps across the 2003–2019 Moderate Resolution Imaging Spectroradiometer (MODIS) archive within the GEE. Monthly maps generate a maximum water composite from 30 days of imagery, which results in maps with minimal cloud obstruction and a complete monthly time series spanning 204 months. Composites are also generated in 15-, 10-, and 5-day increments (408, 612, and 1,224 maps, respectively). Although cloud cover increases as fewer images are considered, preliminary results for California suggest that more than 75% of the 5-day time series have less than 10% cloud obstruction. PLACE is actively applying the MODIS DSWE time series to generate long-term surface water trends in the conterminous United States (see Petrakis submission “21st Century Surface Water Trends for the United States” to investigate the general role of precipitation as a cause of surface water change, and to develop methods for extracting past floods from the surface water record). Establishing stronger links between precipitation events, stream gage measurements, and mapped flood extents will help create better hazard assessments and flood warning protocols.
https://www.usgs.gov/centers/wgsc/science/patterns-landscape-analyses-cause-and-effect
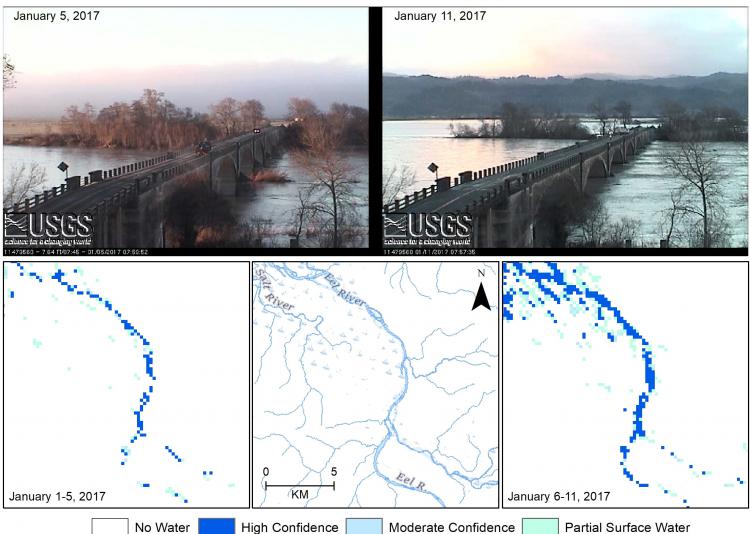
USGS camera footage of the Eel River in northern California shows pre-flood and flood conditions in January 2017. Surface water inundation maps generated using MODIS imagery illustrate the spatial extent of the same flood event.