
How bad can these drought conditions get? How much hay should I buy? How many animals should I sell or relocate to another area with a forage surplus? Land managers face these questions during a drought. Livestock operations are often restricted to dry areas with unreliable rainfall, which are generally less suitable for farming. Dealing with severe droughts can be devastating for the economies of families and rural communities. Maps developed by this USGS team help land managers obtain a broader spatial perspective and quantify the magnitude of drought in terms of livestock feed (forage). The information allows land managers to customize unique, creative, and informed drought strategies. Forage anomaly maps (units of kilograms per hectare of forage deviation from long-term expected forage) inform and help quantify various drought response options and highlight the spatial extent of drought impacts on forage production. A case study in the Nebraska Sandhills demonstrated this mapping capability; it focused on removing interannual vegetation dynamics associated with management and disturbance while better isolating the vegetation dynamics more directly attributable to site conditions (soils and long-term site potential) and weather. The time series of forage production maps (2000–2016) of isolated weather and site condition grassland production dynamics were produced using a machine learning mapping model, which was driven by weekly satellite vegetation index data, site potential, and weather. This data-driven mapping model was developed from many observations (pixels) of actual productivity (as proxied by the average vegetation index over a growing season) through time and space and accounted for 86% of the variation. Some of the remaining 14% variation was attributed to error in the mapping model (normal responding pixels), and some noise was associated with management and disturbances (outliers in the figure). Current efforts include 1) extending the mapping methodology to non-irrigated grasslands for the western conterminous U.S., 2) producing three scenarios of forage maps in the late spring that would capture summer forage production, and 3) investigating options for mapping forage at 30-meter resolution instead of the current 250-meter resolution.
https://doi.org/10.3390/rs11182106
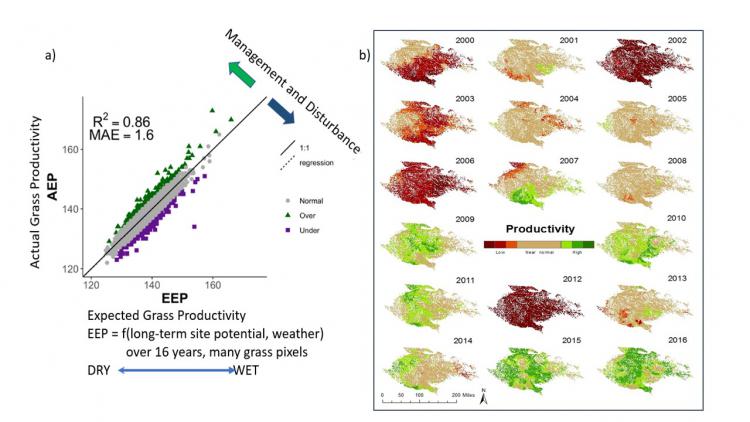
a) Forage productivity machine learning model accuracy and identification of outliers. b) Nebraska Sandhills forage production anomalies from the long-term median.