
The riparian reaches in the delta of the Colorado River in Mexico have undergone reductions in green vegetation from confounding pressures related to drought, precipitation declines, ground-water losses, land clearing, and fire. Hydrological and bioclimatic processes that lead to drought may stress plants and wildlife, restructure plant community type and architecture, increase monotypic stands and bare soils, facilitate the invasion of non-native plant species, and accelerate soil erosion. This study focuses on the impact of a paucity of Colorado River surface flows from the United States to Mexico in this dryland delta. The team measured change in riparian plant greenness and their water use over the past two decades using remotely sensed measurements of vegetation index (VI), a proxy for greenness, evapotranspiration (ET, millimeter/day), and a new metric based on annualized ET, the Phenology Assessment Metric (PAM). Long-term vegetative greenness and ET were measured along the riparian corridor (2000–2019) and its short-term (2014–2019) response to an environmental flow in 2014, as prescribed under Minute 319 of the 1944 Water Treaty between the two nations. The team used 250-meter Moderate Resolution Imaging Spectroradiometer (MODIS) and 30-meter Landsat satellite imagery time series to evaluate three vegetation indices: Normalized Difference VI (NDVI) and a scaled version (NDVI*); enhanced VI (EVI); and 2-band EVI (EVI2). EVI and EVI2 were selected to parameterize an optical-based ET algorithm and test the relationship between ET from Landsat and MODIS by regression approaches. There was a strong nonlinear correlation between EVI from Landsat and EVI from MODIS, indicating that both sensors are measuring nearly the same landscape metrics. Analyses show major decreases in VIs and ET as measured by Landsat and MODIS for both the 20-year and post-pulse 5-year periods. Annual spatial change maps of NDVI, ET, and EVI were captured for approximately 23,000 hectares and 150 kilometer of riparian corridor along the river. Over the last 20 years, the VI signal decline was 34% (EVI from Landsat) and 30% (EVI from MODIS), while ET losses were 1.58 millimeter/day (38.36%) (ETLandsat-EVI) and 1.13 millimeter/day (27.33%) (ETMODIS-EVI). In a few reaches, greenness declined as much as 43% at both resolutions, with a corresponding ET loss of 1.95 millimeter/day (51%) since 2000. However, since 2014, declines in vegetation greenness over these past 5 years were lower, indicating that the Minute 319 pulse flow contributed enough water to slow the decline in greenness and ET. The findings from this study are important because this added in-stream water helped both native and non-native riparian species in terms of stand structure, extent, and greenness, but only for the very short term (1–2 years). The reduction of vegetation measured will continue without additional active restoration efforts. These findings are critically important as they quantify further decrease of biodiversity, wildlife habitat, and other key ecosystem services due to drought and other hydrological processes.
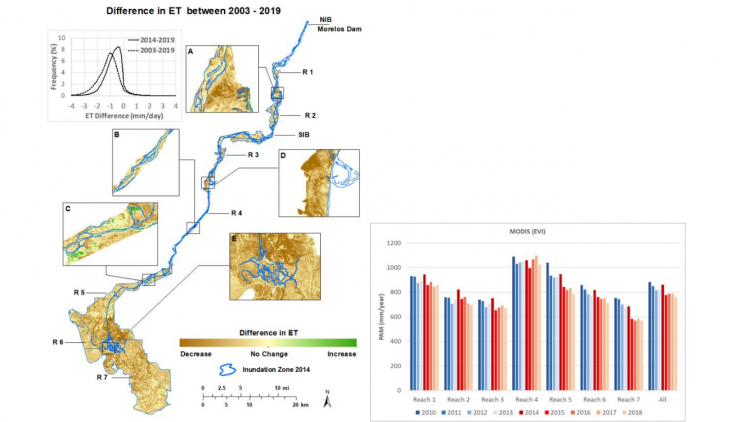
LEFT: Colorado River delta trend and anomaly “change” map showing differences in evapotranspiration (ET, millimeter/day) using ET Landsat-EVI for years 2003–2019 and a plot showing the frequency distribution of Landsat pixels 2019–2003 (dashed) and 2019–2014 (solid); brown on the change map and values less than zero on the histogram indicate a loss of vegetation and its water use. RIGHT: The bar graph shows Colorado River delta riparian corridor vegetation water use annual growing season ET (millimeter/day) as a Phenology Assessment Metric (PAM) with ET determined from MODIS using ETMODIS-EVI. PAM is shown as bars for years 2010 through 2018 for Reaches 1–7 (R1..R7) and the average of Reaches 1–7 (All) and colored as blues before the 2014 pulse flow (2010–2013) and reds for the 2014 pulse flow (dark red) and years following the pulse flow (2014–2018).