
Coastal erosion, exacerbated by sea-level rise, threatens both infrastructure and natural areas around the world. The King Range National Conservation Area (NCA) is vulnerable to such erosion effects because it extends along 35 miles of coastline in northern California. The BLM National Operations Center (NOC) used available 3D light detection and ranging (lidar) and photogrammetrically derived point clouds to document coastal change within the King Range NCA, including the retreat of coastal bench features. These low, flat, bench-like landforms contain extensive natural and recreation resources, and are a stark contrast to the otherwise steep and rugged landscape. The BLM Arcata Field Office specifically requested this work to help prioritize mitigation and response efforts by identifying hotspots of erosion and quantifying the rate of retreat of the coastal bench.
Publicly available lidar datasets from 2010, 2016, and 2018 provided full coverage of the coastal bench feature of interest. Additionally, the BLM contracted the Fish and Wildlife Service for an aerial lidar acquisition in 2020. The data were processed to produce a high-resolution 3D photogrammetric point cloud along the coastline of the King Range NCA. Using GIS software, the data were then gridded into digital elevation models (DEMs) and differenced from each other. This initial difference map provided a first pass look at erosion patterns across the study site. The areas with the highest rates of erosion coincided with 7 previously identified priority monitoring zones where the impacts of coastal erosion were expected to be greatest. Due to the large extent of the King Range NCA coastline, subsequent detailed analyses were focused on these monitoring zones.
Subsets of the 3D point clouds were extracted from the 2010, 2016, and 2020 data for each zone. Point cloud pairs (2010 to 2016 and 2016 to 2020) were co-registered and differenced from each other to produce highly detailed (~0.2-to-0.5-meter post spacing) and spatially continuous maps of change. Mean erosion rates ranged from ~6 to 30 centimeter per year, with maximum values in places as large as ~2 meter per year. Generally, erosion and retreat of the coastal bench increased towards the south, particularly at the Big Flat monitoring zone. This work represents the first attempt to characterize the rate of change for these features to inform resource management activities.
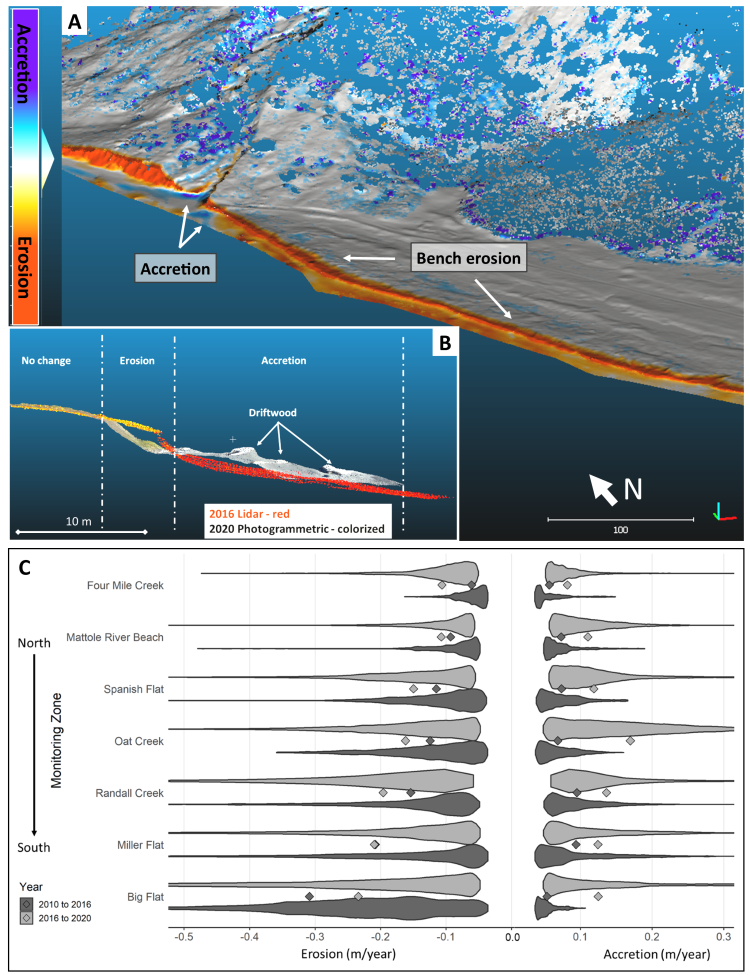
A) Spatially continuous map of change (cloud-to-cloud) from 2016 to 2020 at the Big Flat monitoring zone; view is at an oblique angle where north is toward the upper left corner. B) An example section profile of 2016 lidar (red) and 2020 photogrammetric cloud (colorized). This profile shows an area with no change above the coastal bench (left), retreat and erosion of this feature (middle), and driftwood on the beach below (right) impounding accreted sediments.