
Waterfowl populations within California's Central Valley are unusual among most North American waterfowl populations in that the region contains both resident and migratory populations of several species. The region supports 60% of the waterfowl and waterbirds that stopover for at least part of the year along the Pacific Flyway, a major north-south migratory pathway. The Central Valley also produces 8% of the entire Nation's crops and over half of California’s $50 billion agriculture cash receipts. Competing economic, municipal, and ecological demands for water are immense. Remaining natural wetlands are too few and remote to support the entire population of birds that inhabit the Central Valley each year, so California water policy plays an outsize role in affecting conditions for waterfowl and waterbirds that winter or breed within the State. Decisions about water use can influence the availability and quality of habitats that waterfowl and waterbirds require.
Agricultural patterns, particularly those involving rice, have supplanted the traditional role that wetlands played in this region. Water policy and economic drivers alter agricultural practices and change how agriculture supports the Pacific Flyway. Understanding these changes mays support habitat management to fill deficiencies and prevent population declines. Understanding what types of habitats are available to waterfowl and how habitat availability changes across the landscape produces important information about potential limitations affecting specific life history stages, disease transfer risk to agriculture (poultry) producers, and energetic supply available to meet conservation/population targets.
To address these needs, researchers at the Dixon Field Station of the USGS Western Ecological Research Center are developing a multi-platform and object-based habitat classification model using Sentinel-2, Landsat 7 ETM+, and Landsat 8 OLI imagery to achieve classification updates as frequently as every 3 days. Classification is conducted using the Google Earth Engine platform for analysis to allow portability and collaboration. The resulting maps provide data that can inform water management decisions in near real-time.
https://doi.org/10.3133/ofr20201102
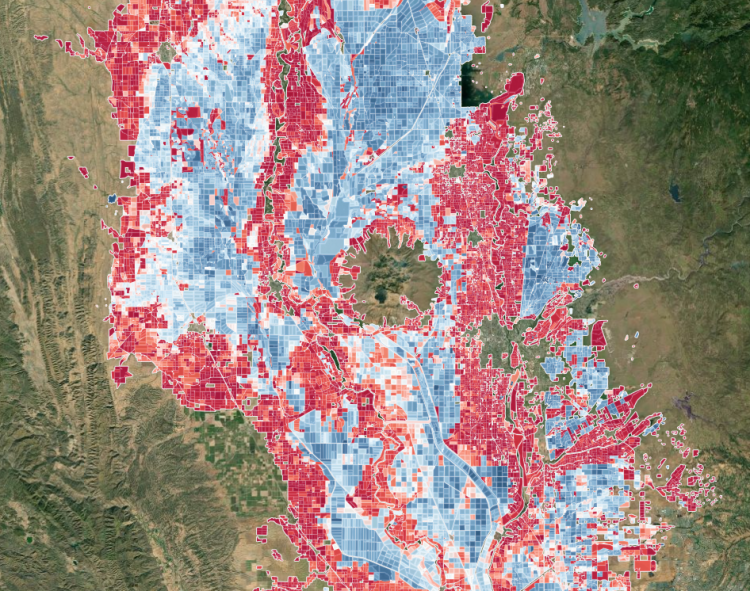
Flooded habitats are derived using satellite imagery (Landsat 7, Landsat 8, and Sentinel-2), spatially aggregated to homogenous hydrologic units (agricultural fields or wetland boundaries) and temporally aggregated using a temporal equivalent to a majority filter. Object-based classification and temporal filtering increases overall accuracy, which has reached 97.9% among field-validated datasets.