
Mapping irrigated agricultural lands to reveal their spatial and temporal dynamics can improve management of and policy concerning the world’s food supply. Researchers applied the latest version (Version 4) of the Moderate Resolution Imaging Spectroradiometer (MODIS) Irrigated Agricultural Dataset (MIrAD) to study change in irrigated croplands over the conterminous United States (CONUS) over a 15-year period at 5-year intervals (2002, 2007, 2012, 2017). The methods employed a geospatial modeling approach that utilized county-level data from the U.S. Department of Agriculture’s National Agricultural Statistics Service, agricultural land cover data from the USGS National Land Cover Database, and an annual peak vegetation index from expedited MODIS satellite data. The study uncovered a 7% overall increase in irrigated croplands in CONUS from 2002–2017 with large regional variability. For example, the Upper Mississippi watershed had the greatest percent increase in irrigated hectares (ha) of cropland from 2002–2017, increasing by 69%. The Lower Mississippi watershed followed with a 28% increase. The Texas-Gulf watershed had the greatest decrease in irrigated cropland, dropping by 18%. The California watershed followed closely behind the Texas-Gulf watershed with about 11% less irrigated cropland in 2017 than in 2002. The study identified various drivers for irrigation dynamics, including regional climate fluctuations and drought events, demand for specific crops, Government land or water policies, and economic incentives like crop pricing and land values. The MIrAD-US was assessed for accuracy using a variety of existing regionally based reference data, and accuracies ranged from 70% to 95%, depending on the region. The reference data were not of sufficient quality to provide robust measures of statistical uncertainty on the area estimates. The MIrAD-US dataset is available at the USGS data repository ScienceBase (https://doi.org/10.5066/P9NA3EO8) and the supporting journal paper is also available online (http://doi.org/10.3390/land10040394).
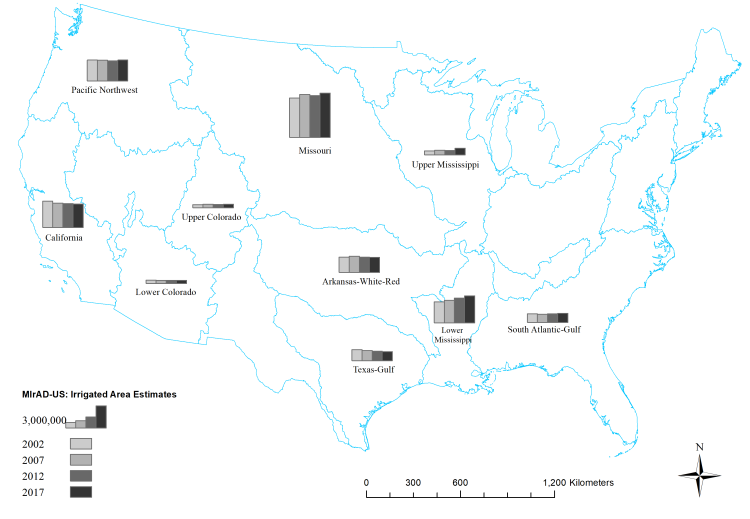
Summary of irrigated area in hectares estimated by MIrAD-US for 2002, 2007, 2012, and 2017. Blue polygons represent CONUS-wide HUC2 watershed boundaries.