
California’s San Joaquin Valley is one of the world’s most productive agricultural regions. Much of that productivity depends on the availability of water for irrigation. Recent prolonged droughts in California have underscored the importance of accurately monitoring changes and trends in water use in order to make well-informed water management decisions.
Scientists with the USGS Earth Resources Observation and Science (EROS) Center used Landsat images to quantify water use in the San Joaquin Valley over a 30-year period. A first step was to determine evapotranspiration (ET), which is water transpired by plants into the atmosphere as well as water that evaporates from the surrounding soil. ET can be used as a measure of water usage across a landscape. The scientists employed a computer model that incorporates Landsat imagery, including the Landsat 8 thermal band, along with climate data to estimate ET for every Landsat scene of the Valley from 1984 to 2014.
The team then integrated the ET results with precipitation and runoff data to create maps that reveal historical trends in water use and availability on irrigated basins in the Valley over the 30-year time period. Detailed enough to show individual fields, the maps depict water use (in millimeters) for a given day or an entire growing season, and, when combined with crop data, can also reveal which crops are using the most, or least, water.
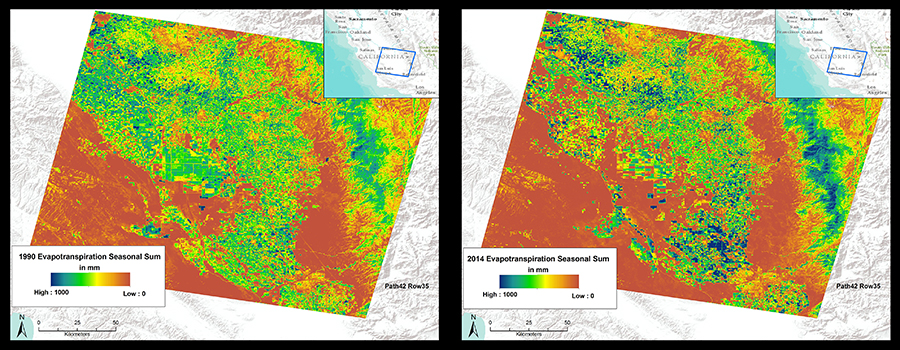
The two maps above show seasonal water use in the San Joaquin Valley in 1990 (left) and 2014 (right). Color coding indicates how irrigation patterns changed over time. Notice, for example, that water use intensified in many places (increase in blue areas) and some irrigated lands (green in 1990) transitioned out of agricultural production (reddish brown) by 2014.
Landsat data are free and easily accessible at http://earthexplorer.usgs.gov/. This research approach can be replicated to produce similar water use maps for other locations across the United States. These maps can help farmers, water management agencies, and rural development planners balance irrigation practices and crop choices with precious water resources.