
Burn Mapping
Earth Resources Observation and Science (EROS) Center - Earthshots
After a wildland fire, scientists at the USGS EROS Center quickly begin working on preliminary soil burn severity assessments. They provide results of this work to Department of Interior (DOI) Burned Area Emergency Response (BAER) teams and other local federal land managers. BAER teams consist of an interdisciplinary group of scientists that evaluate the effects of wildland fires and develop mitigation plans to protect valuable natural resources, protect human life and property, and promote landscape recovery.
“The soil burn severity map is a critical component for many of the BAER team postfire hazard mitigation prescriptions,” says Randy McKinley, a geographer with the USGS EROS Center, who routinely maps fires on DOI-managed lands for the Bureau of Land Management, National Park Service, Bureau of Indian Affairs, and the U.S. Fish and Wildlife Service.
The burn severity map, also called a Burned Area Reflectance Classification (BARC) map, is created using digital image processing techniques developed by USGS, USFS, and other scientists. The BARC is a preliminary soil burn severity map that is field validated and refined by the BAER team. The final map provides a synoptic view of large fires that is not easily obtained in a timely manner on the ground.
The BARC map is made by comparing NIR and SWIR spectral band values. NIR light is largely reflected by healthy green vegetation. SWIR light is largely reflected by ash and bare soil. The burn map exploits the relationship between these two bands. The best way to do this is to measure the relationship between these bands prefire and then again postfire. The areas where the relationship between the two bands has changed the most are most likely to be severely burned. The areas where that relationship has changed little are likely to be unburned or very lightly burned.
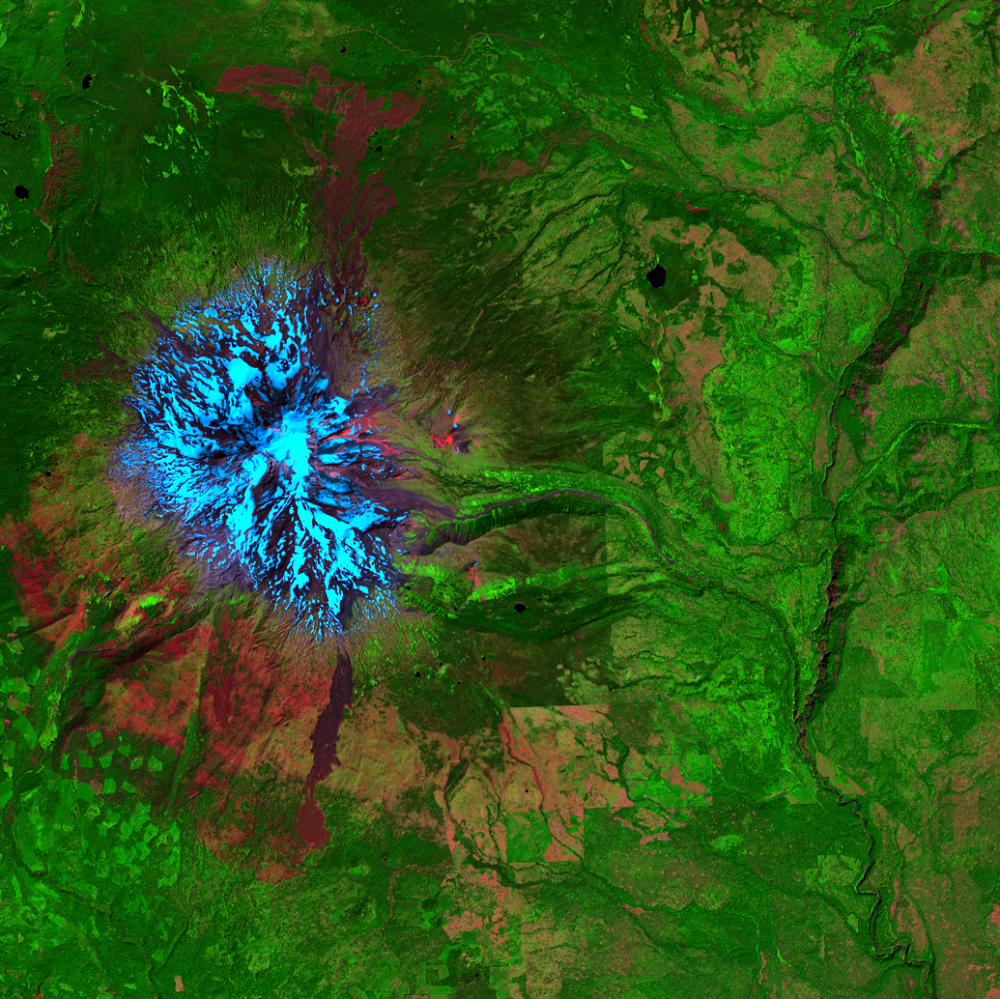
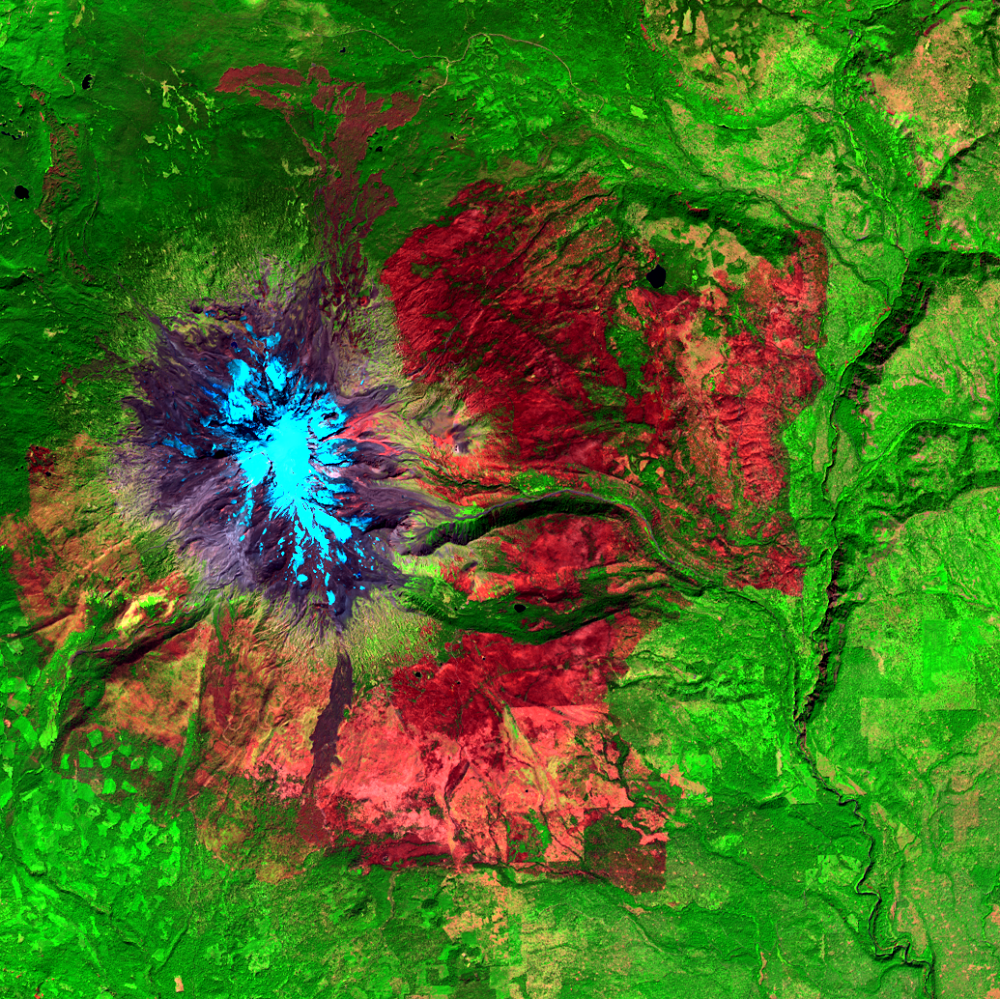
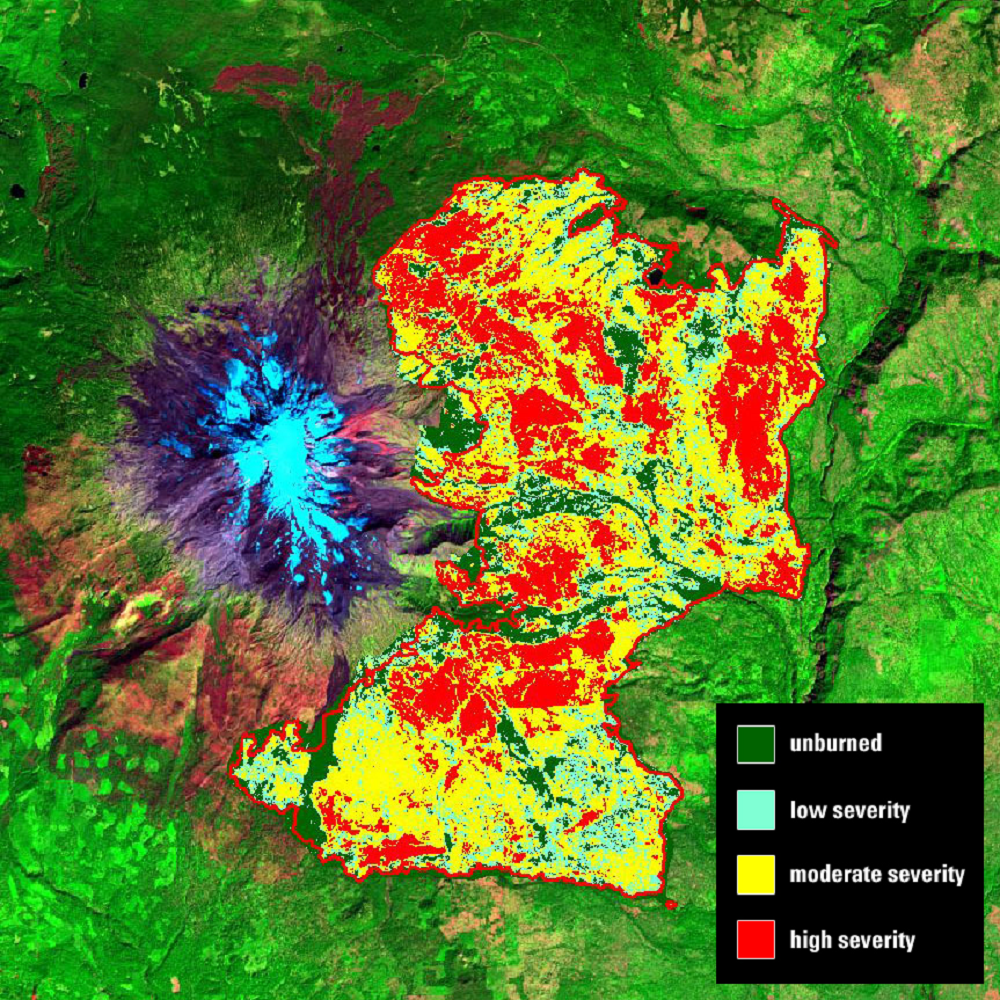
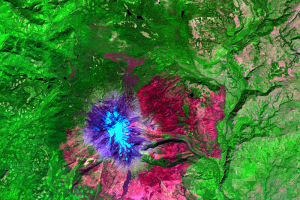
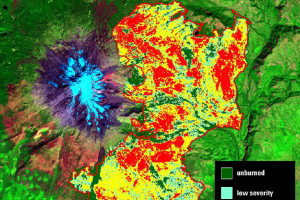
For example, Landsat 8 helped map destruction caused by the Cougar Creek fire near Mount Adams, 75 miles northeast of Portland, Oregon, which started on August 10, 2015. In the three images to the left, snow appears cyan on its peak. The postfire Landsat image from September 11, 2015, shows where the previous green vegetation south and east of the mountain is now charred and appears in shades of red. In the burn severity map, dark green is non-burned, light blue is low burn severity, yellow is moderate severity, and red is high.
The timely delivery of BARC maps, generally in less than 2 days after image acquisition, would not be possible without the USGS capability to efficiently downlink, process, and distribute Landsat and other satellite data. USGS hydrologists and soil scientists routinely request BARC products to obtain a better understanding of postfire erosion and water quality issues. McKinley adds, “BARC maps have also proven to be a crucial data layer for the modeling and prediction of potentially destructive postfire debris flows.”
EROS responds to dozens of requests for burn mapping support each year. It’s not possible to get such a quick and complete assessment without satellite imagery. Landsat’s 30-m resolution is optimal for providing the detail suitable for landscape scale wildland fire mapping. When Landsat data are not available, imagery from the NASA EO-1 satellite, ESA’s Sentinel-2, and satellite sensors such as Advanced Spaceborne Thermal Emission and Reflection Radiometer (ASTER) and Moderate Resolution Imaging Spectroradiometer (MODIS) provide options for developing a complete picture of landscape change caused by wildland fire.
Imagery
Downloads
Related Content
Cougar Creek Fire, Washington, USA
Wildland fires can leave behind scorched mountainsides with no trees o...
Burn Mapping
After a wildland fire, scientists at the USGS EROS Center quickly begi...