
Colorful Composites
Earth Resources Observation and Science (EROS) Center - Earthshots
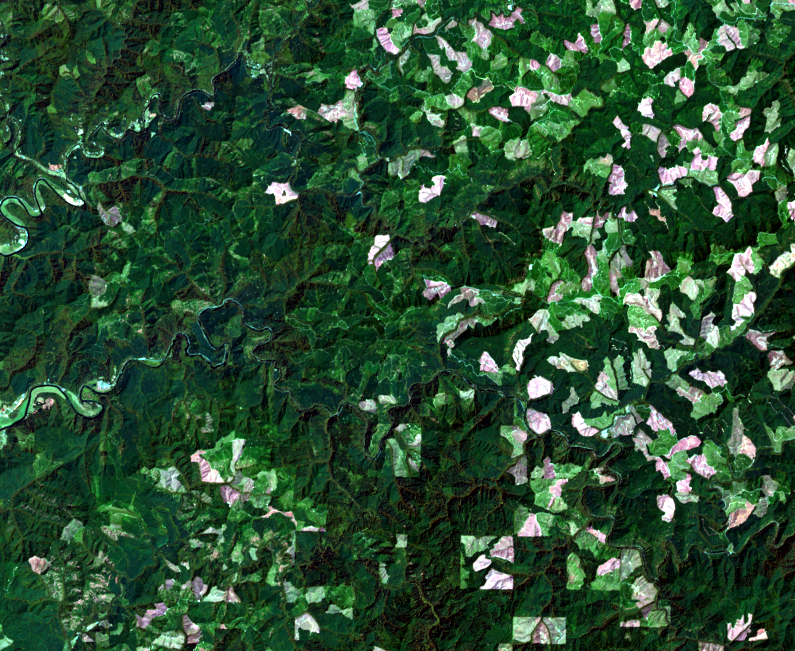
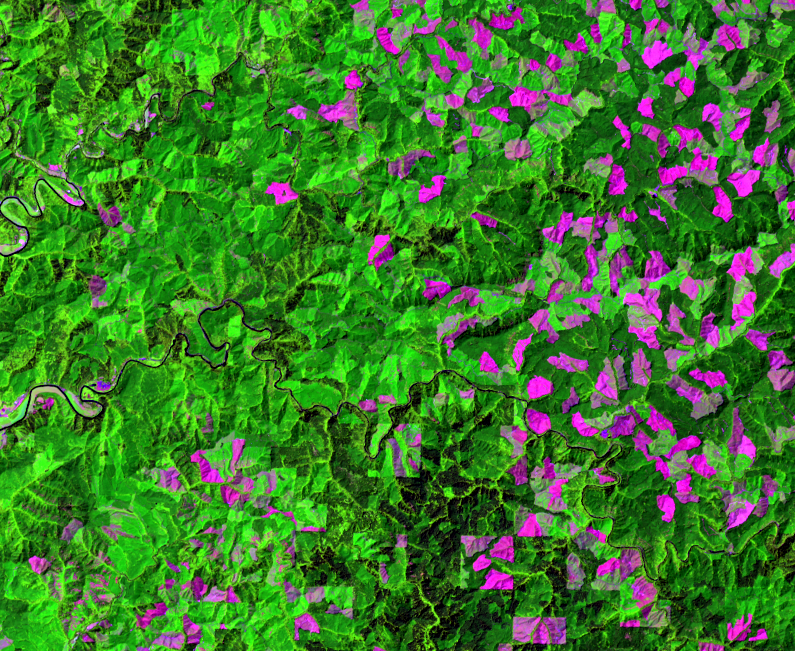
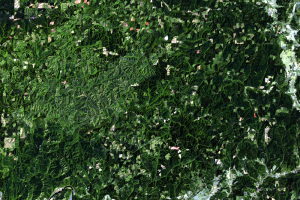
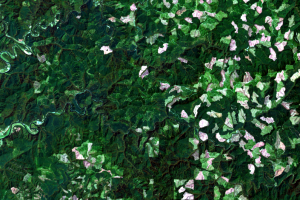
On Earthshots we typically show “multispectral composites”—single-date images that combine three different wavelengths into one image. The example used in this section shows a different combination of infrared wavelengths than was used on the 2016 image from the “Interpret the Images” section. In this image, the clearcuts are pink against the bright green of the forest. This combination of infrared wavelengths makes the clearcuts that have occurred from one year to the next stand out more clearly.
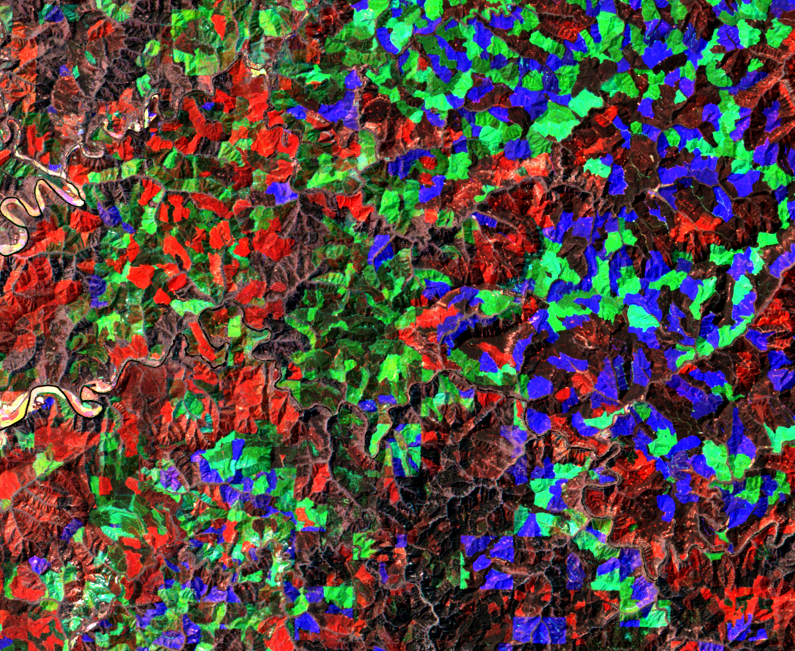
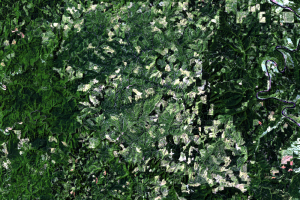
We don’t often examine change over time in one image. That’s what the colorful image in this section shows. It’s a “multitemporal composite”—one image that shows three different dates combined. This image shows a combination of Landsat images from 1994, 2009, and 2016. Red shows clearcuts that were evident in the 1994 image. Green shows clearcuts that took place by 2009. And blue shows clearcuts that occurred by 2016. Darker tones are areas of forest that did not change in this time frame. This way of examining the imagery shows that logging has affected nearly the entire landscape shown, something that may not be evident when looking at a single-date image.
People derive many ecological and economic benefits from forests, and Landsat can help forest managers monitor changes to ensure these resources are available for future generations.
Imagery
Every picture has a story to tell
Correlated
Additional story information
Downloads
Other Stories
Related imagery and additional content
Checkerboard Pattern
The close-up Landsat images that accompany this section show an obviou...
Clearcutting
A logging strategy that’s easy to spot in the Landsat imagery is clear...
Colorful Composites
On Earthshots we typically show “multispectral composites”—single-date...
Interpret the Images
A more up-close look in the Landsat images helps you to see the progre...