
How Landsat Helps
Earth Resources Observation and Science (EROS) Center - Earthshots
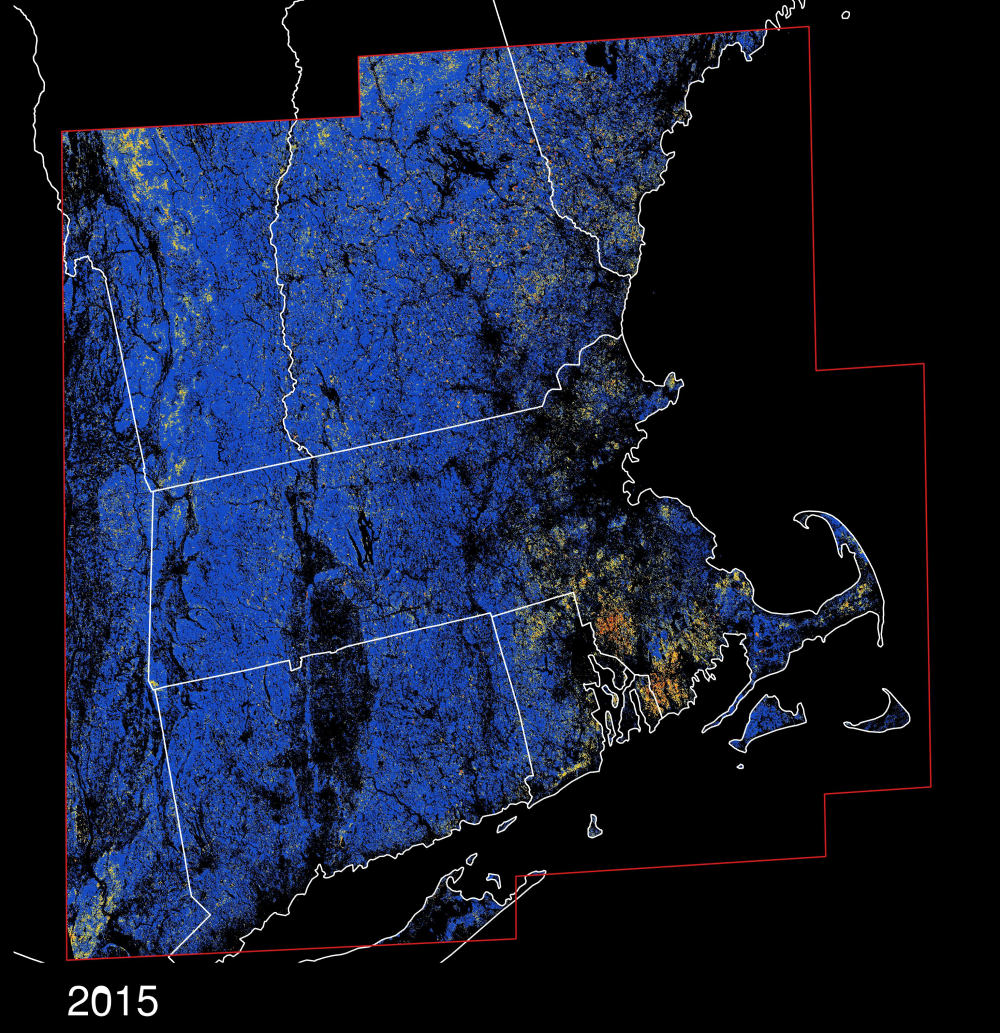
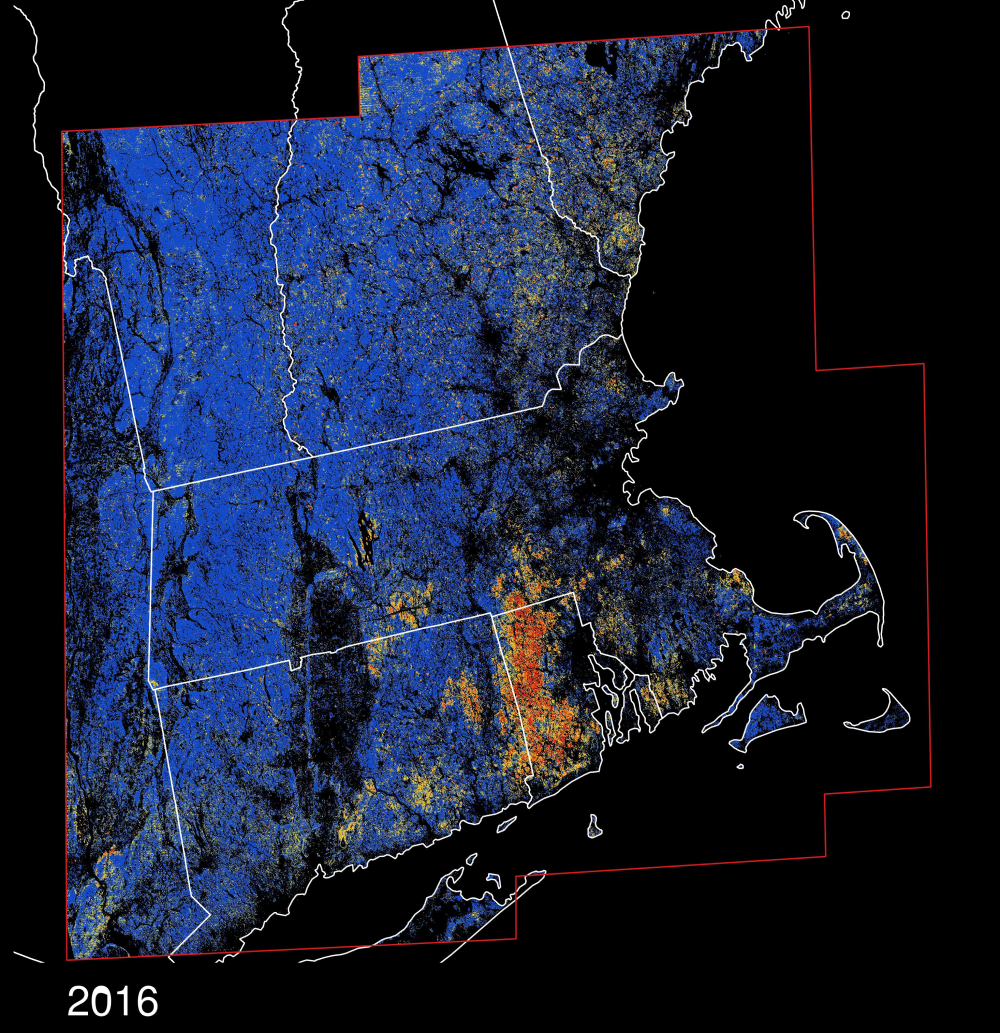
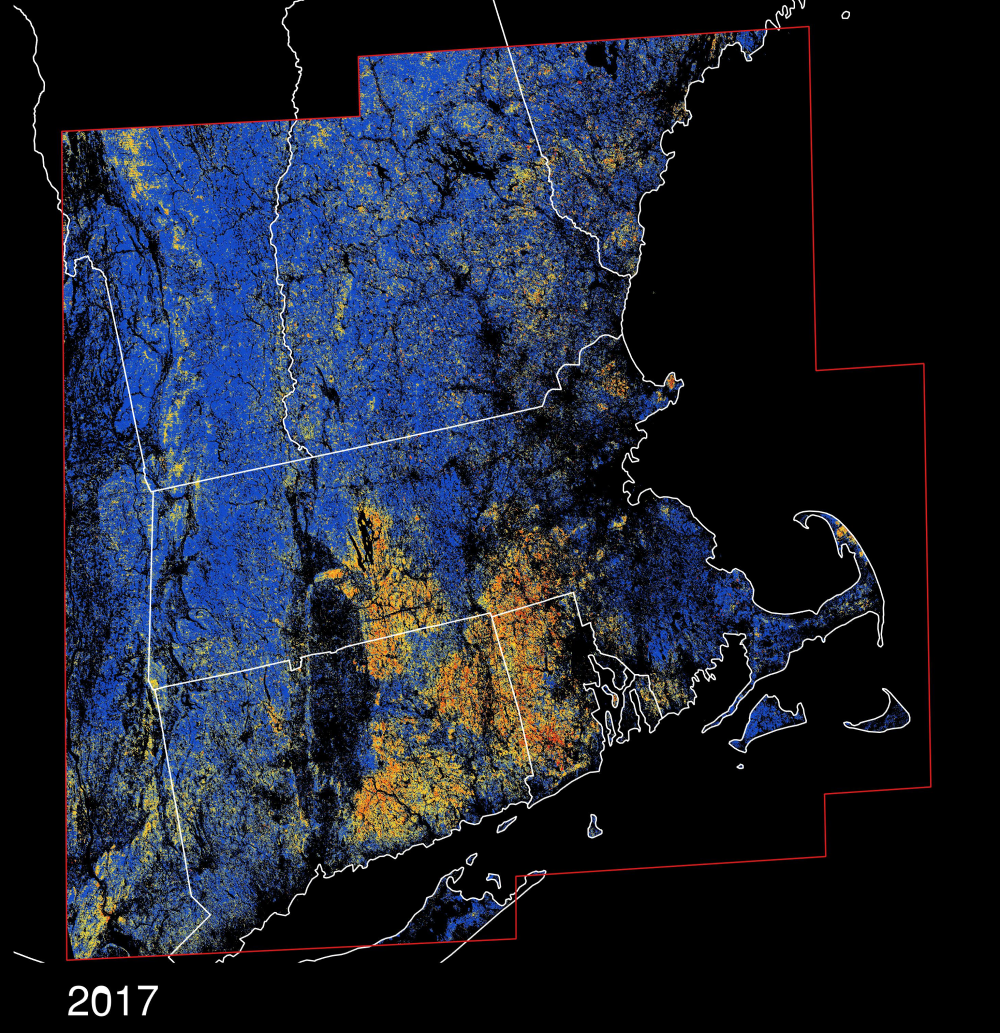
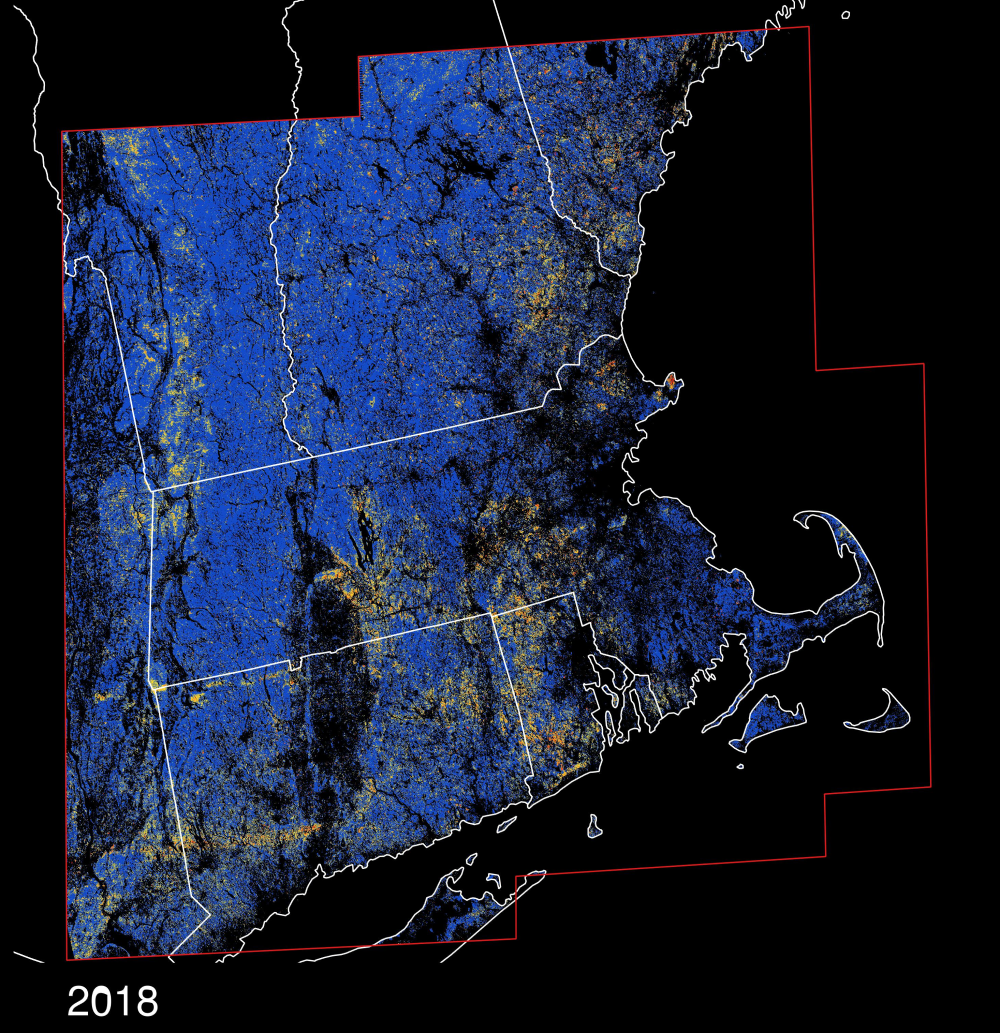
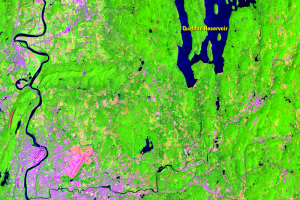
Landsat data can track the spread of the outbreak and monitor defoliation. Comparing newly acquired Landsat observations with long-term average conditions modeled from Landsat time series makes it possible to detect changes in vegetation “greenness” in near-real time.
These forest condition assessment maps represent changes in expected forest reflectance signatures compared to average patterns over an 11-year baseline. Blue pixels indicate forest conditions that are within the normal range of variability, while yellow, orange, and red show sustained decreases in vegetation greenness that coincide with caterpillar stages of the gypsy moth life cycle and are indicative of varying degrees of defoliation.
Black is non-forest, according to National Land Cover Database 2011 (NLCD 2011) classifications.
Data from Landsat not only detects initial outbreak and magnitude of the defoliation but also recovery later in the season.

Imagery
Every picture has a story to tell
Correlated
Additional story information
Downloads
Other Stories
Related imagery and additional content
Damage
Gypsy moth caterpillars devour the leaves of hardwood trees, causing t...
How Landsat Helps
Landsat data can track the spread of the outbreak and monitor defoliat...
Outbreak Causes
The current gypsy moth outbreak is thought to be the result of a serie...
Springfield
The overall severity of gypsy moth defoliation was less in 2018, but t...