
Seasonal Variations
Earth Resources Observation and Science (EROS) Center - Earthshots
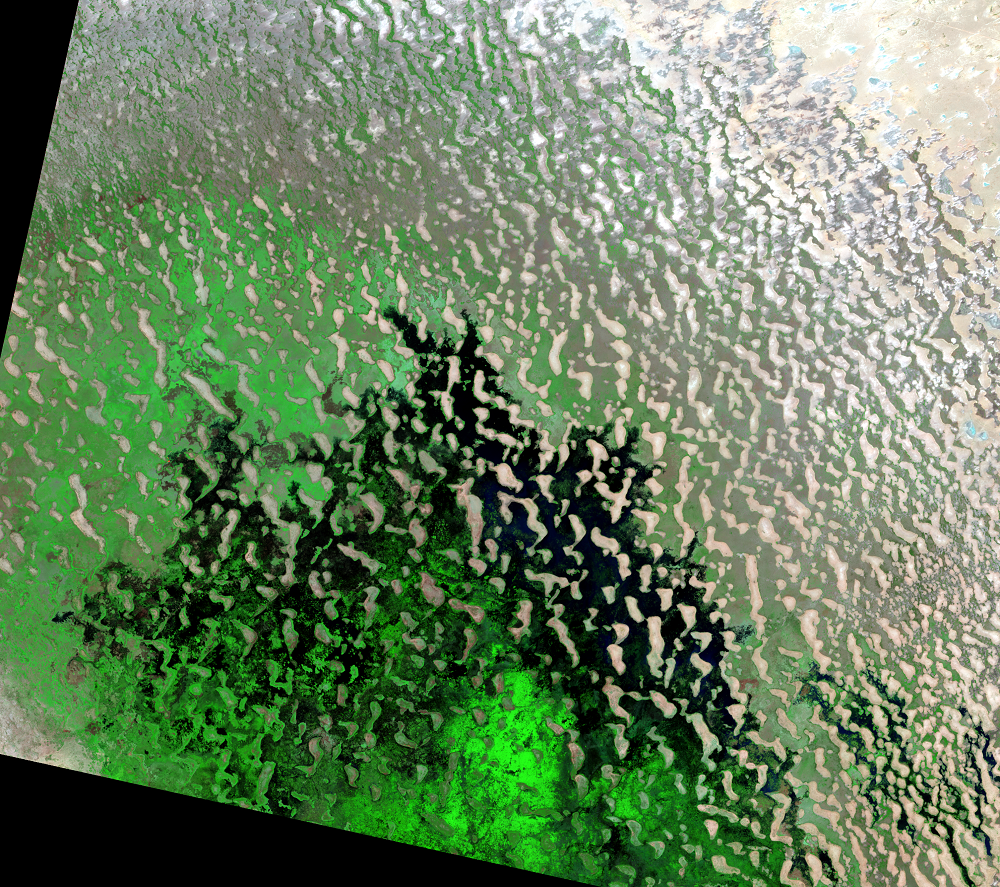
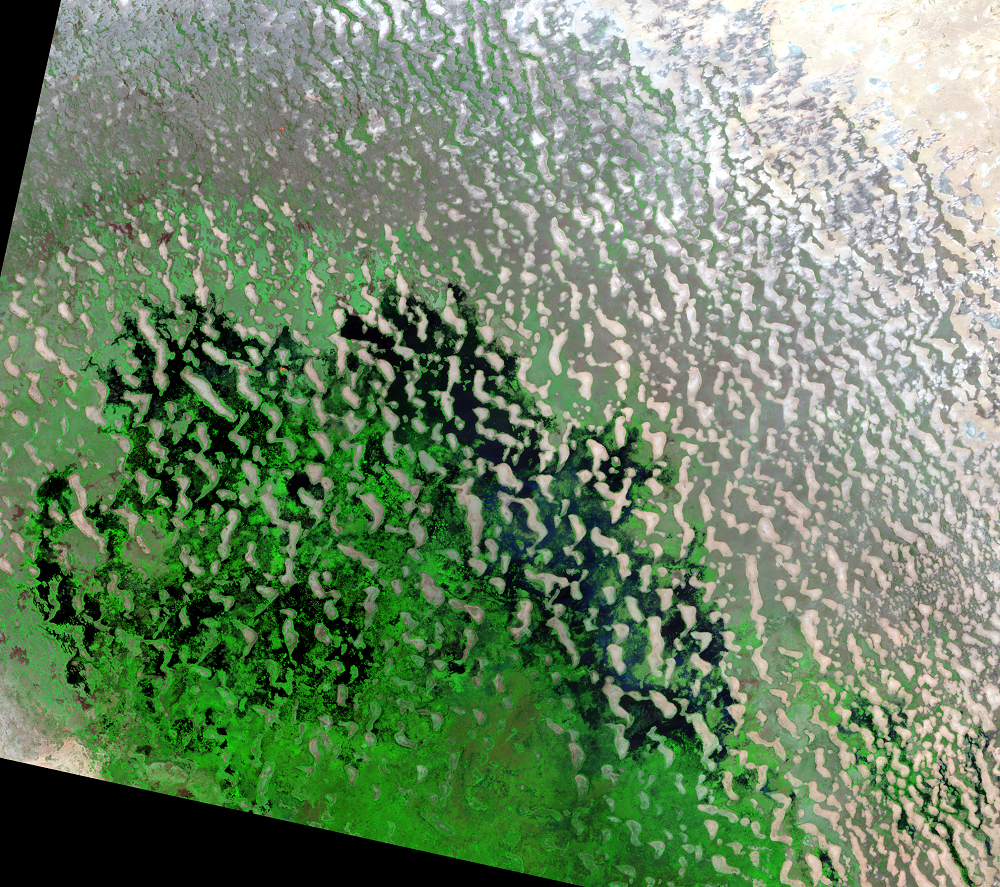
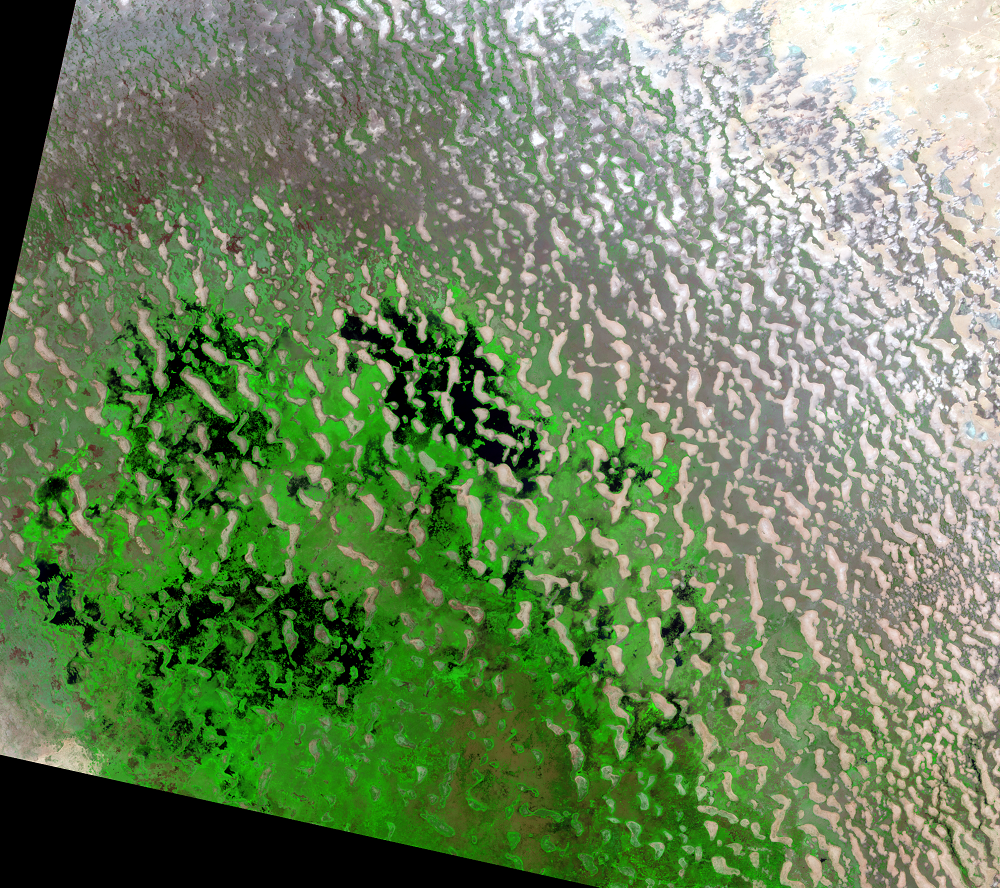
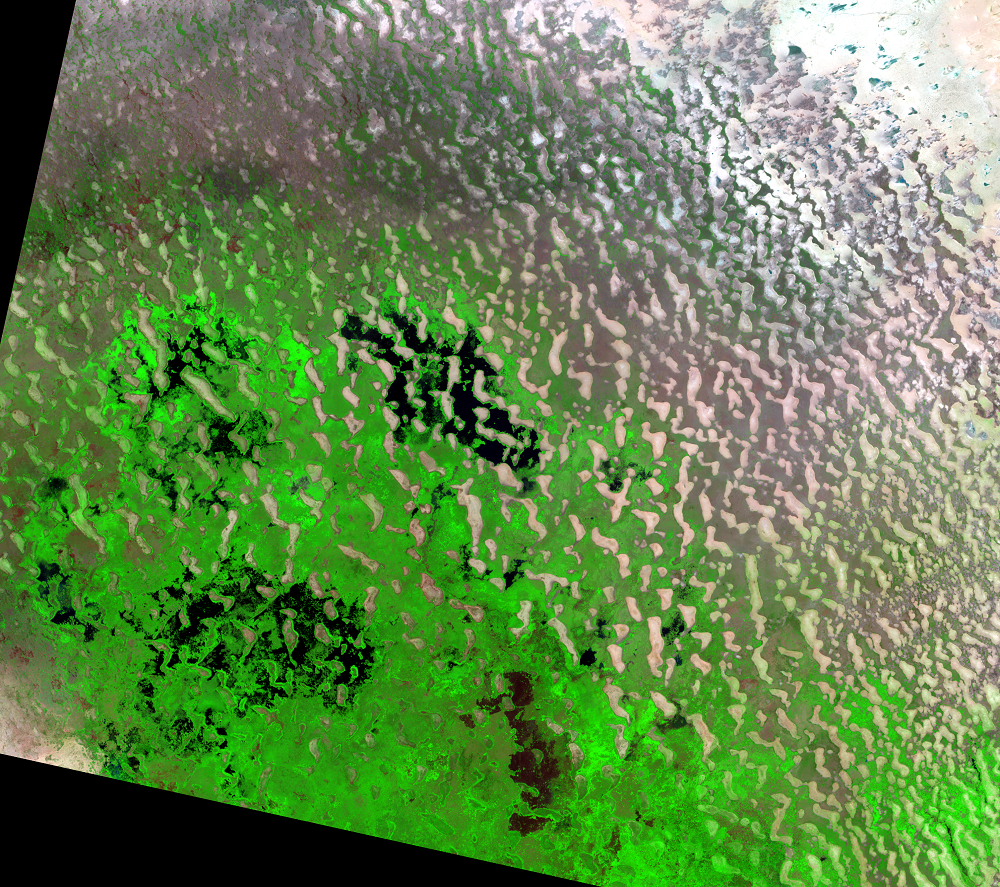
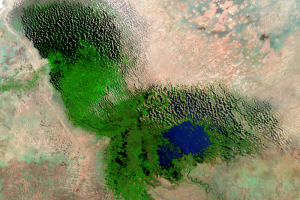
While the overall trend in this time series is a shrinking lake, the northern portion has some water in the later images, but it varies widely. Water levels there remained below the 1900–2010 mean and far below what it was in the 1960s.
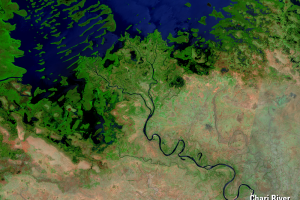
The region has a short rainy season, and changes in rainfall amounts can greatly affect the water supply. About 90% of the rain falls from June to September, but the lake doesn’t rise until November. This is the natural lag time of water flowing through the Chari River system.
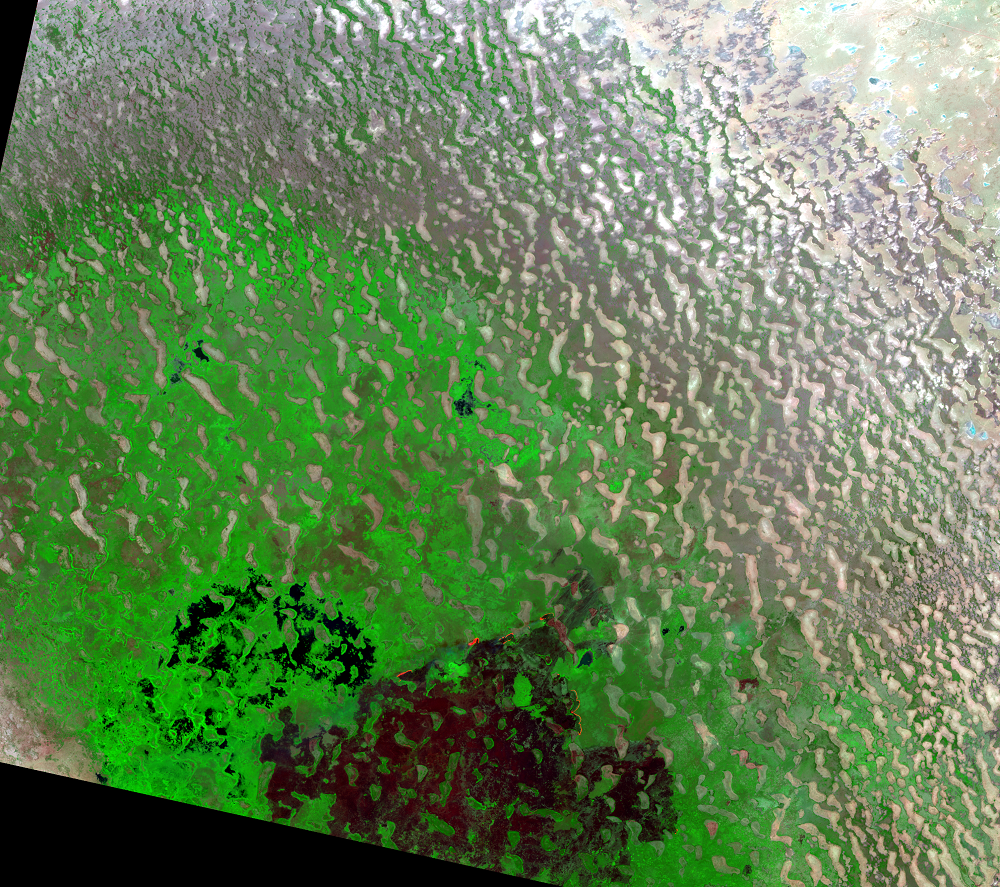
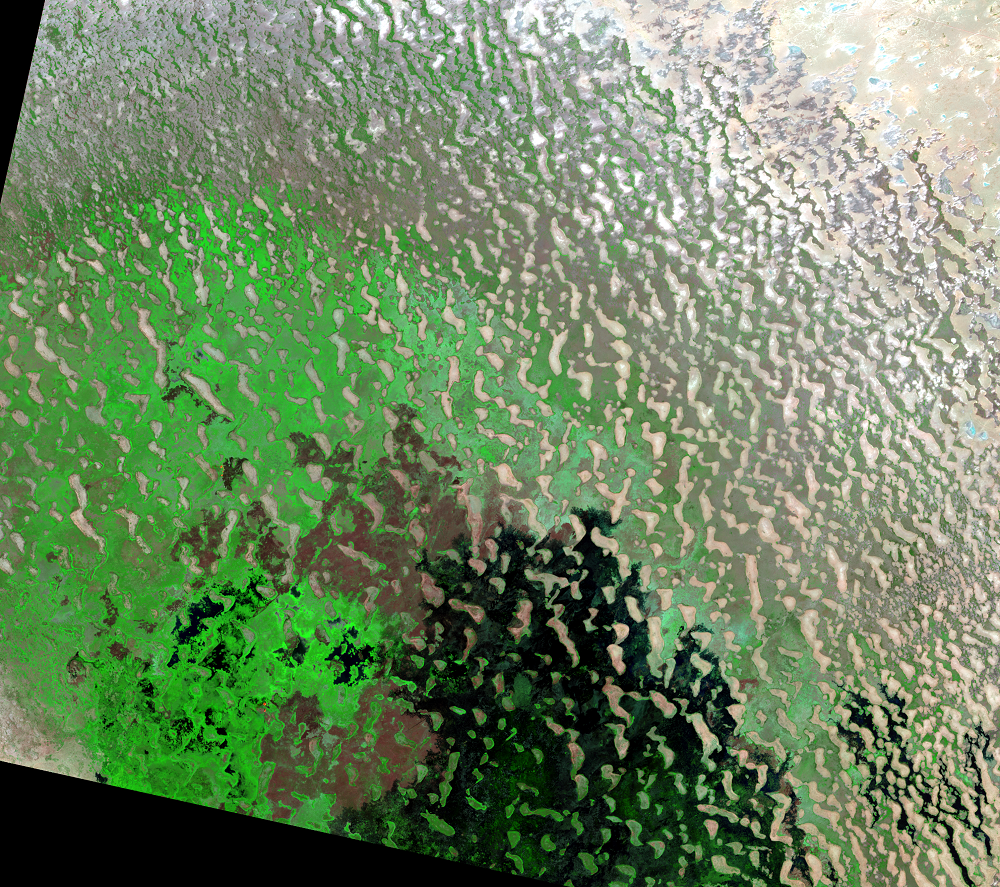
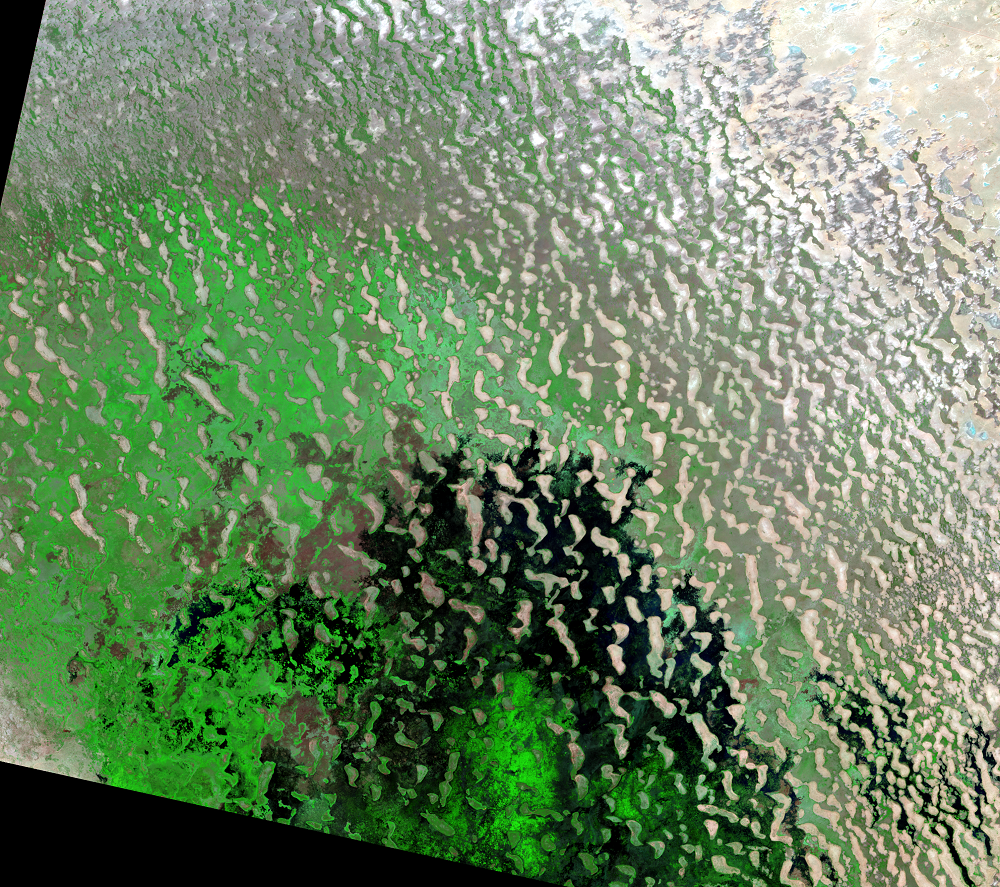
In this series of Landsat images from 2017–2018, the water rises through February and then tapers off slowly for several months. So the rise in water levels actually occurs during the dry season.
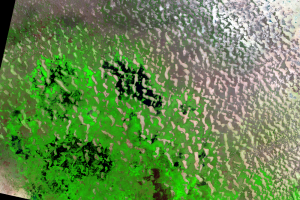
Water displays as dark blue, and wetlands are green. The brighter speckles are sand dune islands. Landsat will continue to provide information about Lake Chad’s changes, its infrared imaging capability accurately delineating land, water, and wetland.
Imagery
Downloads
Related Content
Lake Chad, West Africa
Lake Chad was once the sixth largest lake in the world, but prolonged ...
Seasonal Variations
While the overall trend in this time series is a shrinking lake, the n...
Water Level Fluctuations
Lake Chad’s lakebed is flat and shallow, so small changes in water lev...