

Global Forest Maps
Earth Resources Observation and Science (EROS) Center - Earthshots
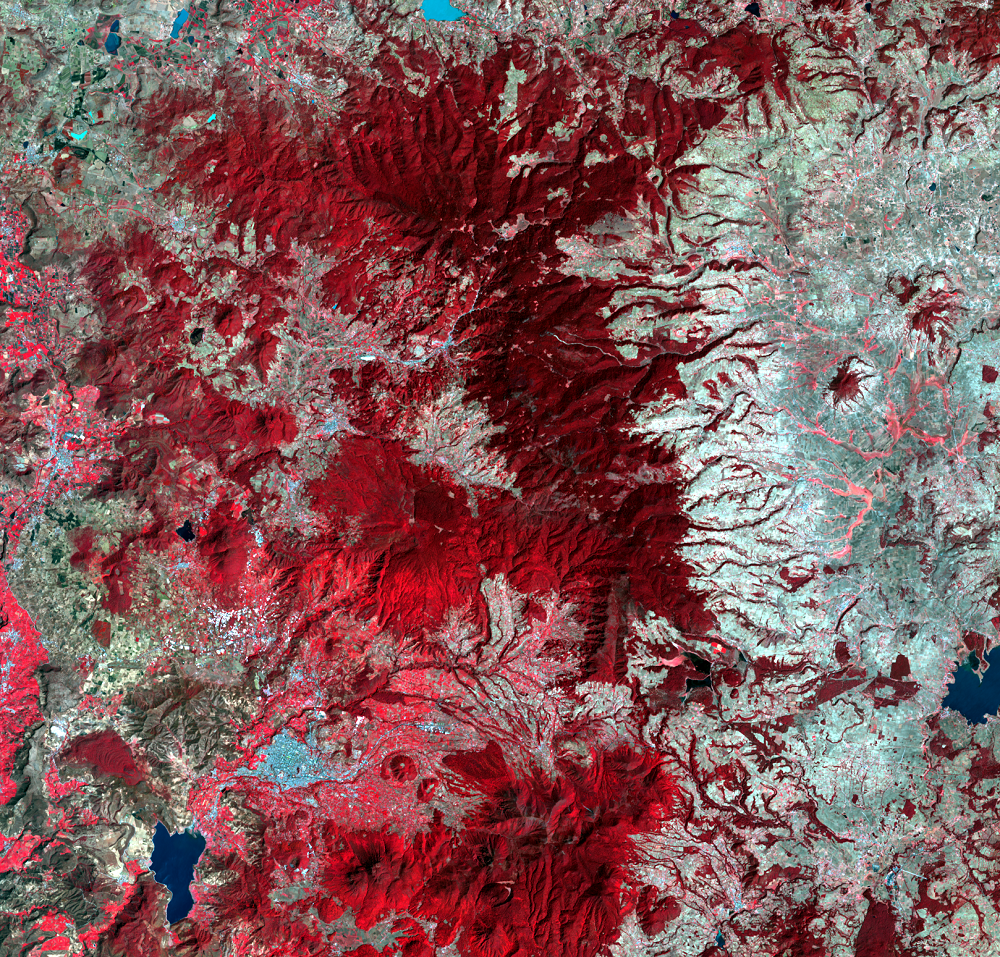
Researchers from the University of Maryland and USGS have mapped changes in forests globally from 2000 to 2013. The maps displayed here are from that database and are paired with a corresponding Landsat image.
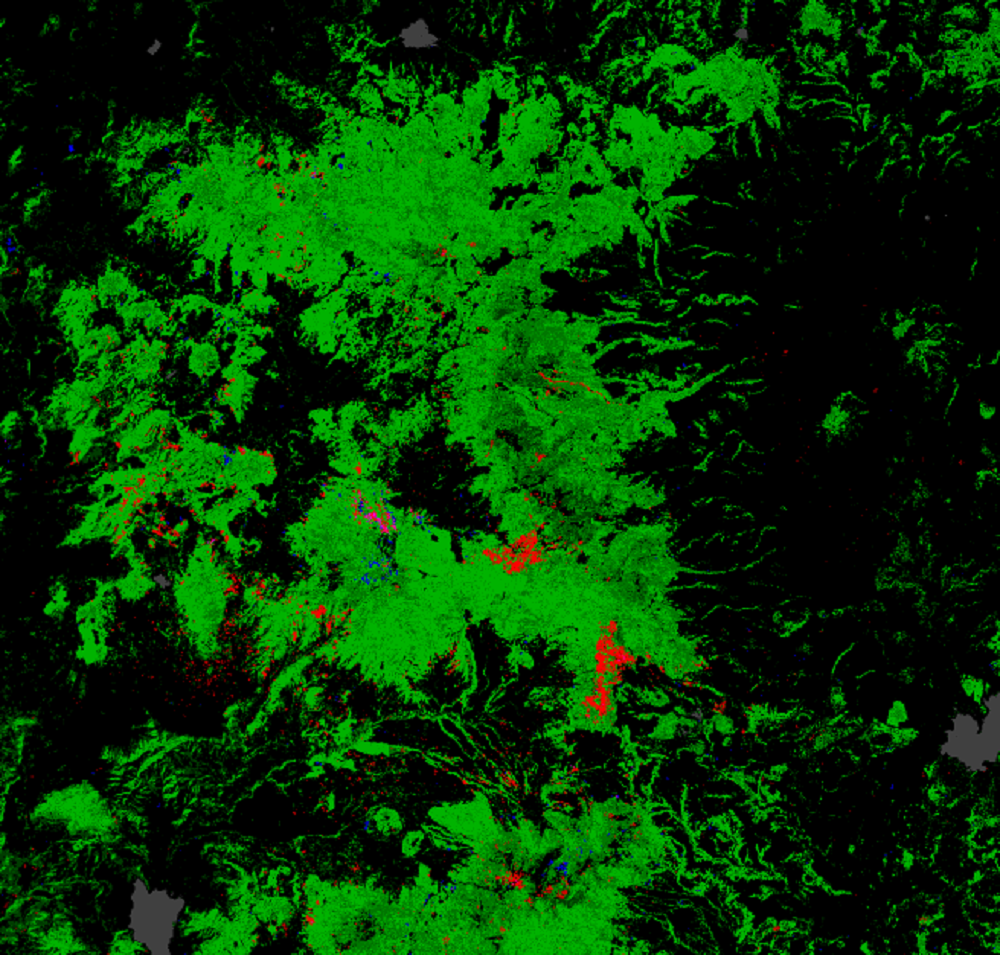
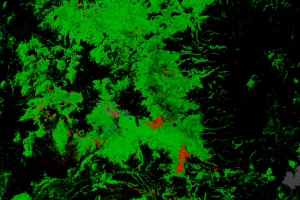
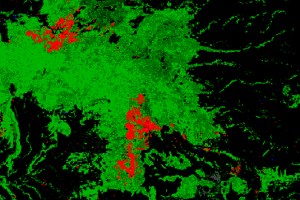
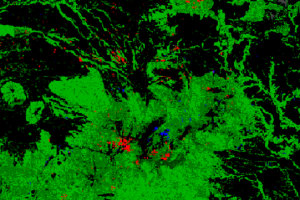
The study defined trees as all vegetation taller than 5 meters. In the forest change map, green indicates forest extent, and red is forest loss during the period 2000–2013. Any blue that appears is forest gained during that time period. Black is land that was non-forest during the time period.
The study used data from over 650,000 Landsat scenes and used 143 billion 30-meter Landsat pixels.
Imagery
Downloads
Related Content
Monarch Butterflies, Mexico
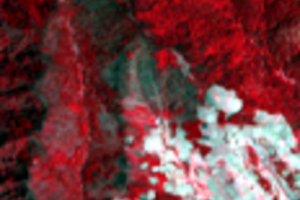
The patches of red in these false-color Landsat images are the forests...
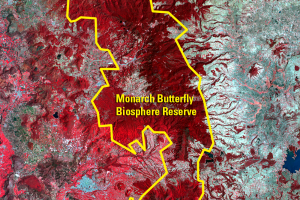
Degraded Habitats
The monarch migration is an endangered phenomenon. Logging in the over...
Global Forest Maps
Researchers from the University of Maryland and USGS have mapped ...
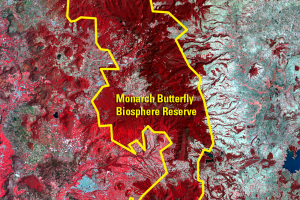
Lomas de Aparicio
These close-up images show a portion of the reserve. The red spots in ...

Monarch Value
The good news about the monarchs is that they are a beloved bug. Kids ...
NDVI
Subtle changes in vegetation are sometimes difficult for us to see whe...
Pelon
These close-ups show another core zone area of the reserve called Pelo...