
On August 10, 2015, the Soda Fire began burning about 8 miles northeast of Jordan Valley, OR. It spread rapidly because of high winds, parched fuels, triple digit heat, and low humidity. Over 283,000 acres had burned by August 20.
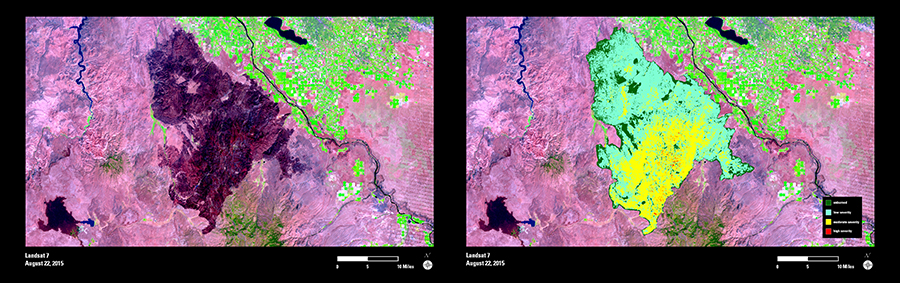
On the morning of August 22, Landsat 7 captured a postfire image (left) of the Soda Fire burn scar. This image was used along with a prefire image from Landsat 8 to derive a Burned Area Reflectance Classification (BARC) map.
The BARC map (right) was created using digital image analysis techniques developed by USGS, USFS, and other scientists, and it allows a synoptic view of fire extent and severity. The map is preliminary and has not yet been field-validated.
This type of detailed information would be difficult to obtain in a timely manner based on ground observations alone. Reflecting the amount of vegetation loss caused by the fire, the colors on this map show that the Soda Fire was mostly classified as low and moderate severity (light green and yellow), with few high severity areas (red).
EROS scientists respond to dozens of requests for burn mapping support each year. It would not be possible to obtain a rapid and complete assessment without satellite imagery, and Landsat’s 30-meter resolution provides the detail needed for rapid landscape-scale wildland fire mapping.