

On November 15, 2013, a new Global Forest Change survey was released. This online tool shows the forest change that has occurred worldwide from 2000 to 2012, and is based on the global repetitive observations by Landsat satellites during this time period.
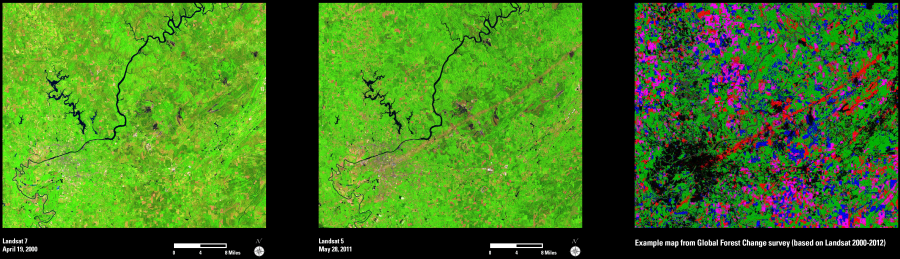
These example images show the observed changes in forest cover north and east of Tuscaloosa, Alabama. They also show the change after an EF5 tornado caused massive destruction on April 27, 2011.
The two Landsat images show the forested areas in 2000 and 2011. The tornado path can be clearly seen in the second image.
The derived Global Forest Change map for the same area (right) is based on repeated Landsat observations from 2000 to 2012. Red indicates net forest loss, and blue indicates net forest gain. Magenta indicates mixed activity (gain and loss) within this time interval. Green indicates no change to the forest cover, and black indicates nonforest.
The overall mixed colors in the Global Forest Change map help to record the dynamic nature of the local forest land cover. The red streak clearly shows the forest loss caused by the 2011 tornado.
The new Global Forest Change Web site is the result of collaboration between USGS, NASA, the University of Maryland, and Google. See the interactive map of global forest change at: http://earthenginepartners.appspot.com/science-2013-global-forest