
Looking for estuaries in Earthshots, or icebergs in Image of the Week? Maybe you just want to see all content about Kansas or Kazakhstan! Our Media Gallery Search lets you comb through all our featured images and videos by simply typing a word in Search. You also can search in only one category, such as “Earth As Art,” by choosing an option in the “Type” dropdown menu.
Media Gallery Search
Earth Resources Observation and Science (EROS) Center
| Title | Type | Keywords | Description | Full Description | Earthshot Theme Collection | Earthshot Story Collection | ||||||||||||||||||||||||||||||
|---|---|---|---|---|---|---|---|---|---|---|---|---|---|---|---|---|---|---|---|---|---|---|---|---|---|---|---|---|---|---|---|---|---|---|---|---|
| “Nighttime” Images | Earthshots | calving, ice shelves, icebergs | Landsat 8 normally images all Earth landmasses… |
Landsat 8 normally images all Earth landmasses every 16 days. However, at high latitudes, there is considerable overlap because Landsat 8’s orbital tracks converge at the Poles. As a result, this increases the temporal frequency of Landsat 8 coverage over northern Greenland. Building on this imaging overlap, Landsat 8 takes advantage of long hours of daylight in the Arctic to acquire “nighttime” sunlit images, increasing temporal coverage even more. The two Landsat 8 images were acquired a little over 3 hours apart, one on its descending orbit and one ascending. Having multiple images increases the chances of acquiring more cloud-free images and helps scientists monitor iceberg calving events. |
Glaciers, Water | |||||||||||||||||||||||||||||||
| 100 Million Landsat Downloads | Image of the Week | national parks | This Landsat 8 image from May 24, 2017, shows an… | This Landsat 8 image from May 24, 2017, shows an enthralling New Zealand landscape. Tongariro National Park surrounds snow-capped Mount Ruapehu on the right, and the boundary of forested Egmont National Park forms a nearly perfect circle on the left. Mount Taranaki marks the center of the park, which is surrounded by green farmland. The white running through the middle of the scene is fog accompanying the Whanganui River. The scene was downloaded on March 9, 2020, one of over 29,000 Landsat scenes downloaded worldwide that day. But this scene is special. The picturesque view of New Zealand’s North Island marks the 100 millionth downloaded from the archive at the USGS Earth Resources Observation and Science (EROS) Center since Landsat data became freely available on October 1, 2008. That’s one scene every 3.6 seconds since the open policy began. Ok, we know some of you download gobs of data all at once—that’s just an average. And it’s a number that wouldn’t be possible if the data weren’t free and open. These downloads help researchers conduct countless land change studies and provide essential information to help land managers and policy makers make wise decisions about our resources and our environment. Landsat 7, launched in 1999, and Landsat 8, launched in 2013, together acquire over 1,200 images each day. With the launch of Landsat 9 on the horizon, the amount of acquired data will increase to about 1,500 images each day. |
||||||||||||||||||||||||||||||||
| 10th Anniversary of Landsat's Free & Open Data Policy | Video - Landsat | |||||||||||||||||||||||||||||||||||
| 150th Anniversary: J.W. Powell's Perilous River Expedition | StoryMaps | Description Powell’s journey 150 years… | Description
Powell’s journey 150 years ago became one of the great surveys of the west that led to the formation of the U.S. Geological Survey. Powell said, “The exploration was not made for adventure, but purely for scientific purposes, geographic and geologic” (Powell, 2003). But it turned out to be an epic adventure. The expedition team left Green River, Wyoming, on May 24, 1869, and made it past the Grand Canyon to the confluence of the Colorado River and the Virgin River on August 30. Enjoy the stories of the adventures along the way.
Layers
Terms of Use
This is an embedded map in the larger 150th Anniversary: J.W. Powell's Perilous River Expedition geonarrative and is not intended to be viewed or used alone.
|
|||||||||||||||||||||||||||||||||
| 2 Million Scenes from Landsat 7 | Image of the Week | mangrove, mudflats, national parks | Landsat 7, which launched on April 15, 1999, has… | Landsat 7, which launched on April 15, 1999, has been continuing to acquire land images worldwide for 16 years. Landsat 5 may hold the Guinness World Record for longest Earth-observing satellite at 28+ years, but Landsat 7 also has an impressive track record. In fact, Landsat 7 has now acquired over 2 million images. They are all freely available online at USGS GloVis or EarthExplorer. Landsat 7 and Landsat 8 acquire over 1,200 new images per day. This is more data than at any other time in the history of the Landsat program. The 2 millionth Landsat 7 scene includes a portion of northwestern Madagascar, acquired on September 11, 2015. The dark region in the lower left is the Ankarafantsika Nature Reserve. This large area of deciduous forest, savannah, and wetland is protected as a national park. On the left edge of the scene is Mahajamba Bay. This shallow bay contains Madagascar’s largest mangrove ecosystem, with tidal mudflats along the edges of the mangroves. |
||||||||||||||||||||||||||||||||
| 2004 Indian Ocean Tsunami | Image of the Week | earthquakes, tsunamis, waves | On December 26, 2004, a massive 9.1 magnitude… | On December 26, 2004, a massive 9.1 magnitude earthquake struck off the west coast of northern Sumatra, Indonesia. The third largest earthquake ever recorded lifted the sea floor several meters, causing tsunami waves to ripple out in all directions and race across the ocean. Banda Aceh bore the brunt of the waves just 15 to 20 minutes after the earthquake. Waves in some locations along the Sumatra coast were reported to be 30 meters high. Images from Landsat 5 show the coastline before and after the tsunami struck, revealing where vegetation was stripped from the land. Landsat provides rapid assessments of damage to land resources after natural disasters such as tsunamis, and continues to monitor recovery years later. |
||||||||||||||||||||||||||||||||
| 2010 Ice Break | Earthshots | calving, ice shelves, icebergs, rifts | Scientists observed rifts in Petermann Glacier… |
Scientists observed rifts in Petermann Glacier throughout the first decade of the 2000s. The rift that caused the 2010 break was first spotted in satellite imagery in 2001. See below for the location of this rift in a 2001 Landsat image. The massive calving event in 2010 removed 28 kilometers of the ice shelf. The result was an ice island four times the size of Manhattan, about 270 square kilometers. It was the largest iceberg to form in the Arctic since 1962. The last image displayed in this section shows a size comparison of Manhattan Island (yellow outline) to the iceberg. (Black stripes run through the images because of the Scan Line Corrector failure on Landsat 7 in May 2003.)
|
Glaciers, Water | |||||||||||||||||||||||||||||||
| 2012 Break | Earthshots | calving, ice shelves, icebergs, rifts, sea level rise | Just two years later, another large iceberg… |
Just two years later, another large iceberg broke off Petermann Glacier. This one was estimated at 130 square kilometers—about half the size of the 2010 iceberg. But this calving broke off the glacier tongue farther upstream and moved the front end of the glacier farther inland than has been observed since 1876, the first reported measurements of the glacier. The floating ends of glaciers like Petermann are known as ice shelves. They act as doorstops. When these ice shelves suddenly splinter and weaken, the glaciers that feed them speed up. The result is more ice flowing into the ocean, which could raise global sea levels. The development of these icebergs is a natural process; however, when there are two major breaks in two years, scientists must take notice. Even large breaks do not amount to a collapse of the floating extension; nevertheless, they are important events. (Black stripes run through the images because of the Scan Line Corrector failure on Landsat 7 in May 2003.) |
Glaciers, Water | |||||||||||||||||||||||||||||||
| 2014 World Cup—Rio de Janeiro, Brazil | Image of the Week | stadium | The 2014 Fédération Internationale de Football… | The 2014 Fédération Internationale de Football Association (FIFA) World Cup began on June 12, 2014, and has been taking place at numerous venues across Brazil. The final match is on Sunday, July 13, at the Maracanã Stadium in Rio de Janeiro. This Landsat 7 image was acquired on June 26, 2014. The main image shows the spectacular setting of the city of Rio, with its high mountains, islands, and famous long beaches that follow the coastline. The smaller image shows the location of the stadium (white circle) where the 2014 World Cup final match will take place. These “pan-sharpened” images use Landsat’s panchromatic band (15-m resolution) in combination with the 3-band multispectral information (30-meter resolution). This technique is often used by scientists and analysts when it is necessary to show more details within the Landsat image than would be visible using the multispectral information alone. |
||||||||||||||||||||||||||||||||
| 2015 Earthquake and Landslides, Nepal | Image of the Week | earthquakes, lakes, landslides, rivers | A magnitude 7.8 earthquake struck Nepal on April… | A magnitude 7.8 earthquake struck Nepal on April 25, 2015. Along with damage due to shaking, the earthquake and its aftershocks triggered many large and small landslides throughout the region. As of early May, over 3,000 individual landslides had been identified, based on analysis of hundreds of satellite images collected after the earthquake.
|
||||||||||||||||||||||||||||||||
| 2017 Rift | Earthshots | calving, ice shelves, icebergs, rifts | A new rift formed on Petermann Glacier in 2017… |
A new rift formed on Petermann Glacier in 2017. An older crack to the right of the new rift also extends toward the glacier’s center. By 2020, this new rift had met up with the older crack. If an iceberg breaks off, it would be Petermann’s third massive iceberg calving since 2010. It also could place the new calving face much farther upstream than the 2010 break. Close-up images from Sentinel-2 take advantage of its 10-meter spatial resolution to show the new rift in greater detail. Landsat 8 and Sentinel-2 complement each other by imaging glacial movement and possible calving events. The prominent vertical line could be from deformation of the ice as it flows over the bedrock farther upstream. The irregular topographic surface of the underlying bedrock could have caused the ice to develop this longitudinal crevasse as it moved over bedrock, resulting in a line being drawn the length of the glacier as it flows. Besides the new rift, other bumps and lines extend from this longitudinal line, which are stress fractures from the glacial movement. Along with becoming longer, notice that the rifts are also moving downstream between 2017 and 2022 as the glacier flows. |
Glaciers, Water | |||||||||||||||||||||||||||||||
| 2018 Eruption | Earthshots | crater, eruption, fissure, island, lava, lava flow, laze, volcano | On April 30, 2018, rapid changes in the East… |
On April 30, 2018, rapid changes in the East Rift Zone were detected. The Pu‘u ‘Ō‘ō crater floor collapsed. Ground deformation toward the east indicated magma intrusion approaching the Leilani Estates neighborhood, 20 km from Pu‘u ‘Ō‘ō. Based on numerous geological, geochemical, and geophysical instruments, the USGS Hawaiian Volcano Observatory and other scientists determined that magma had drained from below Pu‘u ‘Ō‘ō crater. It then intruded through underground tunnels and emerged at eruptive vents, or fissures, in the lower East Rift Zone. On May 3, the first of 24 fissures along a 6-km line opened within Leilani Estates. Fissure 8 became the dominant vent on May 28. It shot lava tens of meters into the air and sent a vigorous flow toward the coast, ultimately entering the ocean near the eastern tip of the island. This series of images shows the progression of the lava flows throughout the summer of 2018. Clouds often obscure views of the island, but numerous observations from Landsat, Sentinel-2, and Resourcesat offered peeks through the clouds to the location of fresh lava. Some of the images also show “laze.” When lava mixes with seawater, it creates a noxious gas plume that looks like clouds or smoke. The word is a blend of the words lava and haze. Laze can cause skin and eye irritation and breathing difficulties. This flow ended abruptly on August 4, 2018. By this time, lava had destroyed more than 700 structures, covered 13.7 square miles (35.5 km2) of land, and added about 741 acres (300 hectares) of land to the island. Lava was a couple hundred meters thick in some places. |
Coasts, Natural-Disasters | |||||||||||||||||||||||||||||||
| 2019 Fires | Earthshots | A wet 2018–2019 winter caused extra plant… |
A wet 2018–2019 winter caused extra plant growth on Maui, and thus extra fuel, and was followed by drought and record-breaking heat in summer 2019. That set up conditions for an intense fire season. Firefighters reported the unusual weather conditions that made the fires worse: above normal temperatures and below normal humidity. In summer 2019, at least 19,300 acres burned across Maui, nearly all of it in the former cane fields. The dry grasses that largely replaced the cane fields are especially vulnerable to fire. Notice that the fire scar visible in the July 27, 2019, image didn’t last long, evidence that, unlike a forest fire burn scar, nonnative grass recovers rapidly and outcompetes native grasses after a fire. |
Agriculture, Fires | ||||||||||||||||||||||||||||||||
| 28 Years of Landscape Change in Texas, USA | Image of the Week | burn scars, center pivots, drought, irrigation, oil, oil wells | These images show a portion of the Texas… | These images show a portion of the Texas Panhandle where it meets the western border of Oklahoma. The area is part of the “Granite Wash” region, which contains over 3,600 wells that mine oil and natural gas from as deep as 17,000 feet (5,182 meters) underground. |
||||||||||||||||||||||||||||||||
| 32 Years of Change: Incheon, South Korea | Image of the Week | airports, bridges, islands, land conversion, urban growth | The shoreline area of Incheon, South Korea, has… | The shoreline area of Incheon, South Korea, has been changing dramatically over the past 32 years, as depicted by these Landsat images acquired in 1981 and again in 2013. Previous marsh areas have been turned into usable land through land reclamation. Urban growth has also expanded. |
||||||||||||||||||||||||||||||||
| 35th Anniversary of Mount St. Helens Eruption | Image of the Week | eruptions, logging, volcanoes | The violent eruption of Mount St. Helens 35 years… | The violent eruption of Mount St. Helens 35 years ago permanently changed the mountain and surrounding forest. The volcanic blast on May 18, 1980, devastated more than 150 square miles of forest within a few minutes. In these Landsat false-color images, forest appears as bright red interspersed with patches of logging. Snow appears white, and ash is gray. Before the eruption, Mount St. Helens towered about a mile above its base, but when the volcano erupted, its top slid away in an avalanche of rock and debris. When measured on July 1, 1980, the mountain’s height had been reduced from 9,677 feet to 8,364 feet—a difference of about 1,300 feet. The 2014 Landsat image shows vegetation regrowth, as light red and pink, in the devastated area. However, the gray around the mountain is still evident, and the volcanic crater is still prominent as an “amphitheater,” where the peak of the mountain slid away. Scientists are using this opportunity to witness the recovery process, both with satellites and on the ground. With its 40-plus years of consistent imagery, the Landsat archive is perfect for studying the landscape changes caused by natural disasters and the gradual recovery process. |
||||||||||||||||||||||||||||||||
| 40 Years of Recording Change | Image of the Week | urban growth | ||||||||||||||||||||||||||||||||||
| 50th Anniversary StoryMap | StoryMaps | |||||||||||||||||||||||||||||||||||
| 7 Million Landsat Scenes and Counting! | Image of the Week | ice, rivers, tundra | The Landsat archive, the world’s longest… | The Landsat archive, the world’s longest continuously acquired collection of space-based, moderate-resolution land remote sensing data, has now surpassed 7 million scenes since Landsat 1 first began collecting data in July 1972. This Landsat 8 image acquired on June 27, 2017, represents one of those millions of scenes to be added to the archive. Across the lower portion of this image in northeastern Alaska, clouds cover the Franklin Mountains area of the Brooks Range. Several rivers flow north from the mountains into the Beaufort Sea. The Canning River marks the western border of the Arctic National Wildlife Refuge, a largely primitive and undisturbed region. The prominent mountain range in the center of the image running east to west is the Sadlerochit Mountains. North of the mountains, the land becomes a flat-to-hilly treeless area called the North Slope coastal plain tundra. Off the coast, sea ice floats on the Beaufort Sea, and dark represents open water in this summer scene. Northern Alaska receives sunlight 24 hours a day this time of year. Landsat normally acquires imagery only during the day on the descending part of its polar orbit, when the surface of the Earth is in sunlight. But at these high latitudes, Landsat 8 takes the opportunity during summer to acquire imagery during the ascending “nighttime” part of its orbit. The day-lit ascending campaigns in high latitude regions increase the Landsat coverage in these persistently cloudy areas. The sun angle is different from a typical Landsat scene, providing a twilight glow to the scene. The 7+ million Landsat scenes are available for download at no charge from EarthExplorer, GloVis, and the LandsatLook Viewer. Follow the Landsat Program on Twitter @USGSLandsat or Facebook @NASA.Landsat. |
||||||||||||||||||||||||||||||||
| 8 Million Landsat Scenes | Image of the Week | ice, islands | The Landsat archive has added its 8 millionth… | The Landsat archive has added its 8 millionth scene. This stunning image was captured by Landsat 8 on July 28, 2018. It shows the coastline of Nordaustlandet, the second-largest island in Norway’s Svalbard archipelago. Most of the island is covered by massive white ice caps. The exposed rocky coast appears in reddish brown, peppered with blue and black lakes and flecks of white. The tiny island of Storøya is visible to the east. More than half of Storøya is also covered in ice. More than 1,100 Landsat scenes are added every day to the archive at the USGS Earth Resources Observation and Science (EROS) Center in Sioux Falls, South Dakota. The archive added its 7 millionth Landsat scene just over one year ago, in June 2017. The image of northeastern Alaska shows part of the Brooks Range, the western border of the Arctic National Wildlife Refuge, and a treeless coastal plain. Both Landsat images are part of the Earth’s longest continuously-acquired collection of space-based, moderate-resolution land remote sensing data. The first Landsat scenes were collected in 1972. Landsat data are available for download at no charge from EarthExplorer, GloVis, and the LandsatLook viewer. |
||||||||||||||||||||||||||||||||
| A 50-Year Flood Flashback | Image of the Week | aerial photos, floods, rivers | The high-water marks set by the Big Sioux River… | The high-water marks set by the Big Sioux River in cities across southeastern South Dakota have threatened to overtake records set 50 years ago, when the Army Corps of Engineers led missions to document the damage through hundreds of aerial photographs. This shot from April 10, 1969 shows black flood waters stretching north and south of just one of those cities: Dell Rapids, South Dakota. The Big Sioux had topped 16.47 feet the day before – a foot and a half higher than major flood stage. The river reached nearly 16 feet in March of 2019. This natural color Landsat 8 image was captured a day before the crest, and shows floodwaters fanning out in patterns remarkably similar to those observed 50 years before. The flooding footprint was still clear two months later, as plots of green vegetation begin to emerge. |
||||||||||||||||||||||||||||||||
| A Closer Look | Earthshots | center-pivot, irrigation, population, water use, wildlife area | Taking a closer look at Garden City shows the… |
Taking a closer look at Garden City shows the expansion in area the city experienced since 1972. They also show the proximity of the city to those center-pivot irrigation circles. Four of these circles take up almost 1 square mile, or one section, of land. Southwest of Garden City is an area absent of irrigated crops. This marks the location of the Sandsage Bison Range Wildlife Area, a reserve for many Plains natives, including an American bison herd. Another gap in irrigated cropland is a bit to the west of the game refuge. Marked by light spots is Holcomb Station, a coal-fired power plant operated by the Sunflower Electric Power Corporation. The plant opened in 1983, so it does not appear in the 1972 Landsat image. The 362-megawatt station uses coal mined in Wyoming's Powder River Basin. |
Agriculture, Water | |||||||||||||||||||||||||||||||
| A Dying Forest | Earthshots | drought, estuaries, mangrove, rivers, tidal flats | The coastal wetlands of Senegal are centered… |
The coastal wetlands of Senegal are centered on the Saloum River and a myriad of estuaries and tidal flats that make up this complex ecosystem. The estuaries are generally bordered by dense, vigorous stands of mangroves (dark red tones in the Landsat images). Part of this ecosystem is protected in Saloum Delta National Park. The wetlands are critical habitats for wintering Palearctic birds, as well as many species of fish and mollusks. The mangrove vegetation is made up of several species. Some mangrove species form low canopies, but others of the Rhizophora genus are among the tallest in the world, attaining heights of up to 40 meters. Mangroves grow in habitats that are periodically flooded by seawater (tidal influence) and river water. They are halophytes, plants that grow in salty environments. Since the late 1960s, it has become apparent that many of the mangrove forests are dying. One theory is that there is a serious mangrove disease that is systematically wiping them out. However, most evidence indicates that the mangrove die-off is related to the widespread Sahelian drought, which has plagued the region since 1968. The lack of rainfall has led to an accumulation of salts, exceeding the tolerance levels of the mangroves. The die-off is particularly acute in the northern half of the Saloum River wetland complex (note the change in tone on the Landsat imagery, from dark red to dark gray). Today, there are vast areas of standing dead mangrove carcasses; many of these areas have been reduced to barren mud flats. The southern reaches of the wetland complex, however, still has healthy stands of mangrove forests. |
Coasts, Forests, Water | |||||||||||||||||||||||||||||||
| A History of Lava Flows at Hawaii’s Kilauea Volcano | Image of the Week | infrared, islands, lava, lava flows, volcanoes | New fissures opened up on Hawaii’s Big Island in… | New fissures opened up on Hawaii’s Big Island in early May 2018, spouting lava that destroyed homes in the Leilani Estates neighborhood. The new activity from the Pu’u ‘O’o Crater of the Kilauea volcano is a reminder that the volcano has been very active in recent decades. Landsat has been recording the lava flows on the Big Island since the latest eruption began in 1983. The most current image shown is from India’s Resourcesat-2 satellite, which spotted the lava flow in Leilani Estates despite the cloud cover. In these images, green vegetated land is repeatedly covered with dark lava flows, and infrared imaging shows bright orange spots where there is the most heat. Eruptions from the Pu’u ‘O’o Crater have a history of burying towns. The 1991 image shows a new lava flow extending toward the east along the coastline. This lava flow buried the entire community of Kalapana in 15–25 meters of lava in 1990. The narrower flow that extends to the northeast occurred between 2014 and 2016, and approached the community of Pahoa. The image series also shows how the coastline of the island has changed as various lava flows reached the ocean. Landsat and other Earth-observing satellites continue to monitor the rapidly changing landscape of the island. |
||||||||||||||||||||||||||||||||
| A Key Rest Stop for Birds | Earthshots | drought, migration, waterfowl | The Cheyenne Bottoms are on the North American… |
The Cheyenne Bottoms are on the North American Central Flyway, kind of a bird highway for migration. The vast, diverse marsh provides food and water for a multitude of migrating bird species during both spring and fall migrations. Most of Kansas is too dry for such a stopover, and reservoirs are too deep. Birds need shallow water and long shorelines. Summer 2022 had below normal precipitation statewide and above normal temperatures. No water was available from Wet Walnut Creek to divert into the Bottoms. By November 2022, the U.S. Drought Monitor showed that a third of Kansas was in exceptional drought. Landsat images from October 2021 and October 2022 show that birds had nothing to stop for in fall 2022. |
Water, Wetlands, Wildlife | |||||||||||||||||||||||||||||||
| A Lake Blushes in India | Image of the Week | algae, lakes | This summer in central India, a mystery in color… | This summer in central India, a mystery in color emerged. In the space of just days, the surface of Lonar Lake turned bright pink, then returned to green. As scientists study the cause of the event, other lakes around the world offer clues. Australia's salty Lake Hillier is filled with microscopic pink organisms, as well as algae that turn red when stressed to help absorb light. The same type of algae is prevalent in Senegal's Lake Retba, where red hues are clearest during the dry season. Lake Urmia in Iran turns red when water levels drop and salinity spikes. Similar salinity fluctuations have been observed in Lonar Lake. Maybe the lake will blush again, or maybe this was a one time event. Satellites like Landsat and Europe's Copernicus Sentinel-2 will be watching. |
||||||||||||||||||||||||||||||||
| A Landsat Mosaic for Indiana’s Bicentennial | Image of the Week | rivers, state mosaics | Throughout 2016, Indiana has been celebrating its… | Throughout 2016, Indiana has been celebrating its 200th anniversary of statehood. Joining the Union on December 11, 1816, as the 19th state, Indiana was the second state admitted from what was once known as the Northwest Territory. This satellite mosaic of the Hoosier State was created from several Landsat scenes stitched together to create one seamless image. Data from the National Elevation Dataset (NED) is also incorporated into the image. The names of major cities and county boundaries have been added. The Landsat images used for this mosaic were from summer months, so it shows the state at the height of the growing season. Since farmland makes up about 70% of the state’s land, much of the state appears green. By contrast, urban areas appear in shades of lavender. The large spot in the middle of the state marks the location of Indiana’s capital and largest city, Indianapolis. The Wabash River, the official state river, flows west across the northern part of the state and turns south to form part of the border with Illinois. Poster-sized images of all 50 states, plus Puerto Rico, are available for download at no charge at http://eros.usgs.gov/imagegallery/landsat-state-mosaics. |
||||||||||||||||||||||||||||||||
| A New Cutoff | Earthshots | cutoff, flooding, rain, rivers, weather | Floods are examples of short-term… |
Floods are examples of short-term environmental change. They cause substantial damage and change for only a short time, such as a couple of weeks. The damage done to crops can last for an entire growing season, but in most cases, the landscape goes back to normal after the floodwaters recede. In some cases, however, a flood can cause more lasting change. This flood changed the course of the Wabash River just above where it flows into the Ohio River. We have to go to a different Landsat image to see this happen, the one just south of the scene we’ve been examining. Images show a new cutoff that was formed from this flooding. About 2,200 acres of the land was rendered inaccessible by the new cutoff and shortened the river by about 7.5 miles. |
Natural-Disasters, Water | |||||||||||||||||||||||||||||||
| A New Iceberg at Brunt | Image of the Week | calving, chasm, ice, ice shelf, icebergs, rifts | An iceberg the size of Houston broke from the… | An iceberg the size of Houston broke from the Brunt Ice Shelf Antarctica on January 22nd, 2023. Landsat images show the area one day before the break and several days after. A feature named Chasm 1 had been lengthening for years, and it finally reached all the way across the shelf. Landsat will continue to track the new iceberg, named A-81, as it floats into the Weddell Sea. |
Glaciers | |||||||||||||||||||||||||||||||
| A New Yellowstone Hot Spot | Image of the Week | aerial photos, geothermal vents, geysers, hot springs, infrared, national parks, thermal features | More than 10,000 thermal features pepper the… | More than 10,000 thermal features pepper the landscape of Yellowstone National Park. Most of the hot springs, geothermal vents, and geysers are clustered around 120 distinct thermal areas. Scientists with the USGS Yellowstone Volcano Observatory use satellite and aerial imagery to map them as they expand and contract. They recently found an entirely new thermal area. It emerged quietly over 20 years, miles from the nearest trailhead but close to an existing hot zone. Landsat 8's thermal infrared sensors captured the change in a nighttime image from April of 2017. Heat signatures are clearest at night, when unheated ground is cool. Aerial images told more of the story. Forest covered the area in 1994, but the emergent thermal zone had begun to fry trees by 2006. Before long, the hot spot was unmistakable, with felled trees piled like toothpicks in a patch of land roughly the shape of a thumbprint. Scientists rely on both satellite and high-resolution airborne imagery archived with the Earth Resources Observation and Science (EROS) Center to monitor Yellowstone.
|
||||||||||||||||||||||||||||||||
| A Note on the Images | Earthshots | clouds, islands, Karman vortex street | The Landsat images that are shown on… |
The Landsat images that are shown on Earthshots are combinations of three different wavelengths of the electromagnetic spectrum. Typically, the images show a combination of visible and infrared light; therefore, they are false color images. When these wavelengths, or bands, are shown individually instead of combined, different details sometimes emerge. In the case of this Selkirk Karman vortex street scene, Landsat 7’s band 5 hints at a feature not visible in the image featured in the first section, which is a combination of bands 5, 4, and 3. Do you see it? Band 7 shows it even better. Northeast of the island, just east of the vortices, there is a bright spot and a bright plume trailing from it to the northeast. This may be a westbound ship, the effect of the ship’s exhaust shown in the clouds.
|
Coasts, Water | |||||||||||||||||||||||||||||||
| A Study in Algae | Earth As Art | algae, algal blooms, lakes | Algal blooms occur annually on Milford Lake in… | Algal blooms occur annually on Milford Lake in the summer and can be harmful to fragile wetland ecosystems. The USGS Kansas Water Science Center uses multispectral sensors on board drones to identify harmful algal blooms and study how they affect local businesses and human and animal health. |
||||||||||||||||||||||||||||||||
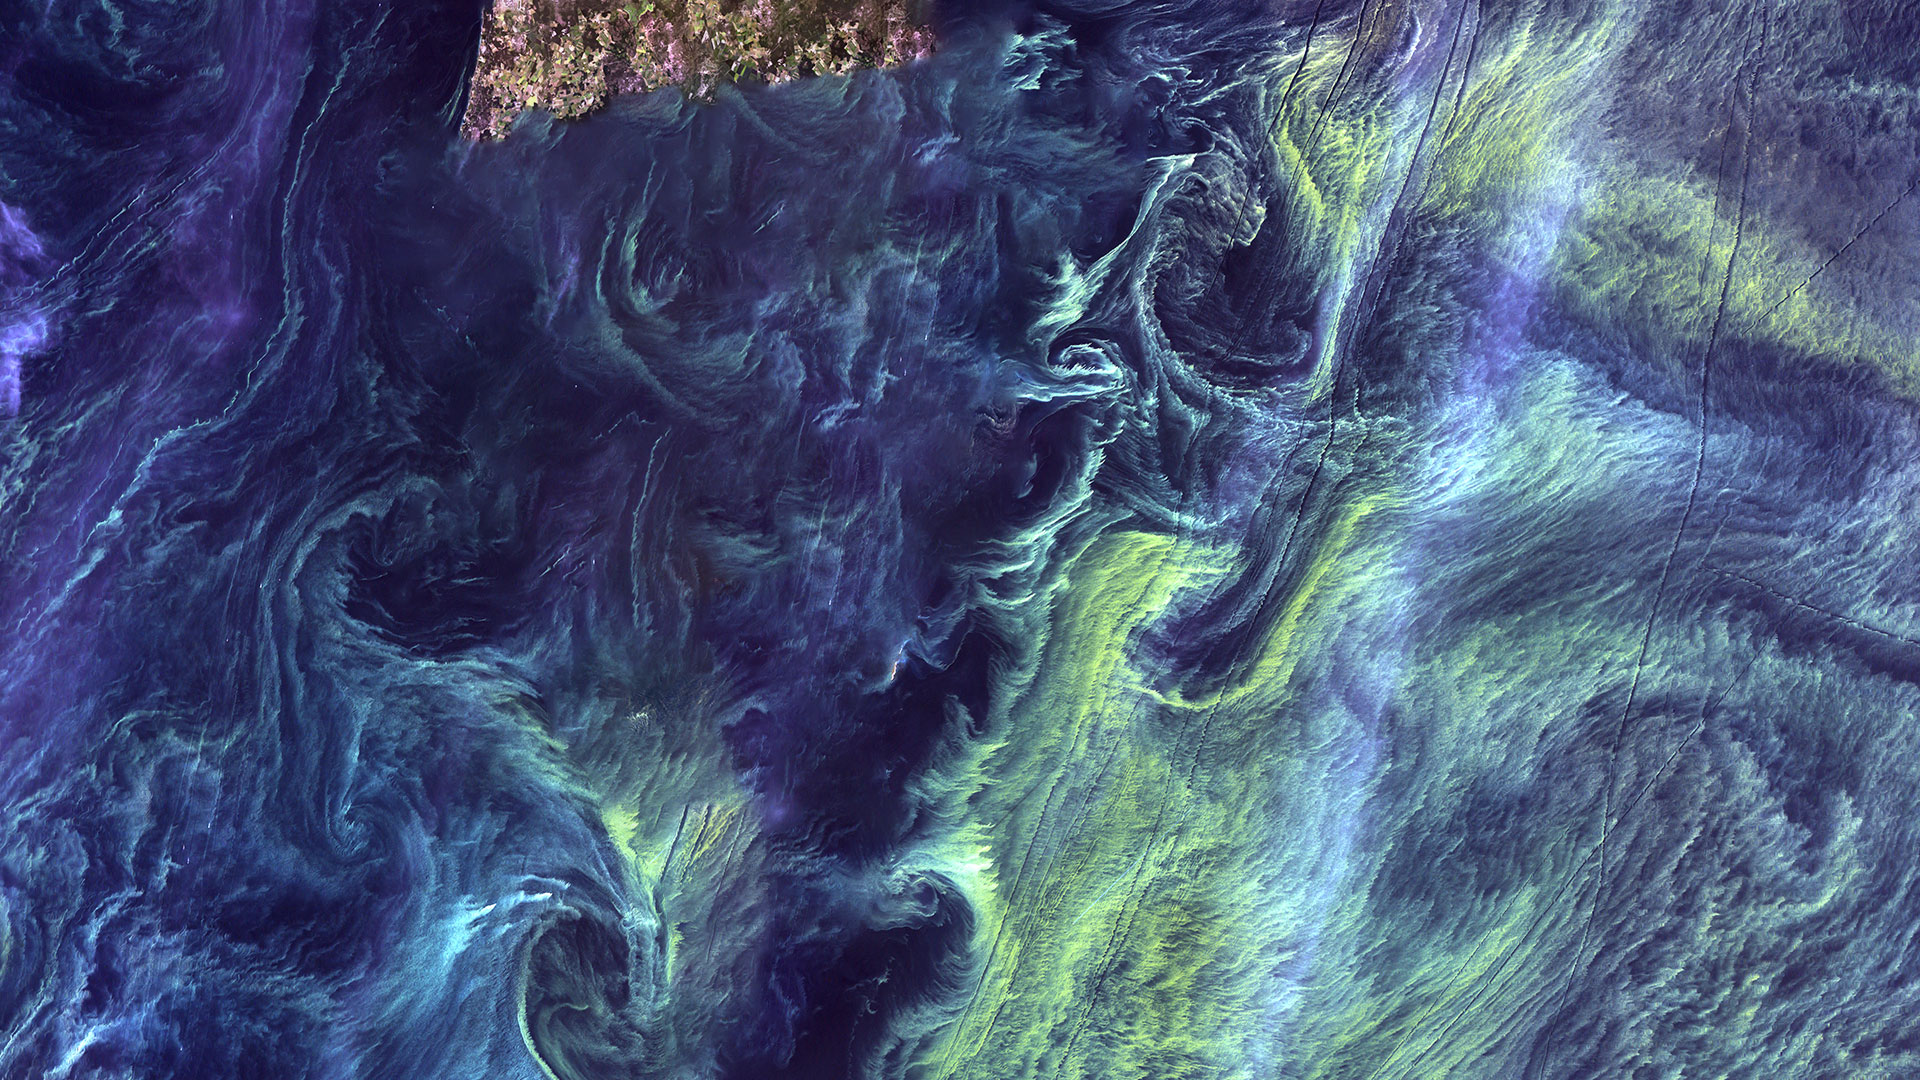
| A Study in Color | Earth As Art | refugee camps | The deep purple in the lower right spreads out… | The deep purple in the lower right spreads out into a few channels before fading into a multitude of colors. These channels are remnants of an ancient drainage network in Kenya. The beauty of the colors actually hides a stark reality for hundreds of thousands of people. The dark spots at the top center of the image are refugee camps. |
||||||||||||||||||||||||||||||||
| A Tear in the Mojave | Image of the Week | earthquakes | A series of powerful earthquakes tore and shifted… | A series of powerful earthquakes tore and shifted the sandy Earth of California’s Mojave Desert in early July. A magnitude 6.4 earthquake struck near Ridgecrest, California, on July 4, followed a day later by a 7.1-magnitude quake to the north. The second event created a surface rupture 30 miles long that cut through Naval Air Weapons Station China Lake, a 1-million-acre military installation. Sentinel-2B images show not only the rupture, but movement of the land itself. The ground west of the epicenter moves slightly northwest as the eastern side moves in the opposite direction. The pattern aligns with a radar analysis from NASA’s Jet Propulsion Laboratory estimating that each side of the fault had shifted two feet or more from its original position. a shift of two feet or more on either side of the fault line. Government and commercial satellite data will be used by the USGS and other agencies as they work to fully assess the impact of the California earthquake sequence. |
||||||||||||||||||||||||||||||||
| A Warm February in Northern Minnesota | Image of the Week | ice, lakes, winter | Like many lakes in northern Minnesota, Mille Lacs… | Like many lakes in northern Minnesota, Mille Lacs near Brainerd experienced an uncommonly warm winter this year, with lower than average snowfall. Mille Lacs is Minnesota’s second largest lake, and a popular tourism destination year-round. Typically in February, the lake is covered with plowed roads used by ice anglers and other adventurers. This year, winter activities were slow to start. The official "ice in" date was much later, and the "ice out" date much earlier. Natural color Landsat images from the past ten Februarys are shown here, revealing the stark change in 2024. February's average temperature of 28 degrees Fahrenheit was the highest of the past 10 years. Landsat's 50 year archive is just one of many important resources used by scientists around the world to study snow and ice trends like these. |
Water | |||||||||||||||||||||||||||||||
| A World of Hops | Image of the Week | hops, irrigation | In southern Germany, autumn is synonymous with… | In southern Germany, autumn is synonymous with beer. Around six million people visit the Bavarian city of Munich each year for Oktoberfest, a celebration of suds that coincides with the hops harvest. The world’s largest continuous hops-growing region by area is Hallertau, just north of Munich. More than 80 percent of Germany’s hops come from this 42,000-acre stretch of fertile loess soil. The fields of Hallertau appear in green and brown between deep green patches of forest in this Landsat 8 image from August of 2017. Hallertau might be the largest hops-growing region, but the largest producer is 5,200 miles away. The Yakima River Valley grows around 77 percent of the hops in the United States, which harvests more than any country in the world. Fields of green fan out along the Yakima River in this Landsat 8 image from July of 2018. The river provides irrigation for the semiarid region, which is also known for it’s vineyards and apple orchards. |
||||||||||||||||||||||||||||||||
| A-74 | Earthshots | calving, ice, ice shelf, icebergs, rifts, thermal | It soon became too dark to see A-… |
It soon became too dark to see A-74, which covered 1,270 km2, as the Antarctic winter set in. But Landsat 8 continued imaging with its Thermal Infrared Sensor (TIRS). The imagery is visibly dark, but TIRS detects temperature on the surface. TIRS shows relatively cooler temperatures darker than warmer temperatures, so the iceberg and ice shelf appear black. Clouds are relatively warmer than ice, so clouds sometimes cover the ice with swaths of gray. TIRS reveals what could not be seen in the darkness. The iceberg separates from the ice shelf, moves away, then bumps back into it before drifting south. In August 2021, in a timeframe of less than 2 weeks, the berg spun around the tip of Brunt Ice Shelf, brushed past it, rotated counterclockwise, and continued south. Landsat 8 spotted it with its visible bands in February 2022 much farther south along the Antarctic coast. It’s unknown exactly how the ice shelf will respond to the 2021 North Rift calving. The situation is being monitored closely by Landsat along with Sentinel, WorldView, ground-penetrating radar, drone imagery, and a network of GPS stations. |
Glaciers | |||||||||||||||||||||||||||||||
| Abandonment | Earthshots | accident, cooling pond, exclusion zone, lakes, nuclear power plant, nuclear reactor, radiation, river | Near the common borders of Ukraine,… |
Near the common borders of Ukraine, Belarus, and Russia, the Chernobyl Nuclear Power Plant lies near the Pripyat River at the northwestern end of a cooling pond. The pond is 12 km long; during normal operation the plant discharged warm water counterclockwise around the pond, taking in cool water near the north end. Just northwest of the plant is the city of Pripyat. The smaller town of Chernobyl lies south of the cooling pond. The 1986 and 1992 images clearly show farm abandonment. Agriculture appears as a collage of bright green (growing crops) and tan (highly reflective bare ground). Many of these areas appear a flat gray-green in 1992, indicating natural vegetation that has taken over the abandoned fields. The later images show that this land change persists. While the reactor was still on fire, all settlements within 30 km were evacuated, including Pripyat (1986 population 45,000), Chernobyl (1986 population 12,000), and 94 other villages (estimated total population 40,000). This area remains almost completely abandoned and is called the Chernobyl exclusion zone. The area is a mixture of former agriculture, forest, and marshland. It has been mostly free from human intervention since 1986. Radiation contamination later forced abandonment even outside the 30-km zone. High levels of cesium-137 detected years later caused further abandonment. In all, more than 120,000 people from 213 villages and cities were relocated outside contaminated areas. In 2011, the director of the Chernobyl power plant, Ihor Gramotkin, was asked when the area would again be inhabitable. He responded, “At least 20,000 years” (Harrell and Marson). |
Agriculture | |||||||||||||||||||||||||||||||
| About the Marshes | Earthshots | marshes, rivers | All of the water that keeps the Mesopotamian… |
All of the water that keeps the Mesopotamian Marshes alive comes from the Tigris and Euphrates rivers. Those rivers originate from precipitation in the Anatolian highlands of Turkey and the Zagros highlands of Iran, which occurs mostly in winter as snow. The snowmelt then provides—historically, at least—a flooding pulse downstream every spring. The land flattens out in southern Iraq, where the rivers slow and drop sediment, meander, and split into branches before flowing into the Persian Gulf. The Mesopotamian marshlands absorb the excess water and expand in the spring, then shrink in the summer. That’s the normal seasonal pattern. In the 1960s, the estimated spring extent of the marshes was 15,000–20,000 square kilometers. The vast marshland is vulnerable to drought and international conflict. |
Water, Wetlands | |||||||||||||||||||||||||||||||
| Accounting for the clouds | Image of the Week | cirrus, clouds | Clouds can be a real headache when it comes to… | Clouds can be a real headache when it comes to satellite imaging. Thin, almost transparent cirrus clouds are often difficult to spot, leaving scientists scratching their heads when data from pixels beneath them come out slightly skewed. |
||||||||||||||||||||||||||||||||
| Advocating for Landsat with Kass Green | Video - Landsat | |||||||||||||||||||||||||||||||||||
| Aerial Photos of an Image Archive | Image of the Week | aerial photos, EROS, NAIP | The home of the Landsat satellite archive is… | The home of the Landsat satellite archive is surrounded by corn and soybean fields. The archive is kept at the USGS Earth Resources Observation and Science Center (EROS) located near Sioux Falls, South Dakota. EROS is celebrating its 50th anniversary this year. The vast archive at EROS also includes aerial photography. A 1958 image shows the farmland before EROS was built. A 1976 photo shot during a flyover shows the center, entrance and exit roads, and a parking lot. A water tower and wastewater ponds supported the large amount of photo and film processing needed for the earliest remotely sensed imagery. A 1979 photo captured the clearing of land north of the building for the installation of a solar panel array, which heated water for photo processing. The project was completed the following year. In 1990, a second antenna was added in front of the building. It still functions today as backup reception for NOAA's weather satellites. The first antenna was Domsat, which received Landsat data directly from Goddard Space Flight Center. 1994 reveals the start of construction on the building addition, which was completed in 1996. The Domsat antenna has been removed. The next year, a 10-meter antenna was placed east of the building for reception of data from the upcoming Landsat 7. This photo, however, was taken shortly after baseball-sized hail damaged it. That storm also destroyed the solar panels. The antenna was replaced in time to receive data from Landsat 7. The addition of a radome makes it appear even more prominently in the 2002 photo. A 5.4 meter back up antenna was added a short time later. A 2022 image brings us up to date on the history of this half-section of land housing the USGS remotely sensed image archive that supports studies of land change over time. It can even take us back to the past for documenting change. |
Agriculture | |||||||||||||||||||||||||||||||
| Africa | Earth As Art | Africa, the second largest continent, is a mix of… | Africa, the second largest continent, is a mix of steamy rainforests, vast grasslands, and arid deserts. It has no long mountain ranges, but is home to the world's largest hot desert, the Sahara, and its longest river, the Nile. The featured area is the central South Atlantic coastal region of Namibia, including the cities of Walvis Bay and Windhoek. |
|||||||||||||||||||||||||||||||||
| After the Gulf War | Earthshots | canals, marshes, rivers | Large-scale draining of the marshes began in… |
Large-scale draining of the marshes began in earnest after the Gulf War of 1991. Water from the Tigris and Euphrates rivers was redirected to bypass the marshes. A west-east canal, 40 kilometers long and 1–2 kilometers wide, connected to the north-south Prosperity River, the prominent canal in the middle of these images. Even wider than the west-east canal, the Prosperity River is basically a massive moat that captures water from the rivers and tributaries and prevents it from flowing into the marshes. Throughout the 1990s, the marshes declined dramatically. The loss of vegetation and water is widespread and clear to see in the images. The extent of the marshland was reduced by about 85% by 2000. |
Water, Wetlands | |||||||||||||||||||||||||||||||
| Agno River Valley flooding, Philippines | Image of the Week | rivers, storms, typhoons, weather | The Agno River is located on the island of Luzon… | The Agno River is located on the island of Luzon and is the fifth largest river system in the Philippines. Over 2 million people live in the Agno River Valley. The first image was acquired by Landsat 8 in June 2013. The second image (Landsat 7) shows the November 2013 flooding caused by Typhoon Haiyan (Yolanda). The Landsat satellites collect imagery worldwide on a daily basis, and can help measure and monitor the landscape changes caused by devastating storms. |
||||||||||||||||||||||||||||||||
| Agricultural Land Use along the Chira River, Peru | Image of the Week | irrigation, reservoirs, rivers, water use | These two Landsat images show the expansion of… | These two Landsat images show the expansion of agricultural fields along the Chira River in northern Peru. The green of irrigated fields contrasts against the arid background of the land in this coastal region. The main crops in this region include rice, cotton, maize, mangoes, and lemons. The new agricultural areas in the second image (2014) are supported by irrigation from the Chira River and Poechos Reservoir in the upper right portion of the images. The reservoir and its system of dams were developed to generate electricity, control flooding, and support local irrigation needs. Landsat imagery is often used to monitor the status and changes of agricultural land use and water resources over time. |
||||||||||||||||||||||||||||||||
| Agriculture | Earthshots | irrigation | Irrigated agriculture in the valley,… |
Irrigated agriculture in the valley, shown by the red field patterns, has increased. This agriculture depends on rainfall captured in the mountains and channeled to the valley floor, as well as nearby rivers and drilled wells. |
Agriculture, Cities, Mountains | |||||||||||||||||||||||||||||||
| Agriculture | Earthshots | center-pivot, delta, irrigation, rivers | The area of vegetation just outside the delta… |
The area of vegetation just outside the delta northwest of Cairo is new agricultural development, with some of the crops irrigated through center-pivot irrigation. The most common crops grown are cotton, rice, corn, potatoes, oranges, and wheat. Although areas at a distance from the Nile often are not able to be irrigated, land that does support crops produces high yields and is harvested two or three times in many years. Food shortages have been documented for thousands of years in Egypt, and they can still cause problems. As the Egyptian population grows, producing enough food has become more difficult, so the government subsidizes food to make comfortable life possible. One staple food highly subsidized in Egypt is bread. The "bread riots" in 1977 and 2008 were the result of a reduction in those subsidies. Despite government regulation that keeps the production of non-food crops like cotton low, Egypt still imports much of its food, especially wheat. This can increase the price of food even higher. Dams being built on the Nile River and its tributaries upstream from Egypt could affect the amount of water making its way to Egypt. |
Agriculture, Cities, Deserts, Water | |||||||||||||||||||||||||||||||
| Agriculture | Earthshots | hydrology, lakes, national park | The fertile muck soils along the south shore… |
The fertile muck soils along the south shore of Lake Okeechobee in the Everglades Agricultural Area are intensively farmed. Tomatoes, beans, squash, peppers, and other crops are grown during the winter and shipped north. Sugarcane is the main crop there from spring through the fall. The bottom center of the later images reveals the location of Stormwater Treatment Area (STA) 3/4, one of six STAs mandated by the State of Florida’s Everglades Forever Act, passed in 1994. STA 3/4 is distinct from the polygons of the agricultural area. Just to its west is Holey Land Wildlife Management Area. These constructed wetlands are designed to remove phosphorus that comes from agricultural runoff. Under previous agricultural practices, phosphorus from fertilizers was allowed to run off into the Everglades. Phosphorus is an essential nutrient, but too much of it alters the Everglades’ natural habitats. These treatment areas channel runoff through shallow marshes filled with plants that absorb phosphorus, reducing the amount that flows into the Everglades. The plants include cattail, southern naiad, hydrilla, and algae. These plants continue to absorb phosphorus even after they die and decompose. The underlying limestone layer then holds the phosphorus, providing long-term storage. Besides helping to restore the Everglades, these treatment areas have become a great home for wading birds, ducks, and alligators. Florida offers hunting and other recreational opportunities at many of these treatment areas. |
Agriculture, Cities, Mining, Water, Wetlands | |||||||||||||||||||||||||||||||
| Agriculture Transforms Egyptian Desert | Image of the Week | irrigation, land conversion, water use | ||||||||||||||||||||||||||||||||||
| Agriculture's Changing Footprint - Brookings, SD | Image Comparison Sliders | aerial photos, livestock | ||||||||||||||||||||||||||||||||||
| Agriculture's Changing Footprint - Grant County, SD | Image Comparison Sliders | aerial photos, livestock | ||||||||||||||||||||||||||||||||||
| Aguascalientes, Mexico-Booming Growth | Image of the Week | urban growth | ||||||||||||||||||||||||||||||||||
| Akpatok Island | Earth As Art | ice floes, islands | Akpatok Island lies in Ungava Bay in northern… | Akpatok Island lies in Ungava Bay in northern Quebec, Canada. Accessible only by air, Akpatok Island rises out of the water as sheer cliffs that soar 500 to 800 feet (150 to 243m) above the sea surface. The island is an important sanctuary for cliff-nesting seabirds. Numerous ice floes around the island attract walrus and whales, making Akpatok a traditional hunting ground for native Inuit people. |
||||||||||||||||||||||||||||||||
| Al Farafra Oasis | Image of the Week | oasis | ||||||||||||||||||||||||||||||||||
| Al Kharj | Earthshots | center-pivot, irrigation | Southeast of Riyadh, irrigation has clearly… |
Southeast of Riyadh, irrigation has clearly increased over time, particularly around the city of Al Kharj. The red circles are fields with center-pivot irrigation systems, drawing water from Saudi Arabia’s aquifers. This irrigation development resulted from the investment of part of Saudi Arabia’s oil revenues in an effort to modernize agriculture. |
Cities, Deserts | |||||||||||||||||||||||||||||||
| Alabama | Shaded Relief | Shaded Relief Images of specific areas (generally… | Shaded Relief Images of specific areas (generally by state) have been selected from the National Elevation Dataset. For original data details, see NED. |
|||||||||||||||||||||||||||||||||
| Alabama | State Mosaics | Alabama is the only state in the country that… | Alabama is the only state in the country that contains all of the major natural resources needed to make iron and steel. It is also the largest supplier of cast-iron and steel pipe products. |
|||||||||||||||||||||||||||||||||
| Alaska | Earthshots | ice, resolution, sensors, snow | One of the factors that improves on Landsat… |
One of the factors that improves on Landsat sensors over the project’s history is the quality of the data. For example, compare these images of glaciers in Alaska’s Chitina River Valley from 1980. There is more background noise in an RBV image than there is in the MSS image. The RBV on Landsat 3 had a slightly higher spatial resolution, but the low signal-to-noise ratio makes it harder to pull out surface detail. The 2018 image from Landsat 8’s Operational Land Imager has even better signal-to-noise ratio and higher resolution than both early sensors. The image reveals more detail about the roughness and flow of the ice. Landsat 8’s shortwave infrared bands provide a better distinction between ice and rock or soil. High-quality data is needed in studying glaciers. Glaciers reflect visible light and appear bright white in natural color satellite images. But a glacier absorbs near-infrared light. The near-infrared and shortwave infrared imaging on later Landsats show the difference between snow and bare ground more clearly. However, glaciologists still found RBV useful for mapping arctic regions. In high latitudes, images acquired at low sun angles helped enhance local topographic relief. The high resolution of the RBV on Landsat 3 supplemented MSS imagery. In the RBV image of the Chitina River Valley, the brightest wavy streaks are glaciers. Note that they extend farther downstream in 1980 than they do in 2018. In the Landsat 8 image, wavy blue streaks indicate glaciers. They are generally in the same location as in the 1980 image, just diminished. While RBV might not be exactly what is needed or have the ideal attributes for a study or for mapping forests, glaciers, and other land covers, perhaps it’s one more tool to add to the collection in studying land change. It’s at least worth another look. Besides, as Faundeen said, “RBV is another interesting chapter in the Landsat story.” |
Glaciers, Mountains | |||||||||||||||||||||||||||||||
| Alaska | Shaded Relief | Shaded Relief Images of specific areas (generally… | Shaded Relief Images of specific areas (generally by state) have been selected from the National Elevation Dataset. For original data details, see NED. |
|||||||||||||||||||||||||||||||||
| Alaska | State Mosaics | Alaska has 17 of the 20 highest peaks in the… | Alaska has 17 of the 20 highest peaks in the United States. Denali is the highest peak in North America at 20,320 feet above sea level. Denali, the native name for the mountain, means “The Great One.” |
|||||||||||||||||||||||||||||||||
| Alaska Earthquake Anniversary | Image of the Week | aerial photos, earthquakes, landslides, tsunamis | When the Earth shook Alaska 52 years ago—on Good… | When the Earth shook Alaska 52 years ago—on Good Friday, March 27, 1964—tsunamis wiped out entire villages. Landslides swept Anchorage neighborhoods into Cook Inlet. A collision of tectonic plates comprising the planet’s outermost layer had caused a 9.2 magnitude earthquake, the largest in U.S. history, and killed 131 people. |
||||||||||||||||||||||||||||||||
| Aleutian Clouds | Earth As Art | clouds, islands | These cloud formations were seen over the western… | These cloud formations were seen over the western Aleutian Islands. Their color variations are probably due to differences in temperature and in the size of water droplets that make up the clouds. |
||||||||||||||||||||||||||||||||
| Algae Bloom in Lake Erie | Image of the Week | algae, algal blooms, lakes | Algae blooms commonly happen in summer on Lake… | Algae blooms commonly happen in summer on Lake Erie, but the blooms have been increasing in recent years. This year, north winds pushed the algae toward the water intake system for Toledo, Ohio, the urban area visible in the lower left of these Landsat 8 images. Certain types of freshwater algae produce a toxin that can be harmful to people. Whether harmful or not, algae blooms are often large enough to appear in satellite images. This Lake Erie bloom shows up as green swirls on the surface of the water in the August 1 image. The white spots above the land and water are clouds. The June 14 image is displayed for comparison. Scientists often use satellite imagery (such as Landsat) along with aerial imagery and water-based sensors to monitor the algae blooms each summer. The information helps them determine the type and distribution of the algae. Furthermore, comparing the annual extent of the blooms helps scientists monitor long-term trends and predict the impacts and movement of future algae bloom events. |
||||||||||||||||||||||||||||||||
| Algerian Abstract | Earth As Art | sand dunes | What look like pale yellow paint streaks slashing… | What look like pale yellow paint streaks slashing through a mosaic of mottled colors are ridges of wind-blown sand that make up Erg Iguidi, an area of ever-shifting sand dunes extending from Algeria into Mauritania in northwestern Africa. Erg Iguidi is one of several Saharan ergs, or sand seas, where individual dunes often surpass 500 meters-nearly a third of a mile-in both width and height. |
||||||||||||||||||||||||||||||||
| Algerian Sahara | Earth As Art | rain, sand dunes, streams | This abstract in browns and grays from central… | This abstract in browns and grays from central Algeria shows that some parts of Africa's Sahara Desert contain much more than dunes of wind-blown sand. Barren ridges and fragmented mountains (lower right) border a vast expanse of arid plains etched with a complex system of dry streambeds. The streambeds contain water for brief periods following rare, intense rains that often cause flash floods. |
||||||||||||||||||||||||||||||||
| Alluvial Fan | Earth As Art | A vast alluvial fan blossoms across the desolate… | A vast alluvial fan blossoms across the desolate landscape between the Kunlun and Altun mountain ranges that form the southern border of the Taklimakan Desert in China’s XinJiang Province. |
|||||||||||||||||||||||||||||||||
| An Aleutian Eruption, Day and Night | Image of the Week | eruption, infrared, shortwave infrared, volcanoes | The Shishaldin Volcano on the eastern edge of… | The Shishaldin Volcano on the eastern edge of Alaska’s Aleutian Island chain erupted with activity in January of 2020. The eruption on the island of Unimak sent an ash cloud five miles into the sky on January 7, forcing ash alerts for aviators, mariners and residents of nearby communities. Landsat 8 captured both day- and nighttime imagery of the event as it happened. The first image in this series shows the volcano in August of 2019, a period of relative calm after a series of low-level eruptions the previous month. A more explosive event began shortly after the new year. The island’s northern coast is just barely visible in the cloudy daytime image from January 7, but the satellite’s infrared and shortwave infrared bands capture the intensity of the Shishaldin’s eruptive heat as a flaming burst of red. The nighttime image collected hours earlier is even more stark. The satellite’s thermal and infrared sensors depict the crater’s heat signature as a colorful orb. Zooming in, the heat signature is apparent. Satellites such as Landsat are valuable tools to scientists studying volcanic activity from afar. |
||||||||||||||||||||||||||||||||
| An Early Spring via Satellite | Image of the Week | NDVI, phenology | The study of the Earth's natural life cycles is… | The study of the Earth's natural life cycles is known as phenology. Scientists track the emergence of shoots and leaves, blooming flowers and pollinators as phenological signals every spring. Spring has sprung earlier than usual in much of the United States this year. The USA National Phenology Network notes that much of the country has seen spring come 3 to 4 weeks faster than normal. Parts of the southeast have seen their earliest blooms in 39 years. Phenology is tracked by a network of observers but satellites like Landsat can also highlight the impact of an early spring. This area near the border of North and South Carolina is among those seeing its earliest leaf-outs and blooms on record. There's little difference between the 2020 and 2018 images in natural color, but Landsat's infrared and red bands can tease out the change through a greenness indicator called the Normalized Difference Vegetation Index, or NDVI. The early spring shines through clearly with NDVI. Areas with middling greenness in 2018 have brighter signals in 2020. Lakes, rivers, floodplains and marshes show the most vivid change. This image isolates the areas that saw higher NDVI. The green gradient represents healthier plant life, with the darkest areas showing the highest spikes. Most citizens can't run satellites, but they can contribute their observations to the Phenology Network. The non-profit group welcomes contributions from volunteers of nearly any age, through its Nature's Notebook program. |
||||||||||||||||||||||||||||||||
| An Introduction to Suomi-NPP NASA VIIRS DATA | Video - LP DAAC | |||||||||||||||||||||||||||||||||||
| An Introduction to the AppEEARS Area Sampler | Video - LP DAAC | |||||||||||||||||||||||||||||||||||
| An Introduction to the AppEEARS Point Sampler | Video - LP DAAC | |||||||||||||||||||||||||||||||||||
| An Overview of EROS | Video - EROS | |||||||||||||||||||||||||||||||||||
| An Unusual Mountain | Earthshots | volcanoes | Many of the world’s highest peaks are the… |
Many of the world’s highest peaks are the barely tallest points of high ranges, but Kilimanjaro stands alone, 15,000 feet above the surrounding plains. It actually has three peaks from three old volcanoes: Kibo (2), Mawenzi , and Shira. In these Landsat images, concentric rings show the vegetation zones around this unusual peak. The bare summit is surrounded by low grass and shrubs. These transition to a band of forest, protected as a reserve, which appears bright green. Below this is a densely populated agricultural area, appearing as speckled light green in the Landsat images. And at its base, the mountain turns dry again, supporting fewer plants and people. People have farmed the lower slopes for at least 2,000 years. In the last century, the mountain’s population has grown rapidly—about tenfold between 1910 and 2000. These people raised cattle, fruits and vegetables, and coffee. Prevented from migrating upslope by the forest/wildlife preserve, people have moved out into drier areas. |
Glaciers, Mountains | |||||||||||||||||||||||||||||||
| Anatomy of Landsat 8 | Video - Landsat | |||||||||||||||||||||||||||||||||||
| Andasol Solar Power Stations | Image of the Week | land conversion, solar panels, solar power | ||||||||||||||||||||||||||||||||||
| Andes | Earth As Art | salt pans, volcanoes | Vivid colors belie the arid landscape of northern… | Vivid colors belie the arid landscape of northern Chile where the Atacama Desert, one of the world's driest, meets the foothills of the Andes. Here salt pans and gorges choked with mineral-streaked sediments give way to white-capped volcanoes. |
||||||||||||||||||||||||||||||||
| Animation | Earthshots | logging, rain forest | Play this … |
Play this animation to see the change in this area happen from 1975 to 2017. The animation uses a Landsat image from most of the years in this time period to demonstrate the rapid rate of deforestation. Huge areas of Rondônia's dense rain forest transform to cleared areas in only a few decades. Unseen in these images are the effects of the deforestation on wildlife habitats and local and global climate. |
Deforestation, Forests | |||||||||||||||||||||||||||||||
| Animations | Earthshots | coal, oil, open pits, overburden, reclamation | The coal mines in the PRB advance quickly… |
The coal mines in the PRB advance quickly enough to see a lot of change from year to year. Two animations available here show the annual change of the mines in the regions. The first animation shows almost one image per year back to 1984 of both the Black Thunder and North Antelope Rochelle Complex Mines. The second one listed is a close-up of the North Antelope Rochelle Complex and covers the same time period. The date of each image appears in the lower right corner. |
Energy, Mining | |||||||||||||||||||||||||||||||
| Annual Change | Earthshots | floodplain, floods, lakes, river | In the flooded season, this part of Mali’s… |
In the flooded season, this part of Mali’s landscape stands out as bright green against the arid brown African Sahel. The Niger River and the Inland Delta have been an important water supply in the southern Sahara for thousands of years. The river channels, lakes, swamps, and floodplains provide the main livelihoods in the delta: livestock, fishing, and farming. The delta is also a refuge for many migrating birds. After rice farming and livestock, fishing is the most important industry of the delta. The catch varies from year to year depending on water levels. An overall decrease in available water in the delta directly affects the population in this industry. This series of images shows that the extent of the seasonal flood can vary. For example, 1984 was a low flood year, and the green extent in the image is smaller than it is for 1999. Another low water year was 2011. Exceptionally high floods can damage habitats and irrigation, but extremely low flows like those in 1984 can be disastrous. The loss of livestock caused by the lack of water one year can have long-lasting effects. Two main threats to the region are inadequate water management and climate change. With growing water use and a predicted decrease in rain in the Sahel, the river flow of the Niger is expected to decline. The livelihoods of the delta’s people could be at risk. Diverting upstream water for irrigation means less water for the delta. For example, the Fomi Dam in Guinea is being planned. The two countries are working on assessing the possible risks and benefits of the dam. (Black stripes run through the 2011 image because of the Scan Line Corrector failure on Landsat 7 in May 2003.) |
Water, Wetlands | |||||||||||||||||||||||||||||||
| Antarctica's Blue Ice | Image of the Week | ice, snow | Antarctica’s interior is circled by glacial ice… | Antarctica’s interior is circled by glacial ice flows that move outward from the frozen continent’s surface. Imagery collected over Antarctica by satellites like Landsat is typically marked by highly reflective snow and ice, but isolated pockets of wind-swept glacial ice glow with a distinct blue. This stunning Landsat 8 image was acquired on February 18, 2018. It shows the Queen Fabiola Mountains, a 50-kilometer range that slows glacial movement and pushes stagnant blue ice to the surface. Swirling, textured turquoise surrounds the peaks and snow that remain during the Antarctic summer. Blue ice forms when air bubbles are squeezed out of compressed snow and firn layers, which are layers of partially-compacted snow left over from previous seasons. The ice appears blue as a result of the absorption of solar radiation at yellow and red wavelengths. Deeply penetrating light is uniformly scattered at blue wavelengths by the enclosed air bubbles. Blue ice areas are also noteworthy for their role in preserving fallen meteorites. Over time, the ice has trapped and preserved asteroid fragments, and scientists frequently scour these areas to collect them. |
||||||||||||||||||||||||||||||||
| Antarctica's Newest Island | Image of the Week | islands | Antarctica has been the source for a host of… | Antarctica has been the source for a host of fascinating satellite imagery in recent months. We've offered scenes from the southern solstice, images of icebergs adrift, and shots of pooling meltwater during some of the warmest days on record for the frozen continent. An international team of scientists onboard a U.S. research vessel recently made another discovery related to polar warming trends. An uncharted island. Landsat, as it turns out, had been watching the island for years. It emerged slowly from a stretch of coast between the Thwaites and Pine Island glaciers in West Antarctica. Landsat imagery shows it fully detached in 2014. At its widest, the granite outpost measures less than 400m across. In February, the crew of the Thwaites Glacier Offshore Research Project, or THOR for short, became the first humans to see the island for what it was. The crew dubbed it Sif Island, after a Norse goddess of Earth and wife to Thor.
|
||||||||||||||||||||||||||||||||
| Antarctica’s Summer Solstice | Image of the Week | equinox, sea ice, solstice | It’s winter in the Northern Hemisphere. But in… | It’s winter in the Northern Hemisphere. But in Antarctica, summer has just begun. The summer solstice occurred at Zucchelli Station on December 22, 2019, at 5:19 p.m. local time. The high temperature that day was a balmy 34 degrees Fahrenheit. These images from Landsat 8 show the distinct difference in sun angles caused by the change in seasons. The September image is from close to the equinox. Shadows are longer, causing the scene to be darker overall while revealing the ruggedness of the mountains. The December image is brighter, with shorter shadows and much less sea ice. Landsat images are useful for monitoring changes to sea ice and glaciers on the frozen continent, at least during summertime in the Southern Hemisphere. |
||||||||||||||||||||||||||||||||
| Antelope Valley, California, USA | Earthshots | population, solar, solar energy, solar panels, solar power, urban growth, wind, wind power, wind turbines | Antelope Valley in southern California is the… |
Antelope Valley in southern California is the western part of the Mojave Desert. The San Gabriel Mountains and the Tehachapi Mountains give the valley a triangular shape. The southern edge of the valley is the San Andreas Fault. While farming is going on in the valley in the more traditional sense, with irrigated fields showing up as bright green circles or rectangles in these Landsat images, farming of a different kind is also going on. With average annual wind speeds of 14 to 20 miles per hour and plenty of clear, sunny days, this part of the desert is on the cutting edge of wind and solar power. (The small burn scar seen in the 2023 image is the Danny Fire, which burned almost 1,600 acres.)
|
Cities, Energy | |||||||||||||||||||||||||||||||
| Anyuyskiy Volcano | Earth As Art | lava, rivers, volcanoes | The prominent crimson streak in the center of… | The prominent crimson streak in the center of this image represents the remains of an extensive lava and mud flow. Its source is the currently dormant Anyuyskiy Volcano orange circular shape at the right end of the streak) in northeastern Russia. Remote and largely inaccessible, the region is a rugged collection of towering volcanic peaks, steep valleys, and wild, snow-fed rivers and streams. |
||||||||||||||||||||||||||||||||
| Aquaculture | Earthshots | alluvial, carbon, delta, flooding, floodplain, mangrove, salt water, shrimp ponds | Mangroves in the Ayeyarwady Delta are also… |
Mangroves in the Ayeyarwady Delta are also being replaced by aquaculture. In the southwestern part of the delta, brackish shrimp pond development is expanding. The dark blue shapes in the images represent the shrimp ponds. Not as much land is being taken up by aquaculture, but this industry is growing. While some mangroves have been restored on the delta, the aquaculture, agriculture, and cutting activities need to be monitored so that the benefits of mangroves can be maintained. Researchers continue to use Landsat and other remote sensing information to monitor this region. |
Aquaculture, Coasts, Deforestation, Forests | |||||||||||||||||||||||||||||||
| Aquaculture Changes Mexican Shoreline | Image of the Week | land conversion, shrimp farms | ||||||||||||||||||||||||||||||||||
| Araca River | Earth As Art | rivers | Brazil's Araca River is a tributary of the Negro… | Brazil's Araca River is a tributary of the Negro River, which feeds into the Amazon. |
||||||||||||||||||||||||||||||||
| Aral Sea | Image of the Week | irrigation, lakes, rivers, water use | ||||||||||||||||||||||||||||||||||
| Aral Sea, Kazakhstan and Uzbekistan | Earthshots | canals, declassified, fishing, irrigation, islands, lakes, rivers, saltwater, seas, water use | We see a lot of change with 50 years of… |
We see a lot of change with 50 years of Landsat imagery, along with the declassified satellite imagery in the archives at EROS. The drying of the Aral Sea is likely the most dramatic change occurring over the past several decades in this imagery. The Aral Sea once covered about 68,000 square kilometers, a little bigger than the U.S. state of West Virginia. It was the 4th largest lake in the world. It is now only about 10% of the size it was in 1960. Coastlines receded several kilometers from what were once coastal communities. The Aral Sea is a terminal lake. Large permanent snow fields and glaciers in mountain ranges feed the two major rivers that flow into it, but it has no outlet. Syr Darya flows into the northern part of the Aral Sea. Amu Darya flows into the southern part. (Darya means river in the Turkic languages of central Asia.) The precipitation rate over the Aral Sea is very low, less than 200 millimeters per year. However, 1,000–1,200 millimeters of water evaporates from the sea each year. Therefore, stability of the water level greatly depends on inflow from these two rivers, which has diminished over the past few decades leading to the shrinking of the lake. The sea has in fact split into two separate bodies of water, referred to as the North Aral Sea and the South Aral Sea. The North Aral has stabilized but the South Aral has continued to shrink and become saltier. Up until the 1960s, Aral Sea salinity was around 10 grams per liter, less than one-third the salinity of the ocean. The salinity level now exceeds 100 grams per liter in the South Aral, which is about three times saltier than the ocean. The effects of this dramatic change are far-reaching, geographically, environmentally, and economically. The subsequent sections describe how a body of water this size could nearly disappear so quickly. |
Agriculture, Dams, Water | |||||||||||||||||||||||||||||||
| Aralsk | Earthshots | declassified, fishing, lakes, rivers, saltwater, seas, water use | The city of Aralsk is shown in the 1964 ARGON… |
The city of Aralsk is shown in the 1964 ARGON image on the coast of the sea. By 1977, the sea had retreated from the city but was still just a few kilometers away. As depicted in the 2015 image, Aralsk sits nearly 20 km from the water’s edge. Commercial fishing in the Aral Sea peaked in the late 1950s. With the drop in water levels and rise in salinity, the fish that once thrived in the sea could not survive. As a result, commercial fishing was no longer sustainable by the early 1980s. With the recovery of the North Aral, commercial fishing has started up again. It’s still just a fraction of what it was in the 1950s, but Aralsk is again processing fish at a new plant, established after the completion of the Kok-Aral Dam in 2005. Aralsk is not the thriving city it once was, but the return of the North Aral gives residents some hope of recovery. |
Agriculture, Dams, Water | |||||||||||||||||||||||||||||||
| Arcadia Lake, Oklahoma | Image of the Week | lakes, reservoirs, water use | ||||||||||||||||||||||||||||||||||
| Argentina Flooding Has Major Impact on Soybean Production | Image of the Week | flooding, floods, rain, weather | Heavy rains in late December 2016 and early… | Heavy rains in late December 2016 and early January 2017 are affecting soybean production in Argentina’s bread-basket provinces while impacting soy prices worldwide. |
||||||||||||||||||||||||||||||||
| Ariquemes | Earthshots | logging, rain forest | The early images show main roads cutting… |
The early images show main roads cutting through the forest. Highway 421 snakes through the forest south-southwest from the city of Ariquemes, and Highway 364 runs roughly north to south through Ariquemes. More roads branch out from the main ones to create the fishbone pattern. As time goes on, a patchwork of cleared areas, forest remnants, and settlements is left behind. |
Deforestation, Forests | |||||||||||||||||||||||||||||||
| Arizona | Shaded Relief | Shaded Relief Images of specific areas (generally… | Shaded Relief Images of specific areas (generally by state) have been selected from the National Elevation Dataset. For original data details, see NED. |
|||||||||||||||||||||||||||||||||
| Arizona | State Mosaics | Arizona is blessed with many natural wonders… | Arizona is blessed with many natural wonders including the Grand Canyon, Lake Powell/Rainbow Bridge, Petrified Forest/Painted Desert, Monument Valley, Meteor Crater, and Superstition Mountain. |
|||||||||||||||||||||||||||||||||
| Arizona Fire | Image of the Week | |||||||||||||||||||||||||||||||||||
| Arkansas | Shaded Relief | Shaded Relief Images of specific areas (generally… | Shaded Relief Images of specific areas (generally by state) have been selected from the National Elevation Dataset. For original data details, see NED. |
|||||||||||||||||||||||||||||||||
| Arkansas | State Mosaics | Arkansas, officially “The Natural State,” is a… | Arkansas, officially “The Natural State,” is a state of mountains, valleys, dense woodland and fertile plains. Its clear lakes and streams and abundant wildlife help to make tourism one of the state’s most important industries. |
|||||||||||||||||||||||||||||||||
| Arlington National Cemetery | Image of the Week | aerial photos, cemeteries | ||||||||||||||||||||||||||||||||||
| Artificial Holes | Earthshots | limestone, phosphate, reclamation | The bodies of water further south, east of… |
The bodies of water further south, east of Tampa, look completely different, because they have a much more human origin: phosphate mining. South of Orlando lies the world's most productive source of phosphate, a critical nutrient for modern agriculture. In these images, plants look red and phosphate mines appear as a bright, high-contrast mix of white bare earth and blue-black ponds. The images show the phosphate region expanding, as more lands were put through the cycle of mining and reclamation. Under just the right conditions, some ocean sediments (like those forming limestone) become rich in phosphorus. Ideally, an upwelling of cold, phosphorus-rich water to the shallow waters near shore stimulates all forms of sea life, from algae to animals. Their shells and bones, plus crystals of phosphorus, concentrate phosphorus on the ocean floor. Moving water—tides and currents underwater, streams and floods above sea level—sorts the heavy phosphate pebbles from the lighter sands, further concentrating the valuable nutrient. |
Cities, Mining | |||||||||||||||||||||||||||||||
| As Glaciers Worldwide Are Retreating, One Defies the Trend | Image of the Week | lakes | Many glaciers around the world are losing ice… | Many glaciers around the world are losing ice mass and retreating. One such area is the Southern Patagonia Icefield (SPI) in Chile. However, one glacier in the SPI is actually defying the worldwide trend. The Pio XI Glacier is advancing, and based on scientific studies, there is no clear reason why. Pio XI flows from the SPI toward the west then splits into two fronts. From 1998 to 2014, the southern front advanced 593 meters. The northern front, which flows into Lake Greve, advanced 107 meters in the same time period. This pair of Landsat images shows that all of the other glaciers that flow down from the SPI into Lake Greve are retreating. The complex behavior of glaciers involves more than just measuring where the ice ends. Scientists theorize that something is happening inside or beneath Pio XI to make it advance, rather than an external factor like climate. The glacier flows from a wide accumulation area into a narrow outlet, and the depth of the lakes it flows into, along with the speed of the glacier’s flow, may also be factors. Whatever the cause, glaciers continue to be closely monitored, and in the remote region of the SPI, that monitoring needs to be done with remote sensing. Landsat offers several observations per year in these areas and will help scientists understand the glacier’s future behavior. |
||||||||||||||||||||||||||||||||
| Assessing Global Impact | Video - Landsat | |||||||||||||||||||||||||||||||||||
| ASTER - Monitoring Volcanoes | Video - LP DAAC | |||||||||||||||||||||||||||||||||||
| Atchafalaya Delta, Louisiana, USA | Earthshots | canals, deltas, marshes, rivers, sea level rise, sediment | The Mississippi River Delta region… |
The Mississippi River Delta region in southern Louisiana is losing land to sea level rise, subsidence, and hurricane damage. The mouth of the Atchafalaya River, a distributary of the Mississippi River, is an exception. It has been building two deltas for the past several decades. The Atchafalaya Delta exemplifies the importance of freshwater and sediment to maintaining and even building land in the delta region. The Atchafalaya River branches away from the Mississippi River where the Red River joins it. The Atchafalaya takes about 30% of the combined flow of both rivers and carries the water and sediment south. Just east of the Atchafalaya basin, land is rapidly disappearing from the Louisiana coast. Besides subsidence, sea level rise, and hurricanes, a lack of sediment input from the Mississippi River is also causing land loss, making the region more vulnerable to storms. Besides the risk to wildlife habitats, coastal Louisiana supports more than 30% of the commercial fisheries in the United States, and five of the country’s top 20 ports are located there. Furthermore, in 2017, the USGS reported that a fifth of the country’s oil and gas is transported through the southern Louisiana wetlands. The time series of Landsat imagery shows that the deltas do not progressively extend into the Gulf. They are affected by local conditions like tides and the timing of hurricanes and floods. So while the overall trend is extension and delta building, the deltas seem to temporarily contract at times. In the Landsat images, water is dark blue, and vegetation is green. |
Coasts, Water, Wetlands | |||||||||||||||||||||||||||||||
| Athabasca Oil Sands, Alberta, Canada | Earthshots | bitumen, boreal forest, fire scars, near-infrared, oil, oil sands, open pits, overburden, reclamation, shortwave infrared, tailings ponds, well pads | One of the world’s largest reserves of oil… |
One of the world’s largest reserves of oil sits under the boreal forest of northwestern Alberta, Canada. The deposit covers about 142,200 square kilometers (54,900 square miles), an area a little larger than the U.S. state of Wisconsin. Known as the oil sands region, it accounts for the largest segment of Alberta’s economy. According to Alberta Energy, proven reserves in the oil sands in 2016 were 165.4 billion barrels. This series of imagery focuses on the largest of the three oil sands areas in Alberta, the Athabasca region. Located just north of Fort McMurray along the Athabasca River, the mining of the Athabasca region has grown dramatically over the last three decades. |
Fires, Forests, Mining, Natural-Disasters | |||||||||||||||||||||||||||||||
| Atlas Mountains | Earth As Art | These are the Anti-Atlas Mountains, part of the… | These are the Anti-Atlas Mountains, part of the Atlas Mountain range in southern Morocco, Africa. The region contains some of the world's largest and most diverse mineral resources, most of which are still untouched. |
|||||||||||||||||||||||||||||||||
| Auckland, New Zealand | Image of the Week | harbors, islands | Auckland is on the North Island of New Zealand… | Auckland is on the North Island of New Zealand along the Hauraki Gulf. The urban area (purple hues) can be seen on the left side of this image. The round island north of the city that appears darker than the others is a volcanic island (Rangitoto Island) within the Auckland volcanic field. |
||||||||||||||||||||||||||||||||
| Australia | Earth As Art | lakes, rivers | Australia is the smallest, and flattest, of all… | Australia is the smallest, and flattest, of all the continents. Its surface details are largely the result of erosion. Many rivers drain into the continent's harsh, arid interior, where they terminate in salt lakes that are dry for most of the year. Australia's coastal regions, however, are famous for astounding biodiversity, from the Great Barrier Reef in the northeast to Shark Bay in the west. |
||||||||||||||||||||||||||||||||
| Australian Iron Ore | Earth As Art | near-infrared, rock, shortwave infrared | Within the Hamersley Iron Province in Western… | Within the Hamersley Iron Province in Western Australia, Landsat's shortwave infrared and near-infrared detectors highlight different types of rock. The oval in the upper center part of the image is a geological feature called Rocklea Dome. The dark meanders within the dome are channel iron deposits. |
||||||||||||||||||||||||||||||||
| Ayeyarwady Delta, Myanmar | Earthshots | alluvial, carbon, delta, flooding, floodplain, mangrove, salt water, shrimp ponds | The Ayeyarwady Delta—also called the Irrawaddy… |
The Ayeyarwady Delta—also called the Irrawaddy Delta—is a vast alluvial floodplain. The delta spans over 35,000 km2 (13,500 mi2) and was once home to an extensive tract of mangrove forests, but deforestation has changed the landscape. One scientific study estimated that the delta lost 1,685 km2 (651 mi2) from 1978 to 2011. This 50-year sequence of Landsat images shows the relatively rapid loss of mangrove forest. |
Coasts, Deforestation, Forests | |||||||||||||||||||||||||||||||
| Baghdad, Iraq April 2003 | Image of the Week | bombs, smoke | ||||||||||||||||||||||||||||||||||
| Bahr al Milh | Image of the Week | canals, lakes, saltwater | ||||||||||||||||||||||||||||||||||
| Bahrain | Earthshots | airport, artificial islands, islands, land creation, land reclamation, marina, population, port, tourism, urban growth | The most noticeable land change in these… |
The most noticeable land change in these Landsat images is simply the addition of land itself. In Bahrain, a nation of 36 islands in the Middle East, the sea is shallow enough along the northern and eastern coast to make the addition of land relatively inexpensive. The main Bahrain Island is about 990 square kilometers; however, it took less than two decades for the coastal zone of Bahrain to increase by about 40 square kilometers. All of this added land is dredged from the seabed in massive land reclamation projects. Besides the large land additions, an obvious increase in urban areas dominates the images. Bahrain’s 1970 population was 213,000; in 2014 it was estimated to be 1,316,000. The country’s urban extent doubled between 1987 and 2013. |
Cities, Coasts, Deserts | |||||||||||||||||||||||||||||||
| Bakken Oil Boom, North Dakota, USA | Earthshots | airport, drilling, fracking, highways, natural gas, oil, oil platforms, well pads | Even though oil is underground, Landsat images… |
Even though oil is underground, Landsat images can reveal related land changes on the surface. The Bakken oil boom has made North Dakota the second leading oil producing state—behind only Texas. Evidence of this boom is apparent on the landscape. The focus of this oil boom, which began around 2008, is on the Bakken formation of western North Dakota, northeastern Montana, and part of Canada. The Bakken formation constitutes one of the largest deposits of oil and natural gas in the United States. The Bakken is part of the larger Williston Basin, which, according to a 2013 USGS study, has 7.4 billion barrels of oil that is recoverable using today’s technology. These Landsat images show the increasing number of oil platforms over just a few years, along with associated infrastructure changes. The overview images in this introductory section show the entire region that will be discussed in more detail in the following subsections. The North Dakota oil industry took off in the 1950s. When oil prices dropped in the 1980s, that boom ended. Oil prices recovered by 1990, but the current boom didn’t hit until the technology of hydraulic fracturing, or fracking, came along in the 2000s. By 2008, drilling in North Dakota surged like never before and oil production increased dramatically. The oil and natural gas within the Bakken are locked in a rock formation. Fracking uses a mix of water, salt, chemicals, and sand to fracture the rock. The fractured rock allows the oil to flow to the well. The price of oil crashed again in 2014, halting most of the drilling. But this was only after North Dakota’s oil industry reached the milestone of producing 1 million barrels per day. In mid-2017, oil prices recovered to around $50 a barrel, stabilizing the situation in North Dakota. |
Cities, Mining | |||||||||||||||||||||||||||||||
| Banda Aceh - Tsunami Before and After | Image of the Week | earthquakes, tsunamis | ||||||||||||||||||||||||||||||||||
| Bangong Lake, Himalayas (Asia) | Image of the Week | lakes | The large Landsat 8 image shows the full extent… | The large Landsat 8 image shows the full extent of Bangong Lake, which means “long neck swan” in Tibetan. It is located partly in China and partly in the region of Kashmir that is controlled by India. The lake is approximately 155 kilometers (96.3 miles) long from east to west. It reaches only 5 meters (16 feet) wide at its narrowest point. This lake is unique in that the eastern portion has fresh water, while the waters to the west are saline. The two smaller Landsat images show the easternmost portion of Bangong Lake. Changes to the local shoreline can be seen by comparing the two images, acquired in 1998 and 2013. During this time period, changing conditions have expanded the lake area, particularly along the marshy southwest and northern shorelines. These shoreline changes can affect the local salinity levels, which in turn may affect the vegetation and biological balance of the area. The 40-year archive of Landsat imagery is useful in documenting change to the Earth’s landscape. |
||||||||||||||||||||||||||||||||
| Barreal Blanco | Earth As Art | lakebeds, rivers | San Juan, Argentina, nestles in a fertile valley… | San Juan, Argentina, nestles in a fertile valley flanked by arid mountains. Croplands and vineyards (green) abut the metropolitan area on the San Juan River. The white "teardrop" (lower left) is an ancient lakebed called Barreal Blanco. It is one of the best places in the world for carrovelismo, or landsailing, thanks to the steady winds that sweep across this flat, unobstructed expanse of hard-packed sediment. |
||||||||||||||||||||||||||||||||
| Bastrop County Complex Fire | Image of the Week | burn scars, drought | ||||||||||||||||||||||||||||||||||
| Batagaika Crater and the Megaslump | Image of the Week | craters, permafrost | An increasingly large gash has opened up in… | An increasingly large gash has opened up in northern Russia’s Siberian tundra. During the past few decades, warmer summers and shorter winters have caused permafrost in this region to thaw, which then allows the warmed soils on slopes to slump and erode. Dozens of the resultant channels and craters are spread across Siberia, but the biggest is Batagaika Crater, about 10 kilometers southeast of the town of Batagay. The Landsat image series shows the initial gash widening from a narrow channel in 1991 to a crater with steep-sided cliffs by 2017, at a resolution of 30 meters. Sentinel-2A’s 10-meter resolution in the natural color bands provides a more detailed look at the crater. This so-called “megaslump” is being enlarged on a hillslope that leads down to the floodplain of the Batagay River. As the active soil slumps, more of the surrounding and underlying frozen soil is exposed and melts, causing the land to slump further and the extent and speed of the permafrost thawing to increase. Based on satellite image records, the crater is expanding by more than 10 meters per year. The crater is now about 800 meters wide and up to 86 meters deep. It has exposed older frozen soil horizons that represent a history of environmental changes that span more than 50,000 years. The Landsat and Sentinel missions help track the changes to the crater as scientists study the permafrost and the environmental history now exposed. |
||||||||||||||||||||||||||||||||
| Batagaika Crater, Russia | Earthshots | crater, declassified, erosion, permafrost | Sometimes described as resembling a stingray… |
Sometimes described as resembling a stingray or a tadpole, the Batagaika Crater is a widening chasm in Siberia and the world’s largest permafrost crater. Multiple satellites have recorded the crater’s growth, from declassified satellite imagery collected in the 1960s to current multispectral sensor images from Landsat and Europe’s Copernicus Sentinel-2 satellite, to build a continuous view over the last 60 years. Each exposed layer of the crater wall is like a snapshot in time, helping scientists understand the past climate. Layers of permafrost exposed at the bottom might be up to 650,000 years old. Scientists have also discovered mummified wildlife in the crater. In 2018, the remains of a 42,000-year-old foal of an extinct horse species were found. Why this matters |
Forests | |||||||||||||||||||||||||||||||
| Bathtub Ring | Earthshots | lakes, reservoirs | Comparing the 1984 (high water level) and 2005… |
Comparing the 1984 (high water level) and 2005 (low water level) images, there is a pale outline along many parts of the lake. When the water level drops, canyon walls that were once inundated are exposed again. Referred to as the “bathtub ring,” this pale outline shows when the lake is below capacity. Calcium carbonate and other mineral compounds, many of them various salts in the water, attach themselves to the sandstone and leave behind this white mark. The top of the white mark is the high water mark. The only time the bathtub ring is not visible is when the lake is completely full. |
Dams, Water | |||||||||||||||||||||||||||||||
| Bear Glacier Lagoon | Earthshots | ice, icebergs, lagoon, moraines, snow | Before 1950, the entire basin was covered by… |
Before 1950, the entire basin was covered by Bear Glacier and ended at a terminal moraine. By 1961, a small lake had formed, referred to as Bear Glacier Lagoon. By 1984, the size of the lagoon had doubled. It has continued to grow quickly as the glacier has retreated over time. People can now go kayaking among the icebergs on Bear Glacier Lagoon. In August 2014, water from Bear Glacier Lagoon breached the moraine that separates the lagoon from Resurrection Bay. Lake levels dropped by 1–2 feet (0.3–0.6 meters). These glacier lake outburst floods occur regularly. The breach is visible in the extreme close-up in the 2014 Landsat image, in which different infrared wavelengths were used to make the breach more visible. |
Glaciers, Water | |||||||||||||||||||||||||||||||
| Bear Glacier, Alaska | Image of the Week | ice | ||||||||||||||||||||||||||||||||||
| Bear Glacier, Alaska | Image of the Week | aerial photos, icefield | Bear Glacier is located on the Kenai Peninsula… | Bear Glacier is located on the Kenai Peninsula near Seward, Alaska. This glacier represents one of over 30 glacial outflows for the nearby Harding Icefield, which covers over 700 square miles (1,800 square km). Bear Glacier has been receding dramatically over recent decades, as shown in this series of images. The black and white aerial photograph mosaic was collected in 1950 and shows the glacier extending almost fully across the highlighted region (red outline). The satellite images (color) were acquired by Landsat 4 (1989), Landsat 7 (2001), and Landsat 8 (2013). Taken together, these images show an overall trend of glacial retreat in this area for the 63-year time period. There are millions of aerial and satellite images held in the USGS archives, which provide important historical and current views of Earth’s changing landscape. These images are public and available for download by anyone for any location worldwide. |
||||||||||||||||||||||||||||||||
| Bear Glacier, Alaska, USA | Earthshots | ice, icebergs, lagoon, moraines, snow | Satellite images of Earth help us observe… |
Satellite images of Earth help us observe locations that can be difficult to reach in person. Glaciers are sensitive to changes in regional and global climate, so scientists want to monitor them regularly. While some scientists study glaciers in the field, the Landsat satellites allow many others to monitor glacial change from the comfort of their office. Bear Glacier is an outlet glacier of the Harding Icefield in Kenai Fjords National Park, Alaska. Glaciers form when fallen snow compresses into an ice mass over many years; the process usually takes centuries. The ice then flows to lower elevations. Besides showing visible retreat over the past few decades, Bear Glacier has also thinned about 2.5 feet (0.75 meters) per year from the early 1950s to the 1990s. Since Bear Glacier and many other remote glaciers are largely inaccessible, satellite images provide important insights into how they change over time. (Black stripes run through some of the images because of the Scan Line Corrector failure on Landsat 7 in May 2003.) |
Glaciers, Water | |||||||||||||||||||||||||||||||
| Beaufort Sea Ice Experiences Unusually Early Breakup | Image of the Week | ice, sea ice | Ice covering Beaufort Sea near the Arctic Ocean… | Ice covering Beaufort Sea near the Arctic Ocean typically reaches full-blown breakup by late May each year as air and water temperatures warm, and as daylight turns longer. But 2016 has been dramatically different. This year, significant breakup and fracturing of the sea ice had occurred by mid-April, as seen in these Landsat 8 images acquired almost exactly a year apart. On April 13, 2015, the ice is largely intact, though fracturing has begun. A year later, on April 15, 2016, much more open water is visible. Ice specialists with NASA say this year’s breakup is attributable to unusually warm air temperatures during the first months of the year, and to strong winds caused by a stalled high-pressure system over the area. The same warmth that fueled the massive Fort McMurray wildfire in northern Alberta earlier in May is part of the weather pattern affecting the Beaufort Sea. Though the region was once covered by thicker, multi-year ice, it now has largely seasonal, first-year ice that is thinner, weaker, and more easily broken up by strong winds. While the early breakup hints to the possibility that 2016 could ultimately witness the lowest sea ice extent in the history of satellite recording, that, of course, will depend on the weather conditions in the coming months. Future Landsat acquisitions will help scientists monitor the area and visualize changes. |
||||||||||||||||||||||||||||||||
| Beauty of Earth Science Revealed Within Great Smoky Mountains | Image of the Week | seasons | Earth Science reminds us that the study of Earth… | Earth Science reminds us that the study of Earth and its biological processes can occur anywhere—whether we realize it or not. An easy way to appreciate science is illustrated in these images vividly portraying the life cycle of vegetation and displaying seasonal change at an area within the Great Smoky Mountains National Park along the Tennessee–North Carolina border. Earth’s constant biological changing resonates in a revolving gallery of seasonal brushstrokes across the park’s landscape. The vibrant green of forest life explodes as trees still dormant in April awaken and reach full bloom by the time summer stretches into September in these false-color images from Landsat 8’s Operational Land Imager. By late October, senescence has begun—trees brushed in autumn colors start to shed their leaves. While the dark green of coniferous forests remains constant, as it does all year, the start of winter in December ushers back the pink hues of nature in slumber, surrounded by leafless, dormant deciduous trees. |
||||||||||||||||||||||||||||||||
| Beetle Damage in the Black Hills | Image of the Week | insect infestation | Ponderosa pine forests in the Black Hills of… | Ponderosa pine forests in the Black Hills of South Dakota are the focus of this week’s USGS Image of the Week. Mountain pine beetles are about the size of a grain of rice, so of course we can’t see them from space in satellite images. What is visible is what the beetles can do to a pine forest. The washed-out pink color indicates large areas of standing dead or damaged trees. Cold winters normally kill beetle eggs and keep the population down. Recent winters have been warmer than normal. Prolonged dry conditions in the early 2000s also weakened the trees and made them easier for the beetles to attack. These factors together led to a massive epidemic. In 2018, precipitation in the Black Hills was above normal, and the beetles have remained at normal levels. The damage is done, however, and current Landsat imagery still shows the degraded forest. Landsat is well suited to studying forest change over large areas. The Landsat record covers more than 46 years, and its visible and near-infrared range can pinpoint the beginning of future beetle attacks. For more details on the pine bark beetle infestation in the Black Hills, see the USGS Earthshots page. |
||||||||||||||||||||||||||||||||
| Beetle Infestation in Rocky Mountain National Park | Image of the Week | insect infestation | ||||||||||||||||||||||||||||||||||
| Before and After Hurricane Ike | Image of the Week | hurricanes, storms, weather | ||||||||||||||||||||||||||||||||||
| Beijing, China | Earthshots | airport, canals, expressways, Inner City, Olympics, stadium, urban growth | These images show the growth of Beijing from… |
These images show the growth of Beijing from 1977 to 2022. In the images, the blue tones representing buildings and pavement spread outward, replacing the red tones of natural and agricultural vegetation. The city has now grown far beyond its traditional core around the Inner City, which is visible as a bright rectangle in the zoom-in images. |
Cities | |||||||||||||||||||||||||||||||
| Beijing's Growth | Earthshots | expressways, Inner City, urban growth | Beijing has grown and changed remarkably in… |
Beijing has grown and changed remarkably in the "reform era" since 1979, in its own distinct pattern. U.S. cities, for example, are often shaped like a circus tent, with a sharp peak of skyscrapers in the center, sloping off to mid-rise buildings and then low suburbs of single-family houses. Beijing, in contrast, is bowl-shaped, with low historic buildings in its center, surrounded by many commercial skyscrapers and residential towers. Height restrictions have limited many buildings to 3 stories within 250 m of the Forbidden City, 10 stories within the Second Ring Road, and unlimited stories beyond. And single-family buildings are rare in Beijing, except in recent western-style suburbs built for foreigners. Several distinct dynamics have shaped Beijing's growth. The state built a great deal of housing in Beijing during the 1950s, but little was built in the 1960s and 1970s, partly to discourage migration to the city. In the 1970s, many people who spent the Cultural Revolution in the countryside returned to Beijing, and others came seeking jobs. Married couples increasingly sought their own home after marriage rather than living with their parents. By the late 1970s, housing was scarce and crowded. In 1979, along with new reforms, came a boom in housing construction that was much-needed. Beijing's 2021 population is estimated at just over 19.4 million, with a population density of just over 4,600 people per square km. In the more socialist era of 1949–1979, most Beijingers lived and worked in the same place. These "work units" included communal dining halls and infirmaries. So the city was not highly differentiated into office, shopping, industrial, and residential areas. There were few reasons to travel across town often. This has also changed in the reform era; housing is typically still tied to a job, especially for the many state employees, but this housing is not at the workplace. Many work-units buy floors of apartment buildings, or other blocks of housing, so many coworkers live together. In the 1980s, many industrial plants were moved from the central city to outlying areas. Much of the new housing was also outside the Third Ring Road, in medium- and high-rise buildings often built on former agricultural land. In the central city, office districts and shopping districts have been built or expanded. Many new buildings serve the increasing number of foreigners doing business in Beijing. Partly because people's daily activities now occur in separate parts of the city, traffic has increased greatly, and congestion is a major problem. An extensive subway line now operates in Beijing. By 2010, the Beijing subway network had 14 lines, 198 stations, and 336 km of track. The Chinese government has provided a bicycle renting system in Beijing to try to relieve traffic congestion. But car use has risen dramatically in the last decade, and city planners are planning around the automobile and building expressways. |
Cities | |||||||||||||||||||||||||||||||
| Belcher Islands | Earth As Art | islands | Like sweeping brushstrokes of pink and green, the… | Like sweeping brushstrokes of pink and green, the Belcher Islands meander across the deep blue of Canada's Hudson Bay. The islands' only inhabitants live in the small town of Sanikiluaq, near the upper end of the middle island. Despite the green hues in this image, these rocky islands are too cold to sustain more than a smattering of low-growing vegetation. |
||||||||||||||||||||||||||||||||
| Belzoni | Earthshots | catfish, catfish farming, catfish ponds, delta, fish | During the aquaculture expansion of the 1980s… |
During the aquaculture expansion of the 1980s, cropland in the fertile valley was converted to catfish ponds. After the decline, many ponds returned to cropland. Some were left unused. The Landsat images from 1972 and 1986 show that impressive expansion. Based on the 1972 image, which is coarser resolution than the later Landsat imagery, the land was either cropland or flat wetland before the catfish ponds were constructed. Near Belzoni, Mississippi, many ponds have partially converted to cropland. According to the USDA Cropland Data Layer, the region shown in these images has converted to cotton, corn, soybeans, and rice growing. There are also woody wetlands in the former ponds. The 2021 images span the seasons to show which areas have converted back to cropland. Actively growing crops appear bright green in the summer images. Those fields turn a washed-out pink after harvest. The areas that remain dark green in the fall are forested. By winter, those areas, too, become a faded brown and are the first areas to green up again in spring. Where the water disappears throughout the 2021 images may be rice fields. Places where the water persists all year are catfish ponds. |
Aquaculture | |||||||||||||||||||||||||||||||
| Beyond the Ice | Earthshots | ice, snow, volcanoes | Tourism is now a major part of the local… |
Tourism is now a major part of the local economy. Ten thousand visitors climb the mountain every year, employing local people as porters and guides. The snow and ice are part of what attracts the tourists, some of whom come as a “last chance” opportunity, believing that the glaciers will soon disappear. Scientific estimates of that date vary, and some believe the glaciers on the side slopes may survive. If the glaciers do disappear, seasonal snow will still whiten the peak, but perhaps not in the dry seasons when most tourists come. In the end, on this mountain both science and economics are always drawn back, as if by some powerful cultural gravity, to the famous white landscape on its peak. |
Glaciers, Mountains | |||||||||||||||||||||||||||||||
| Big Dam, Big Changes | Earthshots | flooding, hydropower, lakes, reservoirs, rivers | Besides hydropower, the dam has made river… |
Besides hydropower, the dam has made river navigation easier. The river is now deeper and slower, allowing larger ships to travel on the river from Shanghai, at the river’s estuary, all the way to Chongqing, over 373 miles (600 kilometers) upstream from the dam. The Landsat images show straight lines next to the dam—the lock system that raises and lowers ships past the dam. Historically, the Yangtze River has flooded catastrophically. The floods have caused thousands of deaths and damaged agricultural land. Flood control is one of the major anticipated benefits of the dam. The overall long-term extent of this benefit can be determined in the future as a wider range of high water levels are experienced on the river. In addition to flood regulation, water from the reservoir has been used to irrigate dry farmland during drought. However, the project came with some downsides, including the relocation of over 1 million people. Other dangers added to the project’s criticisms. For example, much less sediment now reaches the lower portions of the river, which affects the intertidal wetland habitat at the river’s delta. The reservoir’s water level is allowed to go down in summer to accommodate floodwaters. The water level rises again at the end of summer. These periodic water pressure changes destabilize the surrounding slopes, increasing the likelihood of landslides. Furthermore, the added weight of the reservoir’s water may be intensifying local fault activity; since the reservoir filled in 2003, seismic activity has increased. The reservoir could also affect precipitation in the region. The lake effect in this mountainous region can be enhanced; moist air is forced upward as it reaches the shoreline, adding to low stratus clouds and fog. Additionally, the enhanced evaporation because of the lake can create a microclimate with different precipitation patterns. |
Dams, Energy, Water | |||||||||||||||||||||||||||||||
| Binhai New Area, China | Image of the Week | land conversion | ||||||||||||||||||||||||||||||||||
| Bird Island Ablaze | Image of the Week | islands, lakes, near-infrared, shortwave infrared | In Montana, wildfire swept across Flathead Lake's… | In Montana, wildfire swept across Flathead Lake's 30-acre Bird Island in early August of 2020. Landsat 8 captured this imagery one day after the fire began. The satellite's short wave infrared and near infrared bands reveal the active fire covering approximately half of the island. Smoke obscures the remainder. The same band combination highlights healthy vegetation 16 days earlier. Landsat 8 data archived at the USGS Earth Resources Observation and Science Center is a powerful tool for monitoring the impact of wildfires in the U.S. and around the world. |
||||||||||||||||||||||||||||||||
| Bitumen | Earthshots | bitumen, boreal forest, oil, oil sands | The oil type mined in the Athabasca oil sands… |
The oil type mined in the Athabasca oil sands region is bitumen. This naturally occurring oil is so viscous that even at room temperature it acts like cold molasses. The oil sand is quartz sand; each grain of sand is surrounded by a thin film of water, and then covered in the heavy oil. The bitumen is too thick to flow or to be pumped without first being heated. Of the three oil sands areas in Alberta, only the Athabasca region has reserves shallow enough for surface mining. The Athabasca River, over tens of millions of years, eroded away the sediment that covered the bitumen, making it reachable. Surface mining causes a larger and more visible disturbance of the land surface than other types of mining. The surface mineable area there covers about 4,800 square kilometers (1,850 square miles).
|
Forests, Mining, Natural-Disasters | |||||||||||||||||||||||||||||||
| Black Forest Fire | Image of the Week | burn scars | ||||||||||||||||||||||||||||||||||
| Black Hills, SD, USA | Earthshots | burn scars, insect infestation, mountain pine beetle, ponderosa pine | We can’t see bugs from space, but we can see… |
We can’t see bugs from space, but we can see the effects of insect infestation in Landsat imagery. An unprecedented mountain pine beetle epidemic started in the Black Hills of South Dakota in 1996 and has damaged about 430,000 acres of forest land. The pine beetle, about the size of a grain of rice, is killing ponderosa and other pines throughout the Black Hills. Normally, the mountain pine beetle contributes to the health of a forest by infesting and killing older and stressed trees, which helps make the forest more productive. However, the recent large outbreak is doing more harm than good. It can affect water quality. It can convert the forest from a carbon sink to a carbon source. And where insect outbreaks and forest disturbance caused by wildfire overlap, the effects can actually be both harmful and beneficial. All of the effects of an outbreak need to be monitored. Mountain pine beetles usually live in small numbers. It’s normal for the population to boom occasionally, but the current epidemic is unprecedented. Beyond the Black Hills, pine beetle outbreaks have occurred extensively in many pine forests throughout western North America, from British Columba in Canada to New Mexico. In these Landsat images, beetle infestation is typically indicated by a washed-out pinkish color as seen in the top center and lower right of the images. The more pronounced pink region in the lower left of these images is a burn scar from the Jasper Fire, which occurred in 2000. |
Forests, Mountains, Wildlife | |||||||||||||||||||||||||||||||
| Black Hills, South Dakota, USA | Image of the Week | burn scars, shortwave infrared | ||||||||||||||||||||||||||||||||||
| Black Rock Playa, Nevada, USA | Earthshots | dust, festival, hydrology, lakebed, lakes, playa, population, scarp, sediments, wind | In a desolate corner of Nevada, a playa… |
In a desolate corner of Nevada, a playa surrounded by rugged mountains and described as dry, dusty, desolate, and devoid of vegetation comes to life the week before Labor Day every year for a unique arts festival. Black Rock Playa in northwestern Nevada is part of the lakebed of ancient Lake Lahontan, a deep lake that existed as recently as 15,000 years ago. Lake Lahontan left fine sediments on the lake bottom to form the extremely flat surface. According to a detailed topographic study, the elevation of the playa varies by just 1 meter over 310 square kilometers. The playa stretches 56 kilometers from the small town of Gerlach toward the northeast and the edge of the Black Rock Range. Rainfall is rare during summer when daily high temperatures regularly exceed 37°C, making the surface hard-packed and dusty. Snowmelt flows into the playa in the spring to smooth out the surface. The clay minerals on the lakebed expand when wet and then contract as they dry to form a cracked pattern. Black Rock Playa is managed by the Bureau of Land Management (BLM) as The Black Rock Desert–High Rock Canyon Emigrant Trails National Conservation Area. |
Deserts, Water | |||||||||||||||||||||||||||||||
| Black Thunder Mine | Earthshots | coal, open pits | The Black Thunder Mine, shown in the series of… |
The Black Thunder Mine, shown in the series of Landsat images on the left, has sent 2.2 billion tons of coal to U.S. power plants since 1977. It produces 4 tons of coal per second. The images show the expansion of the open-pit mining operations at Black Thunder. The black lines are the coal seams, the layers of coal that formed over time and lie under the land surface. Lighter straight lines are stepped benches that allow trucks to drive in and out of the mine.
|
Energy, Mining | |||||||||||||||||||||||||||||||
| Bleak Midwinter | Earth As Art | rivers, snow, solstice | Snow covers the landscape in southwestern… | Snow covers the landscape in southwestern Minnesota just a day before the winter solstice. It may look like a stark black and white image, but it is really a natural color image. The Minnesota River flows from the upper left to the lower right. |
||||||||||||||||||||||||||||||||
| Bleeding Heart | Earth As Art | clouds | A feathery, blood red streak cuts across the… | A feathery, blood red streak cuts across the heart of this image. The translucent red paint stroke is not actually a feature of the land. It is a cirrus cloud detected by Landsat 8’s cirrus band. This cirrus cloud, which hovers over the Aral Sea in Kazakhstan, is invisible in natural color imagery. |
||||||||||||||||||||||||||||||||
| Blue Ice | Earth As Art | ice | Near the Queen Fabiola Mountains, also called the… | Near the Queen Fabiola Mountains, also called the Yamato Mountains, is a classic example of blue ice in Antarctica. Blue ice emerges where wind scours glaciers clean of snow and forms when air bubbles are squeezed out of layers of partially compacted snow left over from previous seasons. The ice appears blue because red and yellow wavelengths of light are absorbed. Deeply penetrating light is uniformly scattered at blue wavelengths by the enclosed air bubbles. |
||||||||||||||||||||||||||||||||
| Bogda Mountains | Earth As Art | lakes, sand dunes | The Turpan Depression, nestled at the foot of… | The Turpan Depression, nestled at the foot of China's Bogda Mountains, is a strange mix of salt lakes and sand dunes, and is one of the few places in the world that lies below sea level. |
||||||||||||||||||||||||||||||||
| Bolivian Deforestation | Earth As Art | land conversion, logging, rain forest | Once a vast carpet of healthy vegetation, the… | Once a vast carpet of healthy vegetation, the Amazon rain forest is changing rapidly. This image of Bolivia shows dramatic deforestation in the Amazon Basin. Loggers have cut long paths into the forest, while ranchers have cleared large blocks for their herds. Fanning out from these clear-cut areas are settlements built in radial arrangements of fields and farms. Healthy vegetation appears bright red in this image. |
||||||||||||||||||||||||||||||||
| Botany Bay | Earthshots | airports, harbors, ports, urban growth | The other major natural harbour on the south… |
The other major natural harbour on the south end of these images is Botany Bay. The runways of Sydney Airport stretch into the bay. The main north-south runway is 3,962 meters long and was built in 1963. The other runway that extends into the bay appears in the 2002 image; it was completed in 1994. Another expansion seen in Botany Bay is Port Botany, a major shipping port for Australia. The port is in an ideal location because of the deep water channels of the bay and proximity to the open waters of the Tasman Sea. The most recent addition is seen in the 2013 image, which shows the development of 63 hectares of land. |
Cities, Coasts | |||||||||||||||||||||||||||||||
| Boundary Dam Power Station, Saskatchewan | Image of the Week | coal, lakes, reservoirs, rivers | The coal-fired Boundary Dam Power Station began… | The coal-fired Boundary Dam Power Station began operations in the early 1960s along the Souris River near Estavan, in Saskatchewan, Canada. These three Landsat images were acquired in 1972, 1986, and 2013 and show how the landscape has been changing over the years. The Boundary Dam and Reservoir (near the left-center of the first image) was constructed in 1957 to provide coolant for the coal-fired power station operations. The 1986 image shows expansion of coal mining operations into the surrounding area. The 2013 image shows the Rafferty Dam (upper left), which was developed in the late 1980s and early 1990s to provide additional water for the area and reduce downstream flooding along the Souris River. This image also shows further expansion of the coal mining operations, as well as the emergence of many temporary lakes which began to develop during the wet spring of 2011. The Landsat archive contains more than 40 years of data that are useful for land change analysis, covering all areas of the globe. Landsat provides scientists and project engineers with invaluable imagery to conduct their research on how the changes affect the landscape. |
||||||||||||||||||||||||||||||||
| Brandberg Massif | Earth As Art | Rising unexpectedly from the heart of the Namib… | Rising unexpectedly from the heart of the Namib Desert in northern Namibia, the Brandberg Massif is an exhumed granite intrusion. Unique plant and animal communities thrive in its high-altitude environment, and prehistoric cave paintings decorate walls hidden in its steep cliffs. |
|||||||||||||||||||||||||||||||||
| Brazil Dam Collapse | Image Comparison Sliders | iron ore | ||||||||||||||||||||||||||||||||||
| Brazilian Mining Disaster | Image of the Week | iron ore, open pits, rivers, sediment, tailings ponds | Two dams at an iron ore mine in southeastern… | Two dams at an iron ore mine in southeastern Brazil broke on November 5, 2015, sending mine waste cascading into nearby valleys. The muddy floodwaters destroyed hundreds of homes in the village of Bento Rodrigues, which lies in a valley below the mining area. Natural color images from Landsat 8 compare how the area looked before the breach in the dams to how it looked one week after the incident. The orange colors along the left side of the images are open pit iron ore mines. The dams burst from the tailings ponds, which hold mine waste. The November 12 image shows the orange sediment flowing down a valley through the dark green rain forest. This sediment may contain mining chemicals that could affect the fertility of downstream farmland. Researchers are still testing the water to get a better idea about the contents of the mine waste. |
||||||||||||||||||||||||||||||||
| Brazilian Mining Disaster, Doce River | Image of the Week | rivers, sediment, tailings pond | On November 5, 2015, a tailings pond dam failed… | On November 5, 2015, a tailings pond dam failed at an iron mine in southeastern Brazil, sending contaminated water sediment through the nearby village of Bento Rodrigues and into tributaries of the Rio Doce (Sweet River). (See http://eros.usgs.gov/imagegallery/image-week-2#Brazil_Images) The sediment from that disaster has since moved downstream to the mouth of the Doce River. |
||||||||||||||||||||||||||||||||
| Breiðamerkurjökull Glacier, Iceland | Earthshots | ice, icebergs, lagoon, lake, proglacial lake, snow | The Breiðamerkurjökull glacier tongue, one of… |
The Breiðamerkurjökull glacier tongue, one of the largest in Iceland, flows from Vatnajökull, Iceland’s largest glacier. According to descriptions in historical accounts, this glacier tongue advanced toward the Atlantic Ocean up until the turn of the 19th century. Since about 1930, it has been in full retreat. In these false color Landsat images, vegetated land surfaces appear red. Snow and ice are white. The Vatnajökull glacier is the bright white area in the upper left. Outlet glaciers streak away from it toward the Atlantic Ocean in the lower right. Breiðamerkurjökull is the largest glacial tongue on Vatnajökull and is featured in the center of these images. (Black stripes run through the 2006 image because of the Scan Line Corrector failure on Landsat 7 in May 2003.) |
Glaciers, Water | |||||||||||||||||||||||||||||||
| Bridge | Earthshots | airports, bridges, delta, megacities, urban growth | Cities that are growing this rapidly must also… |
Cities that are growing this rapidly must also show accompanying infrastructure changes. The additions of bridges, highways, railroads, and airports are intended to merge the cities of the delta into a single megalopolis. One ambitious project is the Hong Kong-Zhuhai-Macau Bridge, which opened in 2018, to connect the three cities and cut the travel time from Hong Kong to Zhuhai from 3 hours to 30 minutes. Visible as a long, thin line across the bay, the bridge-tunnel system includes 42 kilometers of bridges over water and a 7-kilometer tunnel. The tunnel allows ships to enter and exit the bay and runs between two artificial islands. The entire system is about 15 times longer than the Golden Gate Bridge. The total cost of bridge was $7.56 billion. Built to withstand an 8.0 earthquake, the bridge makes it easier for goods from the entire PRD to be transported to Hong Kong’s international airport for export. Speaking of the airport, a third runway was added north of the existing runways, 3,800 m long and built on 650 hectares of reclaimed land. The natural color image from Europe's Copernicus Sentinel-2 satellite shows the bridge at 10-meter resolution. Ships are visible in the water, including the wakes behind the ships. |
Agriculture, Cities, Coasts | |||||||||||||||||||||||||||||||
| Bringing the Sea to the Desert | Earthshots | estuary, lagoons, marshland | Building Sea City is a massive and challenging… |
Building Sea City is a massive and challenging engineering project that requires constant innovation. As seen in the 1994 image from Landsat, the area is a natural estuary with tidal creeks. The design of Sea City follows these existing tidal creeks to bring water inland from the Gulf. The first phase of construction began in 2003. The 2004 Landsat image shows the first artificial waterway. Eventually, the sea will be brought inland to the desert by about 9 kilometers on what was once desolate unusable salt marsh. The lagoons created are 3–4 meters deep on average. The water in the lagoons needs to be flushed and kept circulating so it doesn’t become stagnant. With the Gulf’s tidal range of 2.7 meters, this flushing happens in the waterways of Sea City naturally. Farther inland, however, tidal action needs a little help. Giant gates help control the flow of the tides and ensure circulation of the entire lagoon system. It works like a natural pump. Testing of the seawater has shown that its quality is excellent. |
Coasts, Deserts | |||||||||||||||||||||||||||||||
| Broutona | Earth As Art | clouds, islands | These Karman vortices formed over the islands of… | These Karman vortices formed over the islands of Broutona, Chirpoy, and Brat Chirpoyev (Chirpoy’s Brother), all part of the Kuril Island chain found between Russia's Kamchatka Peninsula and Japan. |
||||||||||||||||||||||||||||||||
| Brunt Ice Shelf, Antarctica | Earthshots | calving, chasm, crevasses, ice, ice rumples, ice shelf, icebergs, rifts, thermal | One of the most studied ice shelves in… |
One of the most studied ice shelves in Antarctica has recently seen big changes. While the calving process is a normal part of an ice shelf’s lifecycle, recent rifting and iceberg calving may mean that the Brunt Ice Shelf is in a period of instability. It could also be an indicator of the future of other ice shelves in this region. Landsat satellites have watched the ice shelf for nearly five decades. In 1971, a calving event reduced its extent. This occurred just before the first Landsat launched in 1972, so the earliest Landsat observations of Brunt came during the Antarctic summer of 1972–1973. And now, Landsat 9 has joined Landsat 8 in observing the changing rifts on the ice shelf.
|
Glaciers | |||||||||||||||||||||||||||||||
| Brush Fires in Tasmania | Image of the Week | burn scars, smoke | ||||||||||||||||||||||||||||||||||
| Bulk Download Application | Video - Find Data | |||||||||||||||||||||||||||||||||||
| Buraydah | Earthshots | population, urban growth | The smaller city of Buraydah, northwest of… |
The smaller city of Buraydah, northwest of Riyadh, shows the same pattern of urban growth and agricultural development. From 1972 to 1986, the population of Buraydah almost tripled, from 60,000 to about 180,000 people. The rapid growth continued, and the population was 378,422 in 2004 and 669,000 in 2020. The 48-year increase is over 1,000%. New roads are visible in these images, and irrigated land has increased. Buraydah and Riyadh both lie in Saudi Arabia’s central corridor of settlement and development. |
Cities, Deserts | |||||||||||||||||||||||||||||||
| Burn Mapping | Earthshots | burn severity mapping, near-infrared, shortwave infrared | After a wildland fire, scientists at the USGS… |
After a wildland fire, scientists at the USGS EROS Center quickly begin working on preliminary soil burn severity assessments. They provide results of this work to Department of Interior (DOI) Burned Area Emergency Response (BAER) teams and other local federal land managers. BAER teams consist of an interdisciplinary group of scientists that evaluate the effects of wildland fires and develop mitigation plans to protect valuable natural resources, protect human life and property, and promote landscape recovery. “The soil burn severity map is a critical component for many of the BAER team postfire hazard mitigation prescriptions,” says Randy McKinley, a geographer with the USGS EROS Center, who routinely maps fires on DOI-managed lands for the Bureau of Land Management, National Park Service, Bureau of Indian Affairs, and the U.S. Fish and Wildlife Service. The burn severity map, also called a Burned Area Reflectance Classification (BARC) map, is created using digital image processing techniques developed by USGS, USFS, and other scientists. The BARC is a preliminary soil burn severity map that is field validated and refined by the BAER team. The final map provides a synoptic view of large fires that is not easily obtained in a timely manner on the ground. The BARC map is made by comparing NIR and SWIR spectral band values. NIR light is largely reflected by healthy green vegetation. SWIR light is largely reflected by ash and bare soil. The burn map exploits the relationship between these two bands. The best way to do this is to measure the relationship between these bands prefire and then again postfire. The areas where the relationship between the two bands has changed the most are most likely to be severely burned. The areas where that relationship has changed little are likely to be unburned or very lightly burned. For example, Landsat 8 helped map destruction caused by the Cougar Creek fire near Mount Adams, 75 miles northeast of Portland, Oregon, which started on August 10, 2015. In the three images to the left, snow appears cyan on its peak. The postfire Landsat image from September 11, 2015, shows where the previous green vegetation south and east of the mountain is now charred and appears in shades of red. In the burn severity map, dark green is non-burned, light blue is low burn severity, yellow is moderate severity, and red is high. The timely delivery of BARC maps, generally in less than 2 days after image acquisition, would not be possible without the USGS capability to efficiently downlink, process, and distribute Landsat and other satellite data. USGS hydrologists and soil scientists routinely request BARC products to obtain a better understanding of postfire erosion and water quality issues. McKinley adds, “BARC maps have also proven to be a crucial data layer for the modeling and prediction of potentially destructive postfire debris flows.” EROS responds to dozens of requests for burn mapping support each year. It’s not possible to get such a quick and complete assessment without satellite imagery. Landsat’s 30-m resolution is optimal for providing the detail suitable for landscape scale wildland fire mapping. When Landsat data are not available, imagery from the NASA EO-1 satellite, ESA’s Sentinel-2, and satellite sensors such as Advanced Spaceborne Thermal Emission and Reflection Radiometer (ASTER) and Moderate Resolution Imaging Spectroradiometer (MODIS) provide options for developing a complete picture of landscape change caused by wildland fire. |
Fires, Natural-Disasters | |||||||||||||||||||||||||||||||
| Burned Area Analysis for the Soda Fire, Idaho | Image of the Week | burn scars, burn severity | On August 10, 2015, the Soda Fire began burning… | On August 10, 2015, the Soda Fire began burning about 8 miles northeast of Jordan Valley, OR. It spread rapidly because of high winds, parched fuels, triple digit heat, and low humidity. Over 283,000 acres had burned by August 20. |
||||||||||||||||||||||||||||||||
| Burning Man | Earthshots | festival, lakebed, playa, population, wind | A unique event takes place every year on the… |
A unique event takes place every year on the playa. Burning Man is a weeklong arts and culture festival that ends on the Saturday of Labor Day weekend with the burning of a huge wooden effigy. Part of the event is the construction of a temporary metropolis named Black Rock City. Building of the temporary town starts about 6 weeks before the event. This is the most visible product of the event in satellite images. Besides the city’s radial roadways, the images show a pentagon surrounding the city. This “trash fence” catches wind-blown garbage to keep it from spreading throughout the playa. A major policy of Burning Man is to leave no trace. All debris must be cleaned up after the event is over. Participants must pick up all MOOP, which stands for Matter Out Of Place. The BLM, which grants the license for the event, monitors the cleanup. A Landsat 8 image from October 16, 2018, shows not only the temporary nature of the metropolis but also that cleanup is evidently still in progress on that date. Burning Man began in 1986 in California with 20 attendees and a 2.4-meter effigy. The festival’s first year at Black Rock Playa was in 1990, when the event had outgrown its California beach location. The temporary city that year had a population of 350 and the effigy was 12 meters tall. The 2018 event included 70,000 people. In recent years, the height of the entire effigy has exceeded 30 meters. Usually located in the southern portion of the playa, the festival location changes slightly every year. Can you find the festival location in the 1996 image? (Look in the upper right of that image.) How about in 1999? (Extreme southwestern part of the playa.) The city becomes easier to spot as the event grows larger. In the 2018 image, Black Rock City spans nearly 5 kilometers across. But its area covers only about 3 percent of the entire playa. Burning Man went virtual in 2020 due to COVID-19. Its temporary city was absent from satellite imagery on Labor Day weekend for the first time in decades. After another year without a festival on the playa in 2021, Burning Man returned in 2022.
Check out this hi-resolution aerial image from the National Agriculture Imagery Program (NAIP) of Burning Man 2019. |
Deserts, Water | |||||||||||||||||||||||||||||||
| Burning Man | Image of the Week | playa | Every year, tens of thousands of people descend… | Every year, tens of thousands of people descend upon an unforgiving windswept playa in northwestern Nevada to build a city. Within months, the city is gone. Burning Man is named for the wooden effigy set ablaze at the end of the weeklong celebration in the temporary metropolis of Black Rock City. It all happens on an ancient alkali flat nestled between mountain ranges that fills with runoff after snowy winters. Band 7 of Landsat 8’s Operational Land Imager is sensitive to moisture in and above the soil. It makes the silty water that runs through the playa on May 22, 2017 pop in bright aqua. The city was built months later. The 7-mile pentagonal “trash fence” that catches wind-blown waste and the city’s radial roadways are clearly visible in this image from August 26. The winding white road leading into Burning Man stands out against a light blue gray streak on the playa. It all disappears quickly. The revelers who call themselves “burners” are expected to leave no trace as they depart. Organizers begin to tear down and haul away structures after the Labor Day finale. By October 29, only a rough outline of Black Rock City remains. Landsat imagery offers a unique tool to track both natural and man-made land change throughout the year. |
||||||||||||||||||||||||||||||||
| Byrd Glacier | Earth As Art | ice, ice shelf | Truly a river of ice, Antarctica's relatively… | Truly a river of ice, Antarctica's relatively fast-moving Byrd Glacier courses through the Transantarctic Mountains at a rate of 0.8 kilometers (0.5 miles) per year. More than 180 kilometers (112 miles) long, the glacier flows down from the polar plateau (left) to the Ross Ice Shelf (right). Long, sweeping flow lines are crossed in places by much shorter lines, which are deep cracks in the ice called crevasses. The conspicuous red patches indicate areas of exposed rock. |
||||||||||||||||||||||||||||||||
| Cabo San Antonio | Earth As Art | Several hundred kilometers southeast of Buenos… | Several hundred kilometers southeast of Buenos Aires, Cabo San Antonio juts out into the Atlantic Ocean along the Argentinean coast. |
|||||||||||||||||||||||||||||||||
| Calama | Earthshots | population | As expected in the Atacama Desert, Landsat… |
As expected in the Atacama Desert, Landsat doesn’t detect much vegetation—only some green along the Río Loa and next to the city of Calama. Calama has seen a rising population because of the influx of mine workers. The images show this visible urban area expansion. Notice the airport expansion that took place between the 2010 and 2016 images.
|
Mining | |||||||||||||||||||||||||||||||
| Caldor Fire Expands Toward Lake Tahoe | Image of the Week | burn scars, infrared, shortwave infrared, thermal | The Caldor Fire in California started on August… | The Caldor Fire in California started on August 14, 2021 and quickly spread in high winds. The fire continues to expand toward the Lake Tahoe area as residents evacuate. The first image was captured on August 21, the 8th day. Landsat 8's near infrared and shortwave infrared bands reveal active fire, burn scars, and smoke. Landsat's thermal and infrared bands also expose the fire's advancing edge at night time. The second image is from August 29th, 15 days after ignition.
|
||||||||||||||||||||||||||||||||
| California | Shaded Relief | Shaded Relief Images of specific areas (generally… | Shaded Relief Images of specific areas (generally by state) have been selected from the National Elevation Dataset. For original data details, see NED. |
|||||||||||||||||||||||||||||||||
| California | State Mosaics | The highest and lowest points in the continental… | The highest and lowest points in the continental United States are located within 100 miles of each other in California: Mount Whitney (14,494 feet) and Death Valley (282 feet below sea level). |
|||||||||||||||||||||||||||||||||
| California Wildfires | Image of the Week | fire scars, smoke | Satellites have captured views of the numerous… | Satellites have captured views of the numerous major fires burning in California. An image acquired on November 9, 2018, from NASA’s MODIS sensor on the Terra satellite shows smoke pouring out of two major fires, the Camp Fire and the Woolsey Fire, which both ignited the day before. In the north, the Camp Fire quickly became the deadliest wildfire in the state’s history. Landsat 8 captured an image of the fire hours after it started, and intense northeasterly winds and dry fuels caused the fire to spread rapidly. The Camp Fire burned over 100,000 acres in just two days. Over 6,500 homes were destroyed, most of them in Paradise, a city of 27,000 people. In southern California, Santa Ana winds fanned the flames of the Woolsey Fire. This fire has burned over 97,000 acres. The enormous fire scar is the maroon color between the urban areas of Los Angeles, Thousand Oaks, and Malibu. The scar from the Hill Fire is also visible to the northwest. |
||||||||||||||||||||||||||||||||
| Cambodia Experiences Rapid Rate of Forest Loss | Image of the Week | land conversion, oil palm | When it comes to forest loss on a global scale,… | When it comes to forest loss on a global scale, Cambodia is notable for how rapidly its forests are being cleared. |
||||||||||||||||||||||||||||||||
| Campeche | Earth As Art | islands, lagoons, rivers | Named after the ancient Mayan Province of Kimpech… | Named after the ancient Mayan Province of Kimpech, the state of Campeche comprises much of the western half of Mexico's Yucatan Peninsula. Rivers in southern Campeche drain into the immense Terminos Lagoon, the entrance to which is protected by a long barrier island, Isla Del Carmen. |
||||||||||||||||||||||||||||||||
| Can You Tell the Ridges from the Valleys? | Earthshots | relief inversion | Look at the zoomed in images by the coast. Can… |
Look at the zoomed in images by the coast. Can you tell the peaks (that is, the ridges) from the valleys? It may seem easy, but you may be tricked by a common optical illusion in satellite images called relief inversion. All Landsat images are designed to be morning views, so all of these images were taken in the morning. The Sun is to the east and south, so these images are lit from below and to the right. This causes the western and northwestern slopes to appear dark because they face the sun less squarely, and so are less illuminated. However, we unconsciously expect to see images lit from above. This tricks the brain into believing that mountains are valleys or that craters are mountains. If you look at the image upside-down, with the sun angle generally from the top of the image, you will probably see the image differently. |
Mountains | |||||||||||||||||||||||||||||||
| Canal | Earthshots | canals, reservoirs | On the east end of the largest portion of the… |
On the east end of the largest portion of the Danjiangkou Reservoir, a bright line extends to the east and north. This canal takes water from the reservoir 1,400 kilometers to Beijing. This water will benefit over 100 million people. Construction of this central route of the South-North Water Transfer Project began in December 2003. Beijing began receiving water from the reservoir via the canal in 2014. The entire project is the biggest interbasin transfer scheme in the world. |
Cities | |||||||||||||||||||||||||||||||
| Canals and Levees | Earthshots | canals, hydrology, levees, national park, population, urban growth | Historically, water flowed slowly southward… |
Historically, water flowed slowly southward through the Everglades in a wide swath. Record floods in 1947 and 1948 led to the construction of a massive flood control project. It served to prevent flooding and store water during dry periods. It also allowed for further development of the growing urban area on the Atlantic coastal ridge. The project established three Water Conservation Areas (WCAs), one of which is the Loxahatchee National Wildlife Refuge. These areas are delineated in the Landsat images, clearly divided by the levees and canals. Also visible are the Big Cypress National Preserve, Everglades National Park, and Everglades Agricultural Area. Another part of the project is the 100-mile-long eastern perimeter levee, a 3- to 6-meter high earthen berm built to prevent flooding of farmland and urban areas. It runs along the eastern edge of the WCAs, marking a clear separation between the WCAs and urban areas such as Miami, Fort Lauderdale, and Coral Springs. Along with facilitating the further growth of the urban areas of greater Miami, the other upshot of the project was that the natural flow of water was interrupted, changing the hydrology of the region. The gradual sheet flow of freshwater is diminished, and instead sudden pulses of water are delivered by the canals. These sudden releases caused decreases in the numbers of fish species. |
Agriculture, Cities, Mining, Water, Wetlands | |||||||||||||||||||||||||||||||
| Cancun | Earth As Art | beaches | Known for its beaches and resort hotels, Cancun… | Known for its beaches and resort hotels, Cancun lies at the tip of Mexico's Yucatan Peninsula. Inland from this tourist mecca, however, lies a sparsely populated tropical scrub forest that shelters the ruins of ancient Mayan cities. |
||||||||||||||||||||||||||||||||
| Canyonlands | Earth As Art | canyons, rivers, snow | The Green River and the Colorado River meet… | The Green River and the Colorado River meet within Canyonlands National Park in Utah. Snow-covered Mount Waas, shown in light blue on the right side of the image, overlooks the arches, canyons, and bizarre rock formations that prevail throughout this region. |
||||||||||||||||||||||||||||||||
| Cape Cod, Massachusetts, USA | Earthshots | barrier islands, erosion, islands, sediment, storm surge, storms, tide, weather | Along some coastlines, long, narrow islands… |
Along some coastlines, long, narrow islands stand guard. These barrier islands are attractive to tourists, but they also protect the mainland coast from storm surge and are important beach, dune, and marsh habitats. Those islands do take a beating though. These images focus on the southeastern elbow of Cape Cod, Massachusetts. Wave action, currents, winds, and tides are constantly changing the barrier islands here. Strong storms can change them quite suddenly. In 1984, a nearly unbroken barrier island lines the Massachusetts coast at Chatham. To the south, Monomoy Island extends into the ocean like a teardrop. The other subsections of this Earthshots page show over 35 years of changes to these barrier islands as seen by three different Landsat satellites. |
Coasts, Water | |||||||||||||||||||||||||||||||
| Capillaries | Earth As Art | grassland, rivers, streams | Marking part of the boundary between Colombia and… | Marking part of the boundary between Colombia and Venezuela, the Meta River resembles an artery among capillaries within the human body. Those capillary-like features actually depict dense tree cover along the numerous streams that flow among rich tropical grassland. |
||||||||||||||||||||||||||||||||
| Caribbean Luxury | Earth As Art | beaches, coral, islands | The Caicos Islands (pronounced KAY-kohss) in the… | The Caicos Islands (pronounced KAY-kohss) in the northern Caribbean are a popular tourist attraction, renowned for their beautiful beaches, clear waters, scuba diving, and luxury resorts. The islands lie primarily along the northern perimeter of the submerged Caicos Bank (turquoise), a shallow limestone platform formed of sand, algae, and coral reefs covering 6,140 square kilometers (2,370 square miles). |
||||||||||||||||||||||||||||||||
| Caspian Scour | Earth As Art | ice, islands | In shallow waters surrounding the Tyuleniy… | In shallow waters surrounding the Tyuleniy Archipelago in the Caspian Sea, chunks of ice were the artists. The 3-meter-deep water makes the dark green vegetation on the sea bottom visible. The lines scratched in that vegetation were caused by ice chunks, pushed upward and downward by wind and currents, scouring the sea floor. |
||||||||||||||||||||||||||||||||
| Catfish Farms, Mississippi, USA | Earthshots | catfish, catfish farming, catfish ponds, delta, fish, lakes, levees, oxbow lakes, river | Farming doesn’t always mean tilling the ground… |
Farming doesn’t always mean tilling the ground for crops. In the flat valley along the Mississippi River, in a distinctive region of northwestern Mississippi referred to as “the Delta,” rich soils do support agriculture. But the flat land and abundant groundwater are also suited to aquaculture. Aquaculture simply means cultivating aquatic plants or fish for food. In this part of Mississippi, it means catfish farming. Catfish are raised in Arkansas and Alabama, but Mississippi has led the nation in catfish production since the 1980s. The farm-raised catfish eat high-protein food pellets made of soybeans, corn, wheat, vitamins, and minerals. The pellets float on top of the water, so the fish don’t eat like wild bottom-feeding catfish do. The result is healthier fish with a cleaner, milder taste. The Mississippi River meanders down the left side of these Landsat images. Green indicates vegetation: Bright green shapes are cropland, and darker green shades are forests. Surface water is dark blue. Besides the Mississippi, other streams and oxbow lakes are scattered across the region. The catfish ponds are the distinctive blue squares and rectangles among the cropland. The washed-out pink areas are harvested fields. |
Aquaculture | |||||||||||||||||||||||||||||||
| Catfish Ponds | Earthshots | catfish, catfish farming, catfish ponds, delta, fish, levees | The catfish industry grew rapidly in the 1980s… |
The catfish industry grew rapidly in the 1980s and 1990s. The blue-tinted shapes in the Landsat images mark the ponds where the whiskered fish are raised. The ponds are built above ground with levees, and the water in the ponds is 4–6 feet deep. Catfish pond acreage reduced by more than half from 2003 to 2013. Rising costs and low-priced imports from China and Vietnam led to the decline. At the same time, increased productivity from technological efficiencies led to higher yields and less land needed for the ponds. Among those efficiencies was the development of a hybrid catfish species, a mix of Ictalurus punctatus (channel catfish) and Ictalurus furcatus (blue catfish). The hybrid grows faster, is easier to harvest, and has greater tolerance to crowding, so less area is needed to grow more fish. The business term for that is “increased operational intensity.” Other technological efficiencies reduced costs and spurred growth in the 2010s, including electric paddlewheel aerators, automated oxygen monitors, and pumps to circulate the water. Ponds are now divided into separate sections for treating wastewater and for the fish. These split ponds make treating the water more efficient. |
Aquaculture | |||||||||||||||||||||||||||||||
| Catfish Ponds in Mississippi | Image of the Week | catfish, catfish farming, catfish ponds, delta, fish, lakes, levees, oxbow lakes, river | Mississippi leads the U.S. in catfish production… | Mississippi leads the U.S. in catfish production. The blue tinted shapes in these Landsat images mark ponds where catfish are raised. Ponds are build above ground with levees. The ponds are 4 to 6 feet deep. Catfish pond acreage dropped by more than half from 2003 to 2013. Many ponds returned to cropland. Some were left unused. Others transitioned to woody wetlands. |
||||||||||||||||||||||||||||||||
| Cattle Corridors | Earthshots | cattle, grazing | Some of the dark lines in the images might… |
Some of the dark lines in the images might look like roads. Those lines are a transportation network of sorts, just not transportation for people. They are cattle corridors that connect grazing lands (dark patches) and sometimes connect to villages. They are lined with hedges to keep the cattle out of the crops. One line that goes all the way across these images is indeed a road. It passes through the city of Bankass. But the other lines are cattle corridors. |
Agriculture | |||||||||||||||||||||||||||||||
| Causes and Plans | Earthshots | irrigation, lakes, rivers, saltwater, water use | The diversion of water from the rivers for… |
The diversion of water from the rivers for agricultural use is probably the most significant cause of Lake Urmia’s decline. Several dams have also been built on rivers that flow into the lake. Since 1996, droughts have further contributed to the lower lake levels. Rainfall in 2018-19 brought water levels back up. That rainfall did not bring a permanent restoration of the lake, as the 2023 image shows. No single fix can help the lake recover. But the continual monitoring from Landsat helps decision makers plan for the best solutions. |
Deserts, Water, Wetlands | |||||||||||||||||||||||||||||||
| Causes of Land Loss | Earthshots | bayou, canals, delta, island, marshland, saltwater, sea level rise, sediment, subsidence | High-resolution imagery from the WorldView… |
High-resolution imagery from the WorldView satellite and aerial photos show details that moderate resolution satellite imagery cannot. The result of the land loss and its effect on Isle de Jean Charles becomes clear in these images. The loss of land in southern Louisiana has several causes.
The saltwater that washes farther inland also invades the soil and has made the area no longer good for farming. As the marshland retreats, the saltwater enters bald cypress swamp and kills the trees. Island Road |
Coasts, Water, Wetlands | |||||||||||||||||||||||||||||||
| Cedar Bluff Reservoir, Kansas | Image of the Week | irrigation, reservoirs, rivers, water use | ||||||||||||||||||||||||||||||||||
| Cedar River Surges to Second-Highest Level in Eastern Iowa | Image of the Week | flooding, rain, rivers, storms, weather | On September 27, 2016, the Cedar River surged to… | On September 27, 2016, the Cedar River surged to a crest of 22 feet at Cedar Rapids, Iowa—6 feet above the river’s major flood stage designation. This inundation was a result of quick-moving storms that dropped about 10 inches of rain in the eastern part of the state recently. |
||||||||||||||||||||||||||||||||
| Celebrating 50 Years | Video - Landsat | |||||||||||||||||||||||||||||||||||
| Cellular Ice | Earth As Art | ice, islands | The ice surrounding the northern Canadian Spicer… | The ice surrounding the northern Canadian Spicer Islands, shown in bright red, resembles a cell, complete with ribosomes, mitochondria, and a nucleus. Even though the image was captured shortly after the first day of summer in the Northern Hemisphere, the islands are locked in ice. |
||||||||||||||||||||||||||||||||
| CEOS | Video - EROS | |||||||||||||||||||||||||||||||||||
| CEOS FDA | Video - EROS | |||||||||||||||||||||||||||||||||||
| Change Animation | Earthshots | construction, golf courses, highways, lakes, population, suburb, urban growth, water use | If you could speed up time and watch a fast-… |
If you could speed up time and watch a fast-growing city like Las Vegas change, what would it look like? From the perspective of the Landsat satellites, it’s a stunning lesson in urban growth. Watch Las Vegas’ rapid expansion in these Landsat images dating back to 1972. In each image, bright red indicates actively growing vegetation. This makes golf courses easy to spot, and their development can be tracked along with the residential areas that surround them. The desert landscape gradually becomes covered with streets, highways, and development as time goes on. A plot of very light tan can sometimes be seen right before a new residential area is built. This indicates a clearing of the land. Other natural bright areas also appear around the urban development. The bright reflection indicates the presence of salts, minerals, and clays in the sediment. Water once settled in these flat, lower elevation areas and these minerals remained. The brown-tan regions surrounding the city are likely steeper slopes where flowing water rinsed out those minerals. Darker tones indicate coarser material, and lighter tones are fine material such as clays that have a higher reflectance. Each image represents one year from 1972 to 2023. Landsats 1–5 and Landsat 7–9 are represented, which demonstrates the value of the past Landsat data along with new data for monitoring change over time. Landsat images are available to the public at no cost at the USGS Global Visualization Viewer (http://glovis.usgs.gov) or EarthExplorer (http://earthexplorer.usgs.gov). |
Cities, Deserts, Water | |||||||||||||||||||||||||||||||
| Changes in an Earth As Art Favorite | Image of the Week | alluvial fan, diversion channel, irrigation, streams, water use | Recent activity has altered the landscape in… | Recent activity has altered the landscape in northwestern China. Alluvial Fan, from the second Earth As Art collection, was acquired in 2002 by the ASTER sensor on NASA’s Terra satellite. It’s truly a fan favorite, often named one of the top images of the entire collection. Around 2008, Landsat began to capture some activity on the northern end of the alluvial fan. The changes are clearly manmade, not natural phenomena. Geographers at EROS say the change is due to a large irrigation scheme. A diversion channel now cuts across the fan and captures water from intermittent streams. The north side of that channel now features a flatter landscape rather than braided streams as the water is captured by the channel. The dark rectangle is a water holding pond, and there are some structures near it as well. Off of the Earth As Art image to the north is a large area of irrigated farmland that was not present back in 2002. If we look closely, a pipeline extends from that holding pond to those fields. |
||||||||||||||||||||||||||||||||
| Changes in Canopy Cover | Video - LP DAAC | |||||||||||||||||||||||||||||||||||
| Changes to Lake Urmia, Iran | Image of the Week | lakes, rivers, saltwater, water use | Lake Urmia, located in northwestern Iran, was… | Lake Urmia, located in northwestern Iran, was once one of the largest saltwater lakes in the Middle East. It supports an important seasonal habitat for many species of migrating birds. In recent years, the lake has diminished dramatically. Water enters Lake Urmia primarily from rainfall and inflowing rivers. The diversion of water from local rivers for agricultural use is one likely cause of Lake Urmia’s decline. Since 1996, drought has further contributed to the lower lake levels. The lake now covers about 10 percent of the area it covered in the 1970s. These Landsat images show the changes to Lake Urmia’s surface area over the past fourteen years. Each image was created by mosaicking several individual Landsat scenes to show the full lake area. From 2000 to 2010, some changes can be seen. In the final image (2014), the entire southern portion of the salty lakebed is now exposed. Future Landsat imagery will continue to be a useful tool for mapping and monitoring of further changes to Lake Urmia and its surrounding areas. |
||||||||||||||||||||||||||||||||
| Changi Airport | Earthshots | airports, islands, land creation | The new shoreline extends east of the city all… |
The new shoreline extends east of the city all the way to the airport on the island’s tip. In the mid-1970s, the government moved the main international terminal from Paya Lebar to Changi, partly to allow more distance between the planes and new, higher skyscrapers downtown. In the 1989 image, on the east end of the island, you can see the old and new runways, parallel and a few miles apart. Planes now land where once was only water. A further extension of the land on the eastern tip was built for Chengi Air Base, visible in the 2000 image and later. |
Cities, Coasts | |||||||||||||||||||||||||||||||
| Changing Conditions in Kuwait | Image of the Week | oil, oil wells, smoke | ||||||||||||||||||||||||||||||||||
| Changing Forest Phenology | Video - Landsat | |||||||||||||||||||||||||||||||||||
| Chasm 1 | Earthshots | calving, chasm, crevasses, ice, ice rumples, ice shelf, icebergs, rifts | A feature known as Chasm 1 is prominent in the… |
A feature known as Chasm 1 is prominent in the Landsat imagery. This crack reactivated in December 2012 after no movement for 35 years. The Landsat images show rapid growth of the chasm, especially in 2018 and 2019, as it extended toward the McDonald Ice Rumples. In early 2019, Chasm 1 was extending north as fast as 4 kilometers per year, and from 2012 to 2021, the rift widened almost three-fold. On January 22, 2023, an iceberg the size of Houston finally broke off the shelf. Landsat images show the area a day before the break and a few days after. The new iceberg, named A-81, will be carefully tracked by satellites as it floats into the Weddell Sea. The time series of images also shows Chasm 1 moving westward with the flow of the ice shelf. |
Glaciers | |||||||||||||||||||||||||||||||
| Checkerboard Pattern | Earthshots | clearcuts, forestry, logging, reforestation | The close-up Landsat images that accompany… |
The close-up Landsat images that accompany this section show an obvious checkerboard pattern in the forest. These lands are known as “O&C” lands, which stands for Oregon and California Railroad. Land granted to O&C in 1866 was every other square mile, which formed the checkerboard pattern seen in the imagery. These lands now belong to the federal government, managed by the Bureau of Land Management (BLM). In these images, the squares that remain dark green generally are lands that belong to the BLM. In some of those squares, there is clearcutting and regrowth taking place in this time frame. Adjacent squares, however, have a more noticeable change in tan or white spots, indicating more frequent clearcuts in the logging/reforestation cycle. View an animation of this area to see the changes as they happen. |
Forests | |||||||||||||||||||||||||||||||
| Chernobyl | Image of the Week | grassland, lakes | ||||||||||||||||||||||||||||||||||
| Chernobyl, Ukraine | Earthshots | accident, cooling pond, exclusion zone, lakes, nuclear power plant, nuclear reactor, radiation, river, thermal | A nuclear accident devastated the region near… |
A nuclear accident devastated the region near Chernobyl, Ukraine, on April 26, 1986. These images show the area around the nuclear power plant three days after the accident, and then years and decades after the accident. The Landsat 5 image from April 29, 1986, was the first civilian satellite image of the accident. The data from Landsat were used to help confirm that an explosion had happened at Chernobyl and that the plant had been shut down. |
Agriculture, Wildlife | |||||||||||||||||||||||||||||||
| Chesapeake Bay: A Landsat 8 Surface Reflectance Mosaic | Image of the Week | estuary, sediment | Chesapeake Bay is the Nation’s largest estuary… | Chesapeake Bay is the Nation’s largest estuary and its restoration and protection is a priority. The USGS provides scientific information to help manage this vital ecosystem. As part of that role, staff at the USGS Earth Resources Observation and Science (EROS) Center created this true color composite image. The image was created using Provisional Surface Reflectance data from five Landsat 8 scenes, acquired in October and November 2014.
|
||||||||||||||||||||||||||||||||
| Cheyenne Bottoms Dries Out | Image of the Week | drought, migration, rivers | Cheyenne Bottoms is the largest inland wetland in… | Cheyenne Bottoms is the largest inland wetland in the United States. Water normally diverts from rivers into the vast marshland. The wetland water level changes with precipitation and surface flows. For example, 2007 was a wet year. And 2013 was a dry year. Heavy rains in late summer typically replenish the water levels in the marshland, making it a key stopover for thousands of migrating birds to eat and rest. In the fall of 2022, the birds found nothing to stop for. Landsat images show not only the lack of water, but also an overall lack of healthy green vegetation due to drought conditions in the region. |
Water, Wetlands, Wildlife | |||||||||||||||||||||||||||||||
| Cheyenne Bottoms, Kansas, USA | Earthshots | canals, dikes, migration, waterfowl | Cheyenne Bottoms in central Kansas is the… |
Cheyenne Bottoms in central Kansas is the largest inland wetland in the United States. A 41,000-acre natural basin, the wetland is a key stopover for a multitude of migrating birds to eat and rest. The Cheyenne Bottoms Wildlife Area covers nearly half of the basin. The wetland’s water level changes with precipitation and surface flows. For example, 2007 was a wet year, and 2013 was a dry year until heavy rain in late summer partially replenished the marshland. The lines in the basin are roads on top of dikes, built in the 1950s to impound water in five pools and manage water levels. Further subdivision of the wetland pools took place in the 1990s. Water levels in individual pools are periodically flooded or drained to control invasive vegetation (such as hybrid cattails) and promote desirable aquatic vegetation. Additionally, small grains such as Japanese millet are sometimes seeded to provide supplemental food resources, then flooded to make the food available to foraging waterfowl. The crops surrounding Cheyenne Bottoms include alfalfa, sorghum, wheat, corn, and soybeans, along with pasture. Two intermittent streams, Blood and Deception creeks, flow into the Bottoms from the northwest. Canals were built to divert water from the Arkansas River and Wet Walnut Creek to provide a source of supplemental water to the wetland. However, drought kept the Bottoms dry in 2022.
|
Agriculture, Water, Wetlands, Wildlife | |||||||||||||||||||||||||||||||
| Chilean Volcanoes | Earth As Art | lava flows, volcanoes | On the border between Chile and the Catamarca… | On the border between Chile and the Catamarca province of Argentina lies a vast field of currently dormant volcanoes. Over time, these volcanoes have laid down a crust of magma roughly 2 miles (3.2 km) thick. It is tinged with a patina of various colors that can indicate both the age and mineral content of the original lava flows. |
||||||||||||||||||||||||||||||||
| Choosing a Data Access Tool | Video - LP DAAC | |||||||||||||||||||||||||||||||||||
| Chuquicamata Mine, Chile | Earthshots | copper, open pit, ore, population, tailings, waste | The Atacama Desert of northern Chile has… |
The Atacama Desert of northern Chile has minimal vegetation. But it has ample mineral wealth: large amounts of copper, gold, silver, and other industrial metals. This includes the world’s largest open pit copper mine and the second deepest open pit—the Chuquicamata Mine. In operation since 1910, the largest open pit at the mine measures 1 kilometer deep, 3 kilometers wide, and 5 kilometers long. New York City’s Central Park could fit inside it. Evidence shows that copper has been extracted in the region for centuries. Indigenous people worked the copper deposits in pre-Hispanic times to make weapons and tools. The mine now produces 650,000 metric tons of copper annually. |
Mining | |||||||||||||||||||||||||||||||
| City Growth | Earthshots | flooding, groundwater, sand dunes, sea level, urban growth | Nouakchott was a small fishing village for… |
Nouakchott was a small fishing village for hundreds of years. As recently as 1950, it had only about 200 residents. Drought throughout the 1970s brought migrants to the city, and its population swelled to about 150,000 in 1980. It now has just over 1 million people, and its urbanized area has changed from 5 km2 in 1965 to 150 km2 in 2016. A 1965 close-up of Nouakchott from the Corona satellite shows the extent of the city at that time. Since then, the city’s expansion has been horizontal, spreading outward. Much of city’s urban growth occurs in informal settlements, which can be seen in the later Landsat images in the varying patterns of urban areas. Streets go in multiple directions and sprawl unevenly across the desert from the city’s center. This may be against conventional wisdom, but this growing city in the desert is at high risk for flooding. The city is mostly below sea level and vulnerable to rising groundwater levels, seawater intrusions, porous soils, sand extractions, and heavy rains in low-lying areas. In recent years, the number of rainy days has been increasing. The biggest problem is that a large amount of rain can fall in a short period of time. Since the groundwater level is high, and the type of soil there is not very good at absorbing even a small amount of rain water, rain cannot infiltrate into the ground. These factors lead to a city at high risk. In fact, heavy rains in August 2013 caused flooding in Nouakchott and south-central Mauritania. |
Cities, Deserts | |||||||||||||||||||||||||||||||
| Clearcutting | Earthshots | clearcuts, forestry, logging, reforestation | A logging strategy that’s easy to spot in the… |
A logging strategy that’s easy to spot in the Landsat imagery is clearcutting. All the trees in an area are harvested, and then replanting begins immediately. Replanting must be completed within 2 years of harvest. In Oregon, about 40 million new trees are planted each year. According to the Oregon Forest Resources Institute, the reforestation success rate is 95% on private land. Clearcutting is a major change to the forest. Clearcuts look unattractive, and they disrupt wildlife habitat. The clearcut area can also increase streamflow in that area, and the soil can erode more quickly until reforestation occurs. Therefore, in Oregon, the size of clearcuts is limited to 120 acres. They are also limited further when near highways. Forested buffers must be maintained along streams, lakes, and wetlands. This protects against possible increased streamflow erosion and maintains wildlife habitat. There are actually some positive effects to clearcuts. They create open space in the forest that many plants and animals need to flourish. The full sun promotes rapid regrowth of Douglas fir and other species that need full sun. Also, clearcuts are generally temporary. Oregon requires prompt reforestation. |
Forests | |||||||||||||||||||||||||||||||
| Cloud Lightning | Earth As Art | monocline, rivers | What looks like lightning arcing through an… | What looks like lightning arcing through an ominous cloud is actually a dry landscape of rocky buttes in southern Utah and northeastern Arizona. Numerous rivers flow north from Arizona into the San Juan River. The light vertical feature at the top of the image is referred to as Comb Ridge, a jagged fold in the Earth's crust called a monocline. |
||||||||||||||||||||||||||||||||
| Coahuila, Mexico | Earth As Art | This desolate landscape is part of the Sierra… | This desolate landscape is part of the Sierra Madre Oriental mountain range, on the border between the Coahuila and Nuevo Leon provinces of Mexico. |
|||||||||||||||||||||||||||||||||
| Coastal Flooding near Semarang City, Indonesia | Image of the Week | flooding | Coastal inundation is an ongoing concern for the… | Coastal inundation is an ongoing concern for the region near Semarang, Indonesia. This area faces several different types of flood risk, due to the potential combination of high tides, seasonal rainfall events, and river flooding. Much of this low-lying area is only 0–25 meters above sea level, and in some areas, land subsidence has also been occurring for many years. All of these factors lead to a risk of coastal flooding for local populations.
|
||||||||||||||||||||||||||||||||
| COGs and Notebooks | Video - Find Data | |||||||||||||||||||||||||||||||||||
| Cold War Craters | Earthshots | craters | Landsat 8’s near-infrared and… |
Landsat 8’s near-infrared and shortwave infrared imaging shows the pockmarked desert, perhaps more reminiscent of other planetary bodies than Earth. The age of the craters just about spans the entire Cold War. The first underground test was November 29, 1951; the last September 23, 1992. Despite the hundreds of tests conducted throughout the Cold War years, only about 7% of the Nevada Test Site has been disturbed. While nuclear explosions no longer rock the site, now called the Nevada National Security Site, nuclear weapons research still takes place there based on those tests. Computer simulations can help predict what happens during explosions. The craters have also been used as Mars analog craters. Since access to the site is restricted, the craters are relatively undisturbed. That, along with the dry climate, helps scientists better understand craters on Mars, especially the types of craters that effectively expose near-surface material that Mars rovers and drones can study. |
Deserts | |||||||||||||||||||||||||||||||
| Cold War Craters in Nevada | Image of the Week | aerial photos, craters | One of the most cratered landscapes on Earth is… | One of the most cratered landscapes on Earth is part of the Nevada Desert called Yucca Flat. Landsat 8's near-infrared and short wave infrared imaging shows the pockmarked surface perhaps more reminiscent of other planetary bodies than Earth. The craters are relics from decades of nuclear tests conducted by the U.S. government since the early Cold War. An aerial photo from the USGS EROS archive shows that nuclear testing had already begun by 1952, but the largest crater had not yet appeared. On July 6th, 1962 the Department of Energy detonated a 104 kiloton nuclear device as part of the Plowshare Program which explored the feasibility of non-combat uses of nuclear devices. The result was the Sedan Crater, shown in this declassified satellite image from 1965, and still visible in Landsat imagery today. Find USGS aerial and declassified imagery at EarthExplorer. |
||||||||||||||||||||||||||||||||
| Colima Volcano | Earth As Art | volcanoes | Snow-capped Colima Volcano, the most active… | Snow-capped Colima Volcano, the most active volcano in Mexico, rises abruptly from the surrounding landscape in the state of Jalisco. Colima is actually a melding of two volcanoes, the older Nevado de Colima to the north and the younger, historically active Volcan de Colima to the south. Legend has it that gods sit atop the volcano on thrones of fire and ice. |
||||||||||||||||||||||||||||||||
| Colorado | Shaded Relief | Shaded Relief Images of specific areas (generally… | Shaded Relief Images of specific areas (generally by state) have been selected from the National Elevation Dataset. For original data details, see NED. |
|||||||||||||||||||||||||||||||||
| Colorado | State Mosaics | Denver, the capital of Colorado, is known as the… | Denver, the capital of Colorado, is known as the “Mile High City.” The thirteenth step of the capitol building is exactly one mile (5,280 feet) above sea level. |
|||||||||||||||||||||||||||||||||
| Colorado Flooding | Image of the Week | flooding, rain, rivers, weather | ||||||||||||||||||||||||||||||||||
| Colorful Composites | Earthshots | clearcuts, forestry, logging | On Earthshots we typically show “multispectral… |
On Earthshots we typically show “multispectral composites”—single-date images that combine three different wavelengths into one image. The example used in this section shows a different combination of infrared wavelengths than was used on the 2016 image from the “Interpret the Images” section. In this image, the clearcuts are pink against the bright green of the forest. This combination of infrared wavelengths makes the clearcuts that have occurred from one year to the next stand out more clearly. We don’t often examine change over time in one image. That’s what the colorful image in this section shows. It’s a “multitemporal composite”—one image that shows three different dates combined. This image shows a combination of Landsat images from 1994, 2009, and 2016. Red shows clearcuts that were evident in the 1994 image. Green shows clearcuts that took place by 2009. And blue shows clearcuts that occurred by 2016. Darker tones are areas of forest that did not change in this time frame. This way of examining the imagery shows that logging has affected nearly the entire landscape shown, something that may not be evident when looking at a single-date image. People derive many ecological and economic benefits from forests, and Landsat can help forest managers monitor changes to ensure these resources are available for future generations. |
Forests | |||||||||||||||||||||||||||||||
| Columbia Glacier, Alaska, USA | Earthshots | calving, fjord, ice, icebergs, mélange, moraine, sea level rise, terminus, tidewater glacier | Some landscape changes around the world happen… |
Some landscape changes around the world happen at glacial pace—very slowly—and have not been captured in the satellite era. However, glacial pace would not describe the changes to Alaska’s Columbia Glacier over the past few decades. Columbia Glacier is a large tidewater glacier that flows south out of the Chugach Mountains in Alaska to Prince William Sound. Since 1980, its terminus has retreated 20 kilometers to make it one of the most rapidly changing glaciers in the world. When it was surveyed by British explorers in 1794, Columbia’s terminus was at the northern edge of Heather Island. It stayed there until 1980, when its current rapid retreat began. A 300-meter deep fjord now replaces the portion of the valley once occupied by the glacier. This series of Landsat images shows the rapid retreat, including an acceleration of the retreat in the early 1990s, followed by slowdowns in 1994–1997 and 2000–2006. It has picked up the pace of retreat again since 2006. Columbia has also become narrower, as shown by the expansion of bedrock areas in the images. The false-color images use shortwave-infrared, near-infrared, and green wavelengths to highlight these changes, where snow and ice appear cyan, vegetation is green, open water is dark, and exposed bedrock is brown.
Why this matters |
Glaciers, Water | |||||||||||||||||||||||||||||||
| CoNED with Dean Gesch and Jeff Danielson | Video - EROS | |||||||||||||||||||||||||||||||||||
| Connecticut | Shaded Relief | Shaded Relief Images of specific areas (generally… | Shaded Relief Images of specific areas (generally by state) have been selected from the National Elevation Dataset. For original data details, see NED. |
|||||||||||||||||||||||||||||||||
| Connecticut | State Mosaics | Groton, Connecticut is home to the USS Nautilus,… | Groton, Connecticut is home to the USS Nautilus, the first nuclear-powered ship and the first to reach the North Pole, a feat accomplished in 1958. The Nautilus is on display at the Submarine Force Museum. |
|||||||||||||||||||||||||||||||||
| Contact Information | Earthshots | Customer Services |
Customer Services The satellite images presented on the Earthshots Web site are not intended to be used for scientific interpretation, only for educational purposes. Landsat data are freely available and may be downloaded from the USGS Global Visualization Viewer (GloVis) at http://glovis.usgs.gov or EarthExplorer at http://earthexplorer.usgs.gov. |
|||||||||||||||||||||||||||||||||
| Contrails | Earth As Art | contrails, lakebeds, rivers, shadows | Like scratches on a marble table, airplane… | Like scratches on a marble table, airplane contrails cut across the southern California Mojave Desert. The shadows from the contrails cast dark lines across the ground. Contrails form when cold, dry air mixes with warmer aircraft exhaust. Mountains and a few dry lakebeds provide a backdrop to this scene, along with bright green spots of agriculture along the Colorado River. |
||||||||||||||||||||||||||||||||
| Cook Inlet, Alaska | Shaded Relief | Shaded Relief Images of specific areas (generally… | Shaded Relief Images of specific areas (generally by state) have been selected from the National Elevation Dataset. For original data details, see NED. |
|||||||||||||||||||||||||||||||||
| Cooling Pond | Earthshots | accident, cooling pond, lakes, nuclear power plant, radiation, river, thermal | The Landsat 5 image acquired before April 26… |
The Landsat 5 image acquired before April 26 shows heated water being pumped from the plant into the adjacent cooling pond and circulating counterclockwise. Landsat 5’s thermal infrared band shows that heated water as orange, then gradually turning yellow then blue as it cools. But the image from April 29 indicates all the water in the pond is the same temperature, evidence the plant was not operating. As the first civilian satellite to image the disaster, Landsat 5 helped confirm the disaster had happened, and this was part of the evidence. In just the past few years, the cooling pond by the former power plant began drying up. Satellite images clearly reveal a rapid decrease in water level. Soon after the accident in 1986, radioactive material entered the pond from atmospheric fallout. The contamination went into the pond’s sediment and was shielded by the water. In 2014, the Ukraine stopped pumping water into the pond from the Pripyat River in order to save money. The consequence of this action could be to expose radioactive sediment to the air where it can be dispersed by the wind. |
Agriculture | |||||||||||||||||||||||||||||||
| Copenhagen, Denmark | Earthshots | artificial islands, bridge, development, islands, land creation, population, urban growth | Often described as one of the world’s best… |
Often described as one of the world’s best cities to live, Copenhagen is growing steadily. That growth comes with challenges to keep it a desirable place to live. In these false-color Landsat images, the urban areas of Copenhagen are shades of purple. Vegetation appears green, and farmland appears bright green when crops are growing and pink when the fields are fallow. The Øresund Strait separates Copenhagen from Malmö, Sweden. The strait and other water bodies appear black. In the time that these images span, the population of Copenhagen has grown from 478,615 in 1985 to 580,184 in 2015. But the population of greater Copenhagen in 2014 was 1,246,611, up from 1,084,885 in 2006. |
Cities | |||||||||||||||||||||||||||||||
| Copper and Blue | Earth As Art | ice, lakes, sediment, tundra | The copper color in this infrared combination is… | The copper color in this infrared combination is the presence of lake ice in the Northwest Territories in northern Canada. The lake on the right side is Whitefish Lake, in a region with numerous glacial landforms. Bright wrinkle-like lines are eskers, ridges made of sand and gravel formed by glacial sediments deposited by meltwater rivers flowing on the ice. The blue color is land dominated by shrub tundra with some spruce stands. |
||||||||||||||||||||||||||||||||
| Corona and WV-2 | Earthshots | cattle, declassified, grazing, resolution | To get an even more detailed view of this… |
To get an even more detailed view of this region, we can actually go back to satellite imagery from 1967. This pre-Landsat imagery, while black-and-white, helps to extend the record of land change on the Earth. These images are declassified reconnaissance satellite images and show detailed and informative views of the Seno Plain. Comparing WorldView-2 with Corona shows the pattern of change that we see in Landsat, only in more detail. In the grayscale Corona imagery, bright areas are cultivated cropland. Dark gray is grass with shrubs and trees. In the natural color WorldView-2 images in 2011, much of that fallow or grassy land has converted to agriculture, indicated by light tan. The resolution of the Corona image is 6 feet. For Landsat, it’s 30 meters. So in Corona, even single trees can be distinguished. The more up close images show a few villages in higher detail and demonstrate that they have expanded with the growing population. The darker gray at the bottom of the 1967 image gives way to tan in 2011, which is intensive cropland. Those cattle corridors are also clearly visible in this WorldView-2 image. |
Agriculture | |||||||||||||||||||||||||||||||
| Cottonwood Fire, 2016 | Image of the Week | burn scars, grassland | October 16, 2018, marks the two-year anniversary… | October 16, 2018, marks the two-year anniversary of the Cottonwood Fire in western South Dakota. The fire consumed a large swath of grassland near the community of Wall and just north of Badlands National Park. Thanks to low relative humidity, and high winds and temperatures, the fire spread quickly. It burned 41,360 acres by the time it was 100 percent contained two days later. Imagery from Landsat and Sentinel-2 show the fire scar and relatively rapid recovery of the grassland in the two years since the fire. The Sentinel-2A image from October 31, 2016, shows the burn scar just 13 days after the fire was contained. Recovery of a grassland fire happens more quickly than a forest fire. With enough moisture, grasses in fire-adapted landscapes use the postfire flush of nutrients to rapidly regrow. Only a very faint outline of the burn scar is visible in the 2017 Landsat 8 image. By 2018, the burn scar has disappeared. Landsat and Sentinel have similar spatial resolutions and infrared imaging capabilities, allowing them to complement each other in burn severity monitoring. |
||||||||||||||||||||||||||||||||
| Cougar Creek Fire, Washington, USA | Earthshots | burn severity mapping, near-infrared, shortwave infrared | Wildland fires can leave behind scorched… |
Wildland fires can leave behind scorched mountainsides with no trees or other vegetation to stop rain-driven mudslides or dangerous debris flows. When such potential exists, the shortwave infrared (SWIR) and near-infrared (NIR) spectral bands of the Landsat satellite sensors help to identify those possibilities quickly. The six images displayed show prefire conditions in 2014 and the progression of the Cougar Creek Fire in Washington on the eastern slopes of Mount Adams over the several days that it burned in 2015. Lightning started the fire on August 10, 2015, and it was not contained until mid-September. While it’s interesting to see the progression of the fire, it’s the prefire and postfire images that are really important for burn severity mapping. (Black stripes run through the Landsat 7 images because of the Scan Line Corrector failure on Landsat 7 in May 2003.) |
Fires, Natural-Disasters | |||||||||||||||||||||||||||||||
| Crater Lake Image Shows Potential of Sentinel-2A | Image of the Week | lakes, national parks | This image from the European Space Agency’s… | This image from the European Space Agency’s Sentinel-2A satellite offers a breathtaking view of Crater Lake National Park in southern Oregon. It offers something equally important to park managers, scientists, and anyone else interested in land cover change—a view that is highly similar and complementary to Landsat acquisitions. |
||||||||||||||||||||||||||||||||
| Creek County, Oklahoma Fire | Image of the Week | burn scars, drought, grassland | ||||||||||||||||||||||||||||||||||
| Crimson Streams | Earth As Art | streams | Vegetation appears red in this piece, which moves… | Vegetation appears red in this piece, which moves from dark to light in the Atlas Mountains of Morocco. The vegetation grows along streams, which seem to follow a tortured course through the ridges and valleys before wandering through the desert. |
||||||||||||||||||||||||||||||||
| Cropland | Earthshots | cattle, grazing | These close-up images from Landsat show the… |
These close-up images from Landsat show the Seno Plain in a bit more detail. The images were acquired during the dry season, so crops were not growing at the time. However, the images do show evidence of how intensely the land was being used for agriculture, indicated by the lighter toned patterns. As in the wider views, the Bandiagara escarpment is the feature on the left of these images. The 1972 image shows that farmers practiced crop rotation, leaving some land fallow. The fallow fields are represented by dark patches. In 1986, however, much of the fallow is gone, and there is even less of it by 2016. Bright areas dominate the 2016 image, indicating wall-to-wall cropland over the plain. The darkest patches are grassy fallow areas and are either protected lands or used for cattle grazing. |
Agriculture | |||||||||||||||||||||||||||||||
| Cubbie Station, Queensland, Australia 1987 - 2013 | Image of the Week | irrigation, land conversion, water use | ||||||||||||||||||||||||||||||||||
| Cubism—Landsat Style | Earth As Art | water use | Startling red patches sprout from an agricultural… | Startling red patches sprout from an agricultural landscape that looks almost like a Cubist painting. The fields in this part of eastern Kazakhstan follow the contours of the land—long and narrow in mountain valleys, and large and rectangular over the plains. |
||||||||||||||||||||||||||||||||
| Cuesta del Viento Reservoir, Argentina | Image of the Week | reservoirs, rivers, sediment | The Cuesta del Viento (Wind Slope) Reservoir… | The Cuesta del Viento (Wind Slope) Reservoir formed behind a large dam that was constructed on the Jáchal River in 1997–1998 in the San Juan Province of Argentina. These Landsat images show the area in November 1996 (before the dam was built) and December 2013. The inclusion of Landsat’s shortwave infrared band information for this image pair also highlights the geologic features of the area. Landsat images provide an unbiased view of features on the Earth’s surface and the changes that take place on the landscape. |
||||||||||||||||||||||||||||||||
| Cyclone Nargis Hits Burma | Image of the Week | cyclones, flooding, storms, weather | ||||||||||||||||||||||||||||||||||
| Daily Operations of Landsat 7 | Video - Landsat | |||||||||||||||||||||||||||||||||||
| Dallas-Fort Worth International Airport | Earthshots | airport, urban growth | Dallas-Fort Worth International Airport,… |
Dallas-Fort Worth International Airport, between Dallas and Fort Worth, opened the year of the first Landsat image shown here, 1974. A new runway added after 1974 can be seen west of the airport in the 1989 image. The north-south runway on the east side opened in 1996 and appears in images from 2000 and later. The airport covers almost 30 square miles, making it the second largest airport in the United States. |
Cities | |||||||||||||||||||||||||||||||
| Dallas, Texas, USA | Earthshots | airport, lakes, reservoirs, suburbs, urban growth | These images show the Dallas–Fort Worth… |
These images show the Dallas–Fort Worth metropolis in northeastern Texas. This city has grown significantly in recent decades, from 2,378,000 in 1970 to 7,943,685 by 2022. |
Cities | |||||||||||||||||||||||||||||||
| Dam Breach at Mount Polley Mine, Canada | Image of the Week | copper, gold, lakes, rivers, tailings pond | On August 4, 2014, an earthen dam failed at the… | On August 4, 2014, an earthen dam failed at the Mount Polley Mine in central British Columbia, Canada. The dam had been built to hold a tailings pond that contained water and waste materials from local gold and copper mining operations. |
||||||||||||||||||||||||||||||||
| Dam Breaks in Michigan | Image Comparison Sliders | flooding, lakes, rivers | ||||||||||||||||||||||||||||||||||
| Dam Failure in Uzbekistan | Image of the Week | flooding, irrigation, rain, reservoirs | The western wall of Uzbekistan's Sardoba… | The western wall of Uzbekistan's Sardoba Reservoir breached on May 1, 2020 after a week of heavy rain. According to the news, thousands were evacuated as water rushed north into farmland and villages across the central Asian country and into neighboring Kazakhstan. Imagery from Europe's Copernicus Sentinel-2 satellite shows water pooling across a wide area. In the May 4 image, three days after the breach, the reservoir appears partially drained. The water stored in the Sardoba Reservoir is used primarily for irrigation. This imagery indicates the extensive farmland in the region, largely cotton, a water-intensive crop. |
||||||||||||||||||||||||||||||||
| Dam Flooding After Rosa | Image Comparison Sliders | flooding, hurricanes, rain, storms, weather | ||||||||||||||||||||||||||||||||||
| Damage | Earthshots | caterpillar, defoliation, insect infestation, moth | Gypsy moth caterpillars devour the leaves of… |
Gypsy moth caterpillars devour the leaves of hardwood trees, causing the greatest damage in late June as the larvae reach maturity. The caterpillars are hungry little buggers, and they’re not picky eaters. Even though they prefer oak and aspen, they feed on other deciduous trees such as maple, birch, poplar, willow, apple, and hawthorn, and can go after coniferous trees during a large outbreak. During a dense population boom, they eat all the leaves on a tree and can even defoliate entire stands of trees. Beginning in 2016, the combination of visible and infrared imaging from Landsat revealed the extent of the damage the outbreak has caused. Healthy forest is bright green, but as the time series progresses, much of the green turns to faded brown as the infestation spreads. Though gypsy moth outbreaks are a fairly regular occurrence in the more southern portion of their invaded range, this outbreak was the first time gypsy moths caused significant defoliation in New England since the 1980s.
How did they get here? An amateur entomologist Etienne Léopold Trouvelot brought gypsy moth eggs from France to Massachusetts in 1869. He was conducting experiments with the eggs possibly to see if the gypsy moth could be an alternative to the native silkworm. The insects somehow escaped from his home and have affected the forests of the Northeastern United States ever since. |
Forests, Wildlife | |||||||||||||||||||||||||||||||
| Danjiangkou Reservoir | Earthshots | canals, reservoirs, rivers | Visible in these images is one canal… |
Visible in these images is one canal associated with the $62 billion South-North Water Transfer Project. Water resources are a concern in China because freshwater is distributed throughout the country unevenly. The south has abundant freshwater, but it’s scarce in the north. This project is an attempt to alleviate the water shortage in the north. The entire project has three different canal routes that link China’s four major rivers (the Yangtze River, Yellow River, Huai River, and Hai River). The central route brings water from the Danjiangkou Reservoir north to Beijing. The reservoir was formed by the Danjiangkou Dam, completed in the 1970s. The height of the dam was increased from 162 to 176.7 meters above mean sea level between September 2005 and September 2013. |
Cities | |||||||||||||||||||||||||||||||
| Dasht-e Kevir | Earth As Art | salt marshes | The Dasht-e Kevir, or Great Salt Desert, is the… | The Dasht-e Kevir, or Great Salt Desert, is the largest desert in Iran. It is a primarily uninhabited wasteland, composed of mud and salt marshes covered with crusts of salt that protect the meager moisture from completely evaporating. |
||||||||||||||||||||||||||||||||
| Data Access - AρρEEARS | Video - LP DAAC | |||||||||||||||||||||||||||||||||||
| Data Citation Tips from NASA's Land Processes DAAC | Video - LP DAAC | |||||||||||||||||||||||||||||||||||
| Dead Sea, Israel, Jordan, West Bank | Earthshots | evaporation, evaporation ponds, irrigation, potash, salt, salt pan, salt ponds, saltwater, sea, sea level, water use | The water surface level of the Dead Sea is the… |
The water surface level of the Dead Sea is the lowest natural land or water surface on Earth at more than 400 meters below sea level. That level continues to lower as water from Dead Sea tributaries is diverted for irrigation. In the southern part of the sea, the salt and potash industries use water from the sea in evaporation ponds. Water is not quickly replenished in this closed basin, so the level continues to drop. The sea is made up of a northern basin and a southern basin. Both basins were once connected by a strait (see the 1973 image), but the strait is now dry. (Black stripes run through some of the Landsat 7 images because its Scan Line Corrector failed in May 2003.) |
Water | |||||||||||||||||||||||||||||||
| Deadly Mudslides in Japan | Image of the Week | flooding, mudslides, rain, rivers, sediment, weather | Torrential rainfall swamped western Japan in July… | Torrential rainfall swamped western Japan in July of 2018. The rain caused mudslides that flooded cities, damaged buildings and rattled the nation’s infrastructure. More than 170 people died. These Landsat 8 images highlight the rush of muddy water that tore through the cities of Fukuyama and Kurashiki on its way to the ocean. The waters of the Ashida and Takahashi Rivers appear light tan and gray in the first image, which was captured May 22. The colors changed when the mudslides began. Each river becomes a thick, tan-colored snake of murky liquid on July 9, sending swirls of sediment into the sea. The images are close to natural color. They were created using bands 4, 3, and 1 on Landsat 8’s Operational Land Imager. Band 1 is sensitive to suspended sediment in water. Landsat data archived at the Earth Resources Observation and Science (EROS) Center can be used to monitor, study and respond to natural hazards worldwide. |
||||||||||||||||||||||||||||||||
| Death Valley 1,000-year Flood Event | Image of the Week | dry lake bed, flooding, rain, storms, weather | This October, a system of storms caused… | This October, a system of storms caused significant flooding in most of Death Valley National Park, California. Collectively, the area only received 1–2 inches (2.5–5 centimeters) of rain, but the annual average in Death Valley is about 2 inches (5 centimeters). The largest of the storms occurred on October 18. Flash floods from the storm destroyed roads and utilities, and damaged several historical structures. This was the largest flood event in the recorded history of the area. In this image pair Landsat 8 images contrast October 2014 (a year with typical precipitation) to October 2015. The false color images highlight hydrogeology; the areas in green to blue are the locations with moisture content. Especially striking is the Badwater Basin, normally a dry lake bed. In the 2015 image, it is full of water. Landsat imagery acquired before and after the flood event will help with monitoring and evaluation of landscape response and impacts. |
||||||||||||||||||||||||||||||||
| Deep Blue Cubism | Earth As Art | irrigation, rivers, water use | A bit of blue cubism in southern Uzbekistan… | A bit of blue cubism in southern Uzbekistan highlights the intensive irrigation that is common along rivers that flow into the Aral Sea. However, so much water is used for irrigation that very little actually reaches the Aral Sea. The perplexing variety of blue and green shades are farm fields with actively growing vegetation among the scattered residential zones. |
||||||||||||||||||||||||||||||||
| Deforestation | Earthshots | rain forest, soybeans | Every year in Bolivia, a swath of forest two-… |
Every year in Bolivia, a swath of forest two-thirds the size of Delaware is cleared of trees. Most of this deforestation has taken place in lowlands along and east of the Rio Grande River. Compared to most Amazon soils, the alluvial soils in these lowlands are very fertile. The flat landscape is relatively easy to clear. And rain forests have an abundance of one obvious thing important to farming—rain. Besides that, the area is close to a large market and distribution center, the city of Santa Cruz, which lies just outside of these images, about 7 kilometers off to the southwest. One more benefit to the land owners: when farmland becomes too eroded or compacted for crops, farmers change to cattle production. Until the 1970s, sugarcane was the major crop near Santa Cruz. By the 1980s, the price for soybeans increased. Today, sugarcane is still an important crop, but industrial soybean production has become the most common crop. Different deforestation geometries reveal different types of agricultural management. Most noticeable might be the groups of long rectangles, which are large-scale agricultural operations. These areas require large capital investments, use heavy machinery to prepare the land, and involve intensive production of annual cash crops, mainly soybean, sugarcane, and rice. Dark strips within these fields are windbreaks, needed because the soils in the area are fine and prone to wind erosion. Small-scale agriculture is indicated by smaller irregular plots. Small-scale farmers here produce mainly rice, maize, and perennial crops, such as bananas. The forest is cleared perpendicular to a road in long rectangles, forming a “piano key” pattern. The radial-shaped patterns are planned settlements called nucleos. The individual farms radiate outward from a central hub, which is communal land. Most of these settlements are located in the large area of colonization visible in the northwest part of the main images, the San Julian area. There are a few others; see if you can find them in the later images. |
Deforestation, Forests | |||||||||||||||||||||||||||||||
| Deforestation | Earthshots | island, spiny thicket | All of Madagascar is being threatened by… |
All of Madagascar is being threatened by deforestation, but this threat is most apparent in the Spiny Thicket region. Spiny Thicket has a naturally slow rate of growth and regeneration, making it especially vulnerable to the effects of deforestation. The primary threats are from small-scale but widespread clearing of trees for firewood, agriculture, and livestock grazing. Human population growth increases the demand on natural resources. This is part of the reason for the increased rate of deforestation here. For example, more land is needed for agricultural production. Landsat images show more clearly the extent of changes to the Spiny Thicket ecoregion in southwestern Madagascar. Over the past four decades, rapid deforestation has occurred on both sides of the Linta River. Most of these images are from around the end of the rainy season (October to April) when vegetation is near its peak annual growth. |
Agriculture, Deforestation, Forests | |||||||||||||||||||||||||||||||
| Deforestation Causes | Earthshots | logging, rain forest | The primary cause of this deforestation is… |
The primary cause of this deforestation is conversion to cropland and pasture. But the reasons for this conversion are varied. Countries that have extensive tracts of rain forest build roads into remote areas to improve transportation of goods. Legal and illegal logging follows the road expansion. Once an area is logged, it becomes a prime location for agricultural development, which further clears the surrounding forest. These cleared areas are also prone to wildfires, which can further degrade the forest. Governments sometimes encourage the development of the rain forest with subsidies and tax breaks. Pressure from the global market for timber and soybeans drives the agricultural development. |
Deforestation, Forests | |||||||||||||||||||||||||||||||
| Degradation | Earthshots | alluvial, delta, floodplain, mangrove, salt water | People are drawn to delta and coastal regions… |
People are drawn to delta and coastal regions, and about 7.7 million people live on the Ayeyarwady Delta. Deltas can be productive agricultural areas because the soil is rich and the flat terrain and water provide easy access to water-based transportation. The Ayeyarwady Delta produces 35% of Myanmar’s rice. Cutting wood for fuel also contributes to mangrove loss, but most of the deforestation in this delta has been for rice fields. A more close-up look at the eastern portion of the delta shows this degradation in more detail. As the sequence of images progresses, the bright green of healthy mangrove changes into a mottled green of degraded mangrove. This mangrove loss could have implications for protecting people on the delta. The delta’s low elevation and flat landscape make it vulnerable to flooding from storm surges, as with Cyclone Nargis in May 2008. The mangrove forests provide a buffer for storm surge. |
Coasts, Deforestation, Forests | |||||||||||||||||||||||||||||||
| Degraded Habitats | Earthshots | migration, milkweed, monarch butterflies, oyamel | The monarch migration is an endangered… |
The monarch migration is an endangered phenomenon. Logging in the overwintering sites in Mexico reduces the area available for the monarchs. The Monarch Butterfly Biosphere Reserve, established in 1986, is intended to protect the overwintering areas. But studies have shown that deforestation has occurred within the reserve. Some of that deforestation can be tracked from space with Landsat imagery. According to Monarch Watch, during the 2012–2013 season, monarch colonies occupied the lowest number of hectares of forest in the previous 20 years. But the 2013–2014 season was even lower. Recent seasons have seen a slight increase in area of forest occupied, but monarch populations this low are extremely vulnerable. Just one winter storm could severely decrease their numbers. Landsat sensors use infrared reflectance. One of the wavelengths of light they use is called near-infrared. Actively growing vegetation reflects this wavelength, so when this wavelength is assigned the visible color red, vegetation is displayed as red in these false color images. As you take a closer look at the zoomed in areas in the other sections, watch for gray patches in areas that were once red. This indicates a degraded forest. Not all of the reduction in the monarch population can be attributed to oyamel forest loss in Mexico. In the United States, expansion of agriculture and herbicide use are reducing the milkweed that the caterpillars need. Extreme weather conditions have also been harming the monarchs. Satellite imagery continues to be useful in tracking the monarch population in these overwintering sites and can help recover this remarkable migration. |
Forests, Wildlife | |||||||||||||||||||||||||||||||
| Delaware | Shaded Relief | Shaded Relief Images of specific areas (generally… | Shaded Relief Images of specific areas (generally by state) have been selected from the National Elevation Dataset. For original data details, see NED. |
|||||||||||||||||||||||||||||||||
| Delaware | State Mosaics | Delaware is known as the “First State,” because… | Delaware is known as the “First State,” because it was the first of the original thirteen colonies to ratify the United States Constitution. |
|||||||||||||||||||||||||||||||||
| Delta Region, Netherlands | Earth As Art | canals, deltas, dikes, islands, rivers | Along the southern coast of the Netherlands,… | Along the southern coast of the Netherlands, sediment-laden rivers have created a massive delta of islands and waterways in the gaps between coastal dunes. After unusually severe spring tides devastated this region in 1953, the Dutch built an elaborate system of dikes, canals, dams, bridges, and locks to hold back the North Sea. |
||||||||||||||||||||||||||||||||
| Delta Shifts | Earthshots | delta, rivers, sediment | The Huang He Delta has historically built up… |
The Huang He Delta has historically built up over a broad area because of its wandering ways. The river’s course in its lower reaches has shifted 11 times since 1855. The latest shift was in 1976. Before that, the river turned northward into the sea; in 1976, it took a different direction, heading east and carrying its sediment to build a new delta there. The river now carries its sediment farther outward, creating an ever-changing delta. |
Aquaculture, Cities, Coasts, Water | |||||||||||||||||||||||||||||||
| Deltas | Earthshots | canals, deltas, marshes, rivers, sea level rise, sediment | The Wax Lake Outlet is a prominent… |
The Wax Lake Outlet is a prominent north-south waterway. This artificial channel begins just upstream of Morgan City and carries water straight down to the Gulf. The U.S. Army Corps of Engineers dug the outlet in 1941 to prevent severe floods. After the Wax Lake Outlet was created, water carried sediment to its mouth and began to build a delta, all of it underwater at first. After flooding in 1973, caused by an unusually cold winter and above average spring rain, extra sediment rushed through the Wax Lake Outlet and, for the first time, its delta became visible. Reeds and willows began to grow and stabilize the new land. Their roots hold on to the sediment to keep the ground stable. A little less than half of the Atchafalaya River flows through the Wax Lake Outlet. The rest also flows south to the Gulf a little to the east and is building a delta there. The rest of the Louisiana coastline is retreating because Mississippi River water flows through narrow channels that don’t allow sediment to settle—the sediment-rich water speeds directly into the Gulf. The Atchafalaya carries sediment more slowly, which allows it to settle in the broad, shallow basin and maintain the marshes. |
Coasts, Water, Wetlands | |||||||||||||||||||||||||||||||
| Demand | Earthshots | logging, palm oil, rain forest | In the late 1960s, the Indonesian government… |
In the late 1960s, the Indonesian government began working toward improving and expanding its economy. It encouraged people to move to the remote and less developed eastern islands. One of the industries it expanded was logging. As workers cut down the primary forests, the forests were not allowed to grow back into secondary forest. Instead, they were planted as palm oil plantations. Palm oil trees are native to Africa and were found to thrive in Malaysia and Indonesia. Palm oil demand is up as demand for biofuels rises. Biofuel producers say palm oil is a renewable alternative to fossil fuels. One hectare of a palm oil plantation can produce 10 times as much oil as other oilseed crops, including soybeans. The palm oil plantations show up clearly in Landsat images in the middle of the undisturbed rain forest. Road networks—the pink jagged lines—cut through the green of the rain forest. One road leads from the cleared forest to the river town Asike. The first cleared area that appears in these images covers about 14,500 hectares. By 2014, another new planted region appears just south of the first cleared area. The next section shows those cleared areas in more detail. |
Agriculture, Deforestation, Forests | |||||||||||||||||||||||||||||||
| Demini River | Earth As Art | rivers | A marsh-like area borders the Demini River in… | A marsh-like area borders the Demini River in northwestern Brazil. The Demini eventually joins the Amazon River. |
||||||||||||||||||||||||||||||||
| Denver International Airport | Image of the Week | airports, land conversion | ||||||||||||||||||||||||||||||||||
| Denver, Colorado, USA | Earthshots | airport, freeways, irrigation, prairie, urban growth, wildlife refuge | Denver has all the classic marks of… |
Denver has all the classic marks of substantial urban growth over the past few decades. Satellite images reveal expanding residential areas, industrial zones, and new freeways that loop around the metropolitan area. Also visible is one of the largest airport building projects in U.S. history. False color imaging from Landsat that combines shortwave infrared and near-infrared bands shows growth of the city. Bright green is vegetation, so parks and golf courses are the brightest green; dark green is the forested areas in the Rocky Mountains; and the more mottled green shades are the residential areas of the city. Purple hues represent streets, highways, and other mostly unvegetated infrastructure. Denver is experiencing post-1950 growth similar to other western cities like Los Angeles, Phoenix, and Dallas. The Denver metropolitan area expanded in urbanized land from 150 square miles in 1950 to 499 square miles in 2000, primarily onto prairie and agricultural lands. |
Cities, Wildlife | |||||||||||||||||||||||||||||||
| Denver’s Urban Expansion | Image Comparison Sliders | airports, highways, land conversion, near-infrared, shortwave infrared, urban growth | ||||||||||||||||||||||||||||||||||
| Desert Patterns | Earth As Art | sand dunes | Seen through the "eyes" of a satellite sensor,… | Seen through the "eyes" of a satellite sensor, ribbons of Saharan sand dunes seem to glow in sunset colors. These patterned stripes are part of Erg Chech, a desolate sand sea in southwestern Algeria, Africa, where the prevailing winds create an endlessly shifting collage of large, linear sand dunes. The term "erg" is derived from an Arabic word for a field of sand dunes. |
||||||||||||||||||||||||||||||||
| Desert Ribbons | Earth As Art | rock | Rock folding on a tectonic scale occurred in… | Rock folding on a tectonic scale occurred in northwestern Africa. These motley ribbons dancing across the desert in Morocco are folds caused by the prolonged collision of tectonic plates. The long continuous line is Jbel Ouarkziz, a ridge that rises 200–300 meters above the valley floors. |
||||||||||||||||||||||||||||||||
| Desert to Forest | Earth As Art | volcanoes | In the American Southwest, transitions from one… | In the American Southwest, transitions from one ecosystem to another can be dramatic and abrupt. This certainly is true in northern Arizona, USA, where the parched Painted Desert, shown here in a palette of purples, adjoins Sitgreaves National Forest (shades of green), a realm of pine woodlands with abundant wildlife. Within the Painted Desert lie the Hopi Buttes, a field of ancient volcanic cones, seen here as a scattering of dark, circular shapes near the top of the image. |
||||||||||||||||||||||||||||||||
| Desertification | Earthshots | desertification, highway, sand dunes | The word desertification, if split into its… |
The word desertification, if split into its roots, logically would mean the event of non-desert land becoming desert, but it is not quite so simple. Desertification is usually defined as a process that happens to land that is already normally arid (dry) or semiarid and it's not just caused by drought. In fact, the crucial factor is a decline in the biological productivity of the land—the amount of vegetation that grows (either naturally or that people have planted)—as well as the animal life supported by the plants. If desertification continues, eventually the land becomes a desert, with increased wind and water erosion, decreased soil fertility, and decreased water-retention capacity. Plant and animal communities decline in number and diversity, as many species can no longer survive. Desertification is usually a patchy development, spreading outward from pockets of land where the vegetative cover has been harmed or destroyed, so that sandy dry soil begins to drift and vegetation is unable to reestablish itself. In western Africa, boreholes (water wells) are often the points of this vegetation disturbance, because they attract livestock, which overgraze the land nearby. But in this example, the point of disturbance is a paved highway that was built to connect Nouakchott, the national capital of Mauritania, with the regional capital Rosso. Besides travel and transportation, the highway also encourages building and settlement. All of these activities consume vegetation for grazing, fuel, and building material. The vegetative cover becomes disturbed, some sandy soil begins to drift, and the process of desertification is underway. In these images, the disturbances the highway causes become evident. The 1972 image shows the highway slicing across the desert's sand dunes. The other images show a widened corridor, the brighter tones that follow the highway. |
Deserts | |||||||||||||||||||||||||||||||
| Desolation Canyon | Earth As Art | canyons, rivers | Utah’s Green River flows south across the… | Utah’s Green River flows south across the Tavaputs Plateau (top) before entering Desolation Canyon (center). The Canyon slices through the Roan and Book Cliff--two long, staircase-like escarpments. Nearly as deep as the Grand Canyon, Desolation Canyon is one of the largest unprotected wilderness areas in the American West. |
||||||||||||||||||||||||||||||||
| Detailed Elevation Data—Niger River Delta | Image of the Week | deltas, elevation, estuaries, mangroves, rivers, tidal flats | Shuttle Radar Topography Mission (SRTM) data had… | Shuttle Radar Topography Mission (SRTM) data had previously only been available worldwide at 90-meter resolution. The National Geospatial-Intelligence Agency (NGA), NASA, and USGS are now releasing a newly processed, global SRTM 30-meter dataset. The above images show an example of the difference between the 90-meter and 30-meter data of the Niger River Delta in western Africa. The Landsat image, also at 30-meter resolution, of the same area shows the extensive coastal estuaries, tidal flats, mangrove forests, and lowland rainforests of this part of southern Nigeria. More detailed elevation data are especially critical in such coastal settings that have small elevation changes. For more information on the new SRTM elevation product, see the USGS Top Story here. |
||||||||||||||||||||||||||||||||
| Development Patterns | Earthshots | highways, population, suburbs, urban growth | The building of roads and streets… |
The building of roads and streets is a visible sign of urban expansion in Landsat images. Two new freeway interchanges show up in southwestern Sioux Falls in the 1995 and 1997 images. Once retail began expanding, new interchanges were needed to access the shopping and dining areas. After these new interchanges were built, additional development soon followed. In new residential neighborhoods, the street patterns appear white-blue in color at first. These areas gradually change to a mottled blue-red as time goes on. Red indicates plant growth—in these neighborhoods, as trees mature, they begin to obscure the streets that were once clearly visible. As new residential areas expand west and south, you can see the new neighborhoods appear bright white-blue in color because trees are still too small to block the satellite’s view of the homes and streets. A curious line appears in only the 2016 image, starting near the upper left, curving southeast, then bending straight east. This is the path of the Dakota Access Pipeline, which carries oil from the Bakken formation of North Dakota to Illinois. The line is not in the 2018 image as cropland or other vegetation regrew over it. The brightest part of the pipeline dig is on the west side of the image, near another bright spot, which is the regional landfill. |
Cities | |||||||||||||||||||||||||||||||
| Devils Lake, North Dakota, USA | Earthshots | algae blooms, flooding, floods, lakes, rivers | Devils Lake in northeastern North Dakota is a… |
Devils Lake in northeastern North Dakota is a closed basin lake. Located at the lowest point within its basin, Devils Lake has no outlet. The result is that the lake is more prone to significant lake level variations. Lately, it has only been rising. A USGS North Dakota Water Science Center graph shows the lake’s level has been higher in the past two decades than ever recorded.
|
Dams, Water | |||||||||||||||||||||||||||||||
| Diamond Mines, Northwest Territories, Canada | Earthshots | airport, diamonds, ice, ice road, lakes, open pit, tundra | The frozen tundra of northern Canada might not… |
The frozen tundra of northern Canada might not be the first place you’d look for a diamond mine. Diamonds are created under intense heat and pressure, yet here they are being mined in a cold, icy region. These mines are located about 320 kilometers (200 miles) northeast of Yellowknife and just 200 kilometers (124 miles) south of the Arctic Circle. The tundra here consists of boulder fields, wetlands, and over 8,000 lakes with interconnecting streams. The lakes are visible in the images as the numerous dark shapes. The two diamond mines visible in these images are Ekati and Diavik, both located in Northwest Territories, Canada. Ekati is in the northern part of the images. Diavik is in the southern portion and extends into the lake in the series of images. Most of the year, these mines are accessible only by air. An ice road is open for about 10 weeks of the year during winter. No other roads reach the mines. |
Mining, Water | |||||||||||||||||||||||||||||||
| Diavik Mine | Earthshots | airport, diamonds, ice, lakes, open pit, tundra | Production in the Diavik Mine began in January… |
Production in the Diavik Mine began in January 2003. By 2013, Diavik had produced 84 million carats. In this time series, you will notice something different about the mine pits of Diavik. The diamond ore is under the lake, so the pits were built in the lake. To protect the water of Lac de Gras, a dike was built before digging the pit. Construction is a challenge in this remote location with a short construction season. The dikes had to be completed when the lake was not frozen—only about a 4-month period. The first dike was made watertight in 2002 and was pumped dry 3 months later. Silty water was cleaned before being sent back to the lake. A smaller dike was completed in 2006. The dikes allow safe mining in the open pits. In September 2012, Diavik transitioned from an open-pit mine to an underground mine. More engineering and construction feats were needed for this change. Ventilation systems, pump stations, 12 miles of tunnels, vertical tunnels for ventilation and water removal, and other rooms make the underground mining possible. Diavik is expected to operate through 2023. Diavik has a private airstrip of its own. The 1,600-meter (1-mile) long runway can accommodate Boeing 737s. It’s visible in the images as the straight line north of the mining operations. |
Mining, Water | |||||||||||||||||||||||||||||||
| District of Columbia | Shaded Relief | Shaded Relief Images of specific areas (generally… | Shaded Relief Images of specific areas (generally by state) have been selected from the National Elevation Dataset. For original data details, see NED. |
|||||||||||||||||||||||||||||||||
| Dixie Fire Ravages Northern California | Image of the Week | infrared, shortwave infrared, smoke | The Dixie Fire has become the largest single fire… | The Dixie Fire has become the largest single fire in California's recorded history. State fire officials don't list it at the top, however. The record is held by the massive August Complex Fire of 2020 which burned over one million acres. The term "complex" is used when multiple fires in the same area ignite separately. Designating the fires as a complex allows them to be managed under a unified command. The Dixie Fire ignited on July 13th, 2021 near Cresta Dam in the Feather River Canyon. Nine days later the Fly Fire started 3.5 miles north of Quincy eventually merging into the much larger Dixie Fire. Hot weather and strong winds spread the blaze across national forests and into Lassen Volcanic National Park. These near-infrared and shortwave infrared images cut through smoke to highlight burned areas, while natural color versions of these scenes expose the massive amounts of smoke generated. |
||||||||||||||||||||||||||||||||
| Doha, Qatar | Earthshots | airport, artificial islands, FIFA World Cup, freeways, islands, land creation, land reclamation, pearl diving, pearls, roads, urban growth | Doha, the capital of Qatar, used to be a small… |
Doha, the capital of Qatar, used to be a small fishing and pearl diving village. It’s now Qatar’s largest city with skyscrapers and a fast-growing urban area. Doha is investing heavily in education, culture, and sports. The vast majority of Qatar’s population lives in metropolitan Doha. Oil was discovered in Qatar in 1937, and development began after World War II. Modern urbanization soon followed, and the country now has the highest per capita income in the world. After winning the bid to host the 2022 FIFA World Cup, Doha had a new motivation to develop its infrastructure. The Qatar government invested in new stadiums and improved public transportation systems. |
Cities, Coasts, Deserts | |||||||||||||||||||||||||||||||
| Dolan Springs, Arizona | Image of the Week | calibration | ||||||||||||||||||||||||||||||||||
| Dongguan | Earthshots | megacities, urban growth | The urban growth in the PRD is vast. There are… |
The urban growth in the PRD is vast. There are no longer any clear urban centers—a different growth trajectory from other large cities in China such as Beijing and Shanghai that have grown around defined historical urban centers. Buildings and paved surfaces replaced vegetation at a rapid pace over the past three decades. Housing, factories, and the highway system all increased mostly at the expense of farmland. In the early images of this series, cities are pink areas, separate from one another, among the green forested and agricultural areas. The largest city in this set of images is Dongguan. A noticeable change by the 1994 image is a road network beginning to connect those cities. The urban area soon begins filling in the former agricultural areas and surrounds the hilly forested areas. In the southern part of the images, blue rectangles are aquaculture, and they are gradually pushed toward the coast by the expanding urban areas. |
Agriculture, Cities, Coasts | |||||||||||||||||||||||||||||||
| Dongying | Earthshots | delta, erosion, rivers, sediment, shrimp farms, tidal flats | The city of Dongying is prominent in the 2010… |
The city of Dongying is prominent in the 2010 image. Its current population is over 1.2 million. But you won’t find the city in the 1976 or 1979 images because it isn’t there. Dongying was established in 1983 with the opening of an oilfield on the northern delta. Also noticeable in the time series images is the expansion of salt and shrimp farms, displayed by the dark geometric shapes along the coast. These farms were built on what were once tidal flats, a muddy coast that served as a buffer against storm erosion. Extensive development has degraded the tidal flats, resulting in increased coastal erosion. The aquaculture development on the delta can have positive effects. While many of the shapes seen in the images are salt fields, many are shrimp farms that have recently moved toward culturing different seafood such as sea cucumber and crabs. These species have a lower carbon footprint, and shellfish also help clean the coastal waters. Another species beginning to be farmed is algae, which are at the very bottom of the food chain. Algae, often used as a nutritional supplement, are great at sequestering carbon dioxide from the atmosphere. The rapid population growth in this area puts pressure on water resources and on the land, which has to grow increasing amounts of food. The region will need to plan carefully for the growth that accompanies economic development. |
Aquaculture, Cities, Coasts, Water | |||||||||||||||||||||||||||||||
| Dragon Lake | Earth As Art | ice, lakes, reservoirs, rivers | Nicknamed "Dragon Lake," this body of water is… | Nicknamed "Dragon Lake," this body of water is formed by the Bratskove Reservoir, built along the Angara River in southern Siberia, near the city of Bratsk. This image was acquired in winter, when the lake is frozen. |
||||||||||||||||||||||||||||||||
| Drought Conditions in California, USA | Image of the Week | drought, lakes, reservoirs, snow | After several consecutive years of below-normal… | After several consecutive years of below-normal precipitation, the U.S. state of California is preparing for its most severe drought emergency in decades. The current drought is due in part to decreased rainfall along with reduced winter snowpack in the Sierra Nevada mountain range. In 2013, California received less precipitation than any other year since it became a state in 1850. Water conservation efforts are already in place for many locations. For 2014, there is potential for major agricultural impacts, and the wildfire danger is expected to be unusually high. These three images show a portion of California’s Central Valley (left side of the images) and the neighboring Sierra Nevada mountains as viewed by Landsat in February 2011, 2013, and 2014. The decrease of winter snow cover can be seen in this progression of images. The reduction of available water supplies in the Central Valley is also indicated by the changing outlines of Folsom Lake, Camanche Reservoir, and other lakes and reservoirs in the images. The 40-year archive of Landsat imagery is useful for monitoring the changing conditions of Earth’s surface areas through time. |
||||||||||||||||||||||||||||||||
| Drought in Brazil | Image of the Week | Amazon, Brazil, drought, EROS, Image of the Week, Landsat, Rio Negro | The Amazon Rainforest in South America typically… | The Amazon Rainforest in South America typically experiences its drier season between the months of July and October. Satellite imagery from Landsats 9 and 8 show severe drought conditions in 2023 in comparison to 2022 when the area received average rainfall. Landsat satellites capture images of the withering watershed of the Rio Negro, the largest tributary of the Amazon River, every 8 days. |
Water | |||||||||||||||||||||||||||||||
| Dry Spell Depletes Northern California Reservoirs | Image of the Week | drought, lakes, reservoirs, water use | A prolonged dry spell has sparked woes over water… | A prolonged dry spell has sparked woes over water availability and wildfire in the western United States. This stretch of northern California is heavily reliant on man-made reservoirs. The recent history of a single Landsat scene can serve to illustrate the ripple effects of those severely parched conditions. Water levels have dropped in Folsom Lake, Indian Valley Reservoir, Black Butte Lake, where many fields have been left fallow, and Lake Oroville, which is home to the tallest dam in the United States at 770 feet. Each reservoir across this scene's 114 square miles has a wider shoreline today than it did in 2017, the last year with significant precipitation, most of which arrives in the winter and spring each year. Precipitation is more than 8 inches below normal for 2021, a rough start after a 2020 that ended more than 13 inches less than normal. The 2021 imagery shows evidence of another dry weather worry: large wildfires. The Bear Fire left a charred landscape in the fall of 2020, and scars surround a depleted Lake Berryessa. |
||||||||||||||||||||||||||||||||
| Dubai | Earthshots | artificial islands, irrigation, islands, land creation, roads, urban growth | About 5 million tourists visit Dubai every… |
About 5 million tourists visit Dubai every year and they have plenty to see and do. To attract tourists, Dubai developed the world’s fastest roller coaster, the world’s tallest building, and the world’s largest shopping mall. It also built fancy hotels, beaches, and even a huge indoor ski resort. In the first image of this series, desert fills much of the image. As Dubai expands, roads, buildings, and irrigated fields spread out over the desert. But the most prominent project in Dubai, and an impressive engineering feat, is the artificial islands built off its coast. The islands were built from sand dredged from the sea floor. Rock breakwaters protect them from erosion. These Landsat images show the rapid and impressive development of these islands. |
Cities, Coasts, Deserts | |||||||||||||||||||||||||||||||
| Dubai, United Arab Emirates | Earthshots | artificial islands, irrigation, islands, lagoons, land creation, roads, solar panels, solar power, urban growth | The United Arab Emirates (UAE) holds about 6%… |
The United Arab Emirates (UAE) holds about 6% of the world’s total oil reserves. The oil cannot last forever, so Dubai is thinking of the future. The fast-growing city, and most populous in the UAE, is diversifying its economic base by becoming a luxury tourist destination. Landsat can track the city’s urban growth, along with numerous other types of landscape changes. (Black stripes run through some of the images because of the Scan Line Corrector failure on Landsat 7 in May 2003.) |
Cities, Coasts, Deserts, Energy | |||||||||||||||||||||||||||||||
| Dubai's Islands | Image of the Week | artificial islands, islands, land conversion | ||||||||||||||||||||||||||||||||||
| Durrat Al Bahrain | Earthshots | artificial islands, islands, land creation, land reclamation, marina, population, tourism, urban growth | At the southern end of Bahrain is a sight that… |
At the southern end of Bahrain is a sight that can only really be appreciated from far above. The first residents moved to this group of artificial islands in 2009. Designed for residential living and tourism, the complex includes six atoll-like islands that surround five fish-shaped islands. These images reveal additional projects that are in progress throughout the region. The Crescent is the center and will be a commercial hub, with apartments, offices, restaurants, shopping, and a 600-room hotel. The Durrat Marina is under construction to the north and will provide space for 400 boats and yachts. A planned golf course will be built amid 2,220 luxury residential villas and apartments and take up about 90 hectares. When completed, the Durrat Al Bahrain will be able to accommodate 60,000 residents. Construction of the islands can be seen in the 2003 Landsat image. Many of the atolls have been developed. Look carefully at the 2014 and 2015 images. In just a matter of months, development began on the two southernmost fish-shaped islands. A 2023 image shows a more current view. (Black stripes run through the 2006 images because of the Scan Line Corrector failure on Landsat 7 in May 2003.) |
Cities, Coasts, Deserts | |||||||||||||||||||||||||||||||
| Dust Storms | Earthshots | dust storms, lake | Even with these reservoirs, dry lakebeds… |
Even with these reservoirs, dry lakebeds surrounding Zabol are problematic. A “120-day wind” blows in this region. These persistent spring and summer winds can cause dust storms in and around Zabol. Zabol reports dozens of dust storms every year. Clouds of dust from the lakebed cause breathing problems and can spread respiratory diseases. Many villages in the region have been abandoned. The August 2000 image shows an extensive dust storm blowing sediment off the dry lakebed toward the south. The dust plumes obscure most land features and reach to Lake Gowd-e Zareh and beyond. |
Deserts, Water, Wetlands | |||||||||||||||||||||||||||||||
| Early Start on the 2019 New South Wales Bushfire Season | Video - LP DAAC | |||||||||||||||||||||||||||||||||||
| Earth As Art | Earthshots | aquifer, calibration, center-pivot, irrigation, water use | The view of this region from Landsat is so… |
The view of this region from Landsat is so fascinating, it’s the subject of two Earth As Art images. These and all Earth As Art images can be downloaded for free from the EROS Image Gallery. |
Agriculture, Deserts | |||||||||||||||||||||||||||||||
| Earth As Art 1 | Video - Earth as Art | |||||||||||||||||||||||||||||||||||
| Earth As Art 2 | Video - Earth as Art | |||||||||||||||||||||||||||||||||||
| Earth as Art 3 | Video - Earth as Art | |||||||||||||||||||||||||||||||||||
| Earth as Art 4 | Video - Earth as Art | |||||||||||||||||||||||||||||||||||
| Earth As Art 5 | Video - Earth as Art | |||||||||||||||||||||||||||||||||||
| Earth as Art 6 | Video - Earth as Art | |||||||||||||||||||||||||||||||||||
| Earth Selfie | Earth As Art | irrigation | The tendency to recognize human faces in things… | The tendency to recognize human faces in things that are not human is common. Can you see the eye, nose, and mouth in this satellite image of Morocco? The face captured in this "Earth Selfie" appears to be quietly watching over the waters just off its coast. The city of Agadir is underneath the chin, and the irrigated farms of the Souss Valley appear in red. |
||||||||||||||||||||||||||||||||
| Earth’s Aquarium | Earth As Art | phytoplankton | These green and blue swirls in the Bering Sea… | These green and blue swirls in the Bering Sea reveal the bottom of the food chain in the ocean. Microscopic organisms called phytoplankton, which are important to fish populations, may be too small to be seen individually, but in vast numbers they are visible from space. The white clouds in the image look like bubbles in an aquarium. |
||||||||||||||||||||||||||||||||
| Earthquake and Tsunami Hit Sendai, Japan | Image of the Week | earthquakes, tsunamis | ||||||||||||||||||||||||||||||||||
| EarthShots - Satellite Images of Environmental Change | Video - EROS | The US Geological Survey's Earth Resources… | The US Geological Survey's Earth Resources Observation and Science Center, or "EROS" archive’s data from the Landsat satellites which have been in operation from 1972 to the present day. EarthShots presents environmental changes using Landsat images. Fresh lava flows from the 2018 eruption of the Kilauea volcano in Hawaii. Flooding caused by the category 3 Hurricane Katrina in New Orleans, LA. Center-pivot irrigation systems near Garden City, Kansas. Red indicates growing crops. Urban expansion in China's largest city. Farm fields become grasslands in the years after the nuclear accident in Chernobyl. Evaporation ponds on the southern dead sea. An open-pit copper mine in the Atacama desert. The Filchner Ice Shelf in Antarctica breaks up over time into large icebergs. Urban growth in the Dallas-Fort Worth metropolitan area. Healthy crops are red, and gray shows where hail wiped out cropland in the Sioux Falls, South Dakota area. Rainy weather in the 1980s brought the Great Salt Lake to high water levels. Shrimp farming on the coast of Central America The sediment-laden Yellow River forms a beak-shaped delta. A glacier blocks a fjord to form a temporary lake. Here we can see deforestation along with the formation of a large reservoir. Visible changes to the layout of farmland in the Netherlands. Different intensity of irrigated farmland on the US-Mexico border. Land reclaimed for agriculture behind a sea wall. Changing water levels in a Caspian Sea lagoon. Glaciers on Mount Kilimanjaro can be seen shrinking over time. The changing delta of the Omo River Kenya. Shifting locations of coal mines and reclaimed land in Ohio. Agriculture shown in red expanding from the banks of The Nile River across the tan colored desert Miles of rain forest in Brazil cleared for farming and grazing. Chile's expanding capitol city, with agriculture shown in bright red. New land adds to the island nation of Singapore. The path of a tornado is clearly visible through a small town. Large swaths of Bolivian rain forest are converted to agriculture. Expansion of Australia's largest city. Burn scars from annual fires in the Australian bush A rapidly retreating glacier along the Alaskan coast. Expanding open-pit diamond mines in northern Canada. Artificial Islands built off the Dubai Coast. Lake Chad in west Africa shrinks as green wetlands replace open water. Changing water levels in a closed basin lake, in Iran. Urban growth in Las Vegas, one of the fastest growing metro areas in the US. The 1980 eruption of St. Helens destroyed 150 square miles of forest. Palm oil plantations in the middle of undisturbed rain forest. Expanding phosphate mines in Florida and green reclaimed land. An expanding capitol city in the desert of Saudi Arabia. Evaporation ponds in a salt flat in the Chilean Desert Suburban expansion, pushing beyond the outer loop highways of San Antonio. Agricultural expansion using center-pivot irrigation systems in the Arabian desert. Lakes formed in the desert from water diverted from the Nile river, are then diminished over time. Fire scars from the 1988 wildfires in Yellowstone National Park. The shrinking of the Aral Sea, once the 4th largest lake in the world. Africa's tallest dam, and a large reservoir behind it. |
|||||||||||||||||||||||||||||||||
| Eastern Asia | Earth As Art | Eastern Asia is dominated geographically by China… | Eastern Asia is dominated geographically by China, which stretches from the Tian Shan Mountains in the west to the sheltered bays of the Yellow Sea in the east. |
|||||||||||||||||||||||||||||||||
| Eastward Expansion | Earthshots | highways, population, suburbs, urban growth | On the east side of Sioux Falls,… |
On the east side of Sioux Falls, cropland continues to give way to developed land. Many U.S. cities have grown with a similar pattern—people moving to suburbs instead of to the central part of cities. Suburbs changed from bedroom communities to having their own focal points for retail and service industries. Sioux Falls reflects this phenomenon at a smaller scale—both retail and residential development expand into these suburban-type areas. Note that the land is cleared first, noticeable as a pale smudge, and then street patterns emerge. Larger white blocks in the images are retail establishments, often with parking lots surrounding them. Retail development covers former farmland along a new highway called Veterans Parkway. The road eventually lengthens to meet up with Interstate 90 to the north, a strong hint at where more growth is planned. Northeast of this Sioux Falls expansion is the city of Brandon. There is starting to be less distance between Sioux Falls and Brandon. Since 1970, Brandon’s population has grown by over 500%, greatly outpacing the Sioux Falls metro population rate of growth during this time.
|
Cities | |||||||||||||||||||||||||||||||
| Edrengiyn Nuruu | Earth As Art | The Edrengiyn Nuruu forms a transition zone… | The Edrengiyn Nuruu forms a transition zone between the Mongolian steppes to the north and the arid deserts of northern China to the south. |
|||||||||||||||||||||||||||||||||
| Eel River | Earthshots | flooding, rain, rivers, weather | Just west of Clay City, there is a large,… |
Just west of Clay City, there is a large, nearly square-shaped area of floodwater in the 2008 flood image. It covers about 2,200 acres. The fact that this area became inundated indicates that it is low lying land. It’s possible that during the flood, water flowed from the nearby Eel River through a breach. The 2007 image shows this area as cropland, which is commonly low and flat. Roads, built up above ground level, could be causing the straight lines that appear around the water in the flood image. Interestingly, this spot was once an artificial reservoir, called the Splunge Creek Reservoir, that formed in the 1800s to supply water to the Wabash-Erie Canal, which no longer exists. |
Natural-Disasters, Water | |||||||||||||||||||||||||||||||
| Eerie Cloud Shadows | Earth As Art | clouds, shadows | These cloud patterns cast eerie shadows on the… | These cloud patterns cast eerie shadows on the landscape of southern Egypt. The clouds appear red and the desert below hazy blue in this infrared rendition. |
||||||||||||||||||||||||||||||||
| Effects of Drought | Image of the Week | drought, marshlands | ||||||||||||||||||||||||||||||||||
| Effects of Flooding: Hyères, France | Image of the Week | flooding, landslides, rain, sediment, weather | In mid-January 2014, unusually heavy rains in… | In mid-January 2014, unusually heavy rains in southeast France led to flooding, landslides, and evacuations. In some areas, up to 20 centimeters (8 inches) of rainfall occurred over three days, far exceeding the typical monthly totals. These Landsat 8 images show the area around Hyères, along with the Giens Peninsula (Presqu’île de Giens) and nearby islands. The two images were acquired on January 15, 2014 (one day before the rains began) and again on January 31, 2014. The bright blue colors in the right image show the flow of the sediment-rich floodwaters as they moved out into the Mediterranean Sea. |
||||||||||||||||||||||||||||||||
| Ekati Mine | Earthshots | airport, diamonds, ice, lakes, open pit, tundra | Ekati is Canada’s first diamond mine. Diamond… |
Ekati is Canada’s first diamond mine. Diamond ore bodies are called kimberlite pipes. These carrot-shaped pipes are the roots of ancient small volcanoes. Diamond-bearing kimberlite was discovered at Ekati in 1991. Construction of the mine started in 1997 and it officially opened in October 1998. By 2011, the Ekati mine had produced 50 million carats of diamonds. Ekati is the name the Tlicho people gave this area. It means “fat lake,” a reference to white quartz in the rock on the shore of Lac de Gras. The quartz looks like marbled caribou fat. Lac de Gras is the large lake south of the mines. You can see the mining operations expanding in this series of images. The Ekati mine includes open-pit mines in different locations. In the lower right is the Misery pit. It’s connected to the main base of operations by a road, visible as the curving pink or white line. Ekati has its own airport that’s used year-round. That’s how employees get there. The runway is visible as a straight line just south of where the first open pits begin appearing. The company that runs the Ekati mine, Dominion Diamond Ekati Corporation, monitors the air, water, and wildlife in the area. They are already planning ahead for the eventual closure of the mine and land reclamation. |
Mining, Water | |||||||||||||||||||||||||||||||
| Elburz Mountains, Iran | Earthshots | irrigation, rain-shadow effect, relief inversion | These images show the vicinity of the Elburz… |
These images show the vicinity of the Elburz Mountains in northern Iran. Tehran lies in the south, and the Caspian Sea is to the north. The Elburz Mountains run parallel to the southern coast of the Caspian Sea, and these mountains act as a barrier to rain clouds moving southward; as the clouds rise in altitude to cross the mountains they drop their moisture. This abundant rainfall supports a heavy rainforest (the bright red area) on the northern slopes. The valley to the south receives little precipitation because of this rain-shadow effect of the mountains. |
Agriculture, Cities, Mountains | |||||||||||||||||||||||||||||||
| Elephant Butte Reservoir | Image of the Week | drought, lakes, reservoirs | ||||||||||||||||||||||||||||||||||
| Elwha River Dam Removal, Washington | Image of the Week | reservoirs, rivers, sediment | In September 2011, the largest dam removal… | In September 2011, the largest dam removal project in U.S. history began. Two dams built on the Elwha River in the early 1900s created two reservoirs in northwestern Washington. They also greatly reduced the amount of sediment flowing to the river’s delta and blocked salmon migration upstream into Olympic National Park. A 2011 image from Landsat 5 shows the river before the dams were removed. The Lake Mills and Lake Aldwell reservoirs are visible along the river. After dam removal, images from Landsat 8 using shortwave infrared and near-infrared imaging reveal sediment blanketing the beds of the former lakes. Closer views show the river changing course over time. With the dams gone, the river deposits more sediment at the delta. Natural color images show sediment flowing into the ocean. A USGS animation shows the changing Elwha River delta. The animation is based on shaded relief elevation maps from summer topographic and bathymetric surveys. USGS scientists continue to monitor the river with aerial photos. |
||||||||||||||||||||||||||||||||
| Elwha River Restoration | Image of the Week | sediment | ||||||||||||||||||||||||||||||||||
| Empty Quarter | Earth As Art | sand dunes | White pinpricks of cloud cast ebony shadows on… | White pinpricks of cloud cast ebony shadows on the Rub' al Khali, or Empty Quarter, near the border between Saudi Arabia and Yemen. The lines of wind-sculpted sand are characteristic of immense sand deserts, or sand seas, and the Rub' al Khali is the largest desert of this type in the world. A highland ridge is just high enough to disturb the flow of the lines. In the center of that interruption lies the Saudi Arabian town of Sharurah. |
||||||||||||||||||||||||||||||||
| End of the Pu‘u ‘Ō‘ō Eruption | Earthshots | crater, eruption, island, lava, lava flow, volcano | Meanwhile, at the summit of Kīlauea, the… |
Meanwhile, at the summit of Kīlauea, the Halema‘uma‘u crater and surrounding caldera floor subsided throughout the summer of 2018. Kīlauea has something like a plumbing system connecting Halema‘uma‘u crater at the summit to the lower flanks of the volcano. The collapse at Halema‘uma‘u suggests the underlying magma reservoir largely drained into the lower East Rift Zone to feed the lava flows. Magma draining from the summit hints at the possibility of a quiet interlude at Kīlauea for several years. While April 30, 2018, marked the beginning of the recent lava flow event, it also marked the end of the continuous eruptive activity at Pu‘u ‘Ō‘ō that started in 1983. Although lava flowed from the East Rift Zone and devastated the Leilani Estates neighborhood, the April 30 collapse of Pu‘u ‘Ō‘ō crater left this eruption site devoid of lava. Since lava did not return to the crater after August 4, the USGS has said the Pu‘u ‘Ō‘ō eruption is over. However, the USGS Volcano Hazards Program says Kīlauea is still active and will erupt again. Volcano hazards in the area remain the same. Based on historical data, it’s unlikely that lava will erupt again from Pu‘u ‘Ō‘ō, but the East Rift Zone still has magma underneath, and it will erupt again through another vent. It may take several years for enough magma to accumulate again, but Kīlauea and the East Rift Zone remain very active. The USGS Hawaiian Volcano Observatory created a geonarrative to summarize the history of Kilauea eruptions and the 2018 lava flows. |
Coasts, Natural-Disasters | |||||||||||||||||||||||||||||||
| Enhanced Landsat 8 Image | Image of the Week | estuary, sediment | ||||||||||||||||||||||||||||||||||
| Environmental Effects | Earthshots | mangrove, shrimp, shrimp farms | The environmental implications of the shrimp… |
The environmental implications of the shrimp farm expansion are potentially far-reaching.
The loss of the mangrove forests leads to further problems.
|
Aquaculture, Coasts, Water | |||||||||||||||||||||||||||||||
| Environmental Problems | Earthshots | land leveling, urban growth | Images from Europe's Copernicus Sentinel-… |
Images from Europe's Copernicus Sentinel-2 satellites show a bit more detail than Landsat. These close-up views of Shiyan show the industrial development and land clearing at 10-meter resolution. Blue-topped rooftops are buildings for industry; light tan spots are leveled land. The hills that are being flattened vary in height from 100 to 150 meters. The material used to level the hills is used to fill valleys. However, building on this infill might not be best for urban construction. The soft soil from the infill subsides easily and is prone to landslides. Other environmental problems are cropping up based on this land leveling. The process of moving this much material throws dust particles into the air. Changing hills to plains has caused soil erosion, which adds sediment to local water sources. Shiyan is near the headwaters of the South-North Water Transfer Project, a huge project that diverts water to northern China. The sediments can end up in waterways, polluting the water. Furthermore, it can take years for the flattened ground base to be stable enough for building. |
Cities | |||||||||||||||||||||||||||||||
| Erongo Massif | Earth As Art | erosion, volcanoes | The dark heart in this vivid African landscape is… | The dark heart in this vivid African landscape is the Erongo Massif, an isolated, sheer-walled mountain that rises 1,200 meters (3,937 feet) above arid Namibian plains. The massif is a remnant of a gigantic volcano that was active roughly 150 million years ago. At some point, the volcano's center collapsed in upon itself under the weight of overlying lava. Eons of erosion by wind and wind-blown sand gradually exposed the long-dead volcano's core of granite and basalt. |
||||||||||||||||||||||||||||||||
| EROS History Timeline | StoryMaps | |||||||||||||||||||||||||||||||||||
| EROS Science Center Overview | Video - EROS | |||||||||||||||||||||||||||||||||||
| Eruption | Earthshots | ash, caldera, eruption, lahar, lakes, mud, mudflows, pyroclastic flows, rain, rivers, runoff, sediment, typhoon, volcanoes, weather | After the eruption, many areas near the… |
After the eruption, many areas near the volcano were stripped of vegetation. The series of images reveals the regrowth of vegetation, but it progressed at different rates. The eastern side recovered the fastest, where the area was mainly affected by falling ash. Wind and rain removed the ash, and most areas on this eastern side recovered to almost pre-eruption levels in about 7 years. The mountain’s western side experienced the worst of the pyroclastic flows, causing regrowth to be slower and more variable. In fact, some areas are still bare. A remarkable feature of the series of images, even in the most recent images, is that mudflows can still be seen trailing away from the mountain’s summit more than 30 years after the eruption. Runoff from monsoon rains and typhoons continued to erode and redistribute the pyroclastic deposits years after the 1991 eruption. Another change visible at this scale is the summit itself. The eruption caused the summit to collapse into a caldera about 2.5 kilometers wide. Water has collected in the crater to form a small lake. Landsat’s infrared bands set up a clear contrast between vegetation and lahar deposits. The images make it clear that the lahar hazards continued, and many occurred in inaccessible areas. Vegetation shows up as bright green, while the sediment and bare ground from lahars is pink. It also shows the progression of the revegetated areas on the mountain’s slopes. This progression is aided by additional scenes from Terra’s ASTER sensor. ASTER uses similar infrared bands to Landsat, and its 15-meter resolution reveals slightly more detail than Landsat’s 30-meter resolution.
|
Mountains, Natural-Disasters | |||||||||||||||||||||||||||||||
| Escondida Mine, Chile | Earthshots | copper, open pit, tailings | Isolated in Chile’s northern Atacama Desert,… |
Isolated in Chile’s northern Atacama Desert, the open-pit Escondida Mine is the world’s largest source of copper. Escondida means “hidden” in Spanish, and hidden it was. The copper ore was buried under hundreds of meters of rock. The only way it was found was by drilling along a line of other known copper finds that stretched hundreds of kilometers. Copper represents a substantial part of Chile’s economy. In 2013, copper mine production was valued at just over $30 billion. Chile is the world’s leading producer of copper, accounting for nearly 32% of world copper production. |
Deserts, Mining | |||||||||||||||||||||||||||||||
| ET Maps | Earthshots | evapotranspiration, irrigation, water use | With these water use maps, land managers and… |
With these water use maps, land managers and farmers can tell which crops use the most, or least, water at the field scale. From this, they can determine whether water could be used more efficiently. At the basin scale, large-area maps can be used to evaluate aquifer depletion and quantify groundwater pumping; or resolve water rights allocation disputes. The accompanying pair of seasonal ET maps (May–September) shows crop water use in the San Joaquin Valley in 1990 and in 2014. The colors correspond to millimeters of water returned to the atmosphere through ET. Fields that are green and blue show the highest ET values. Relatively more water has been used on those irrigated fields. Orange hues are areas that have very little ET, such as sparsely vegetated desert. Comparing the maps reveals changes in irrigation patterns during this period. Notice, for example, that water use intensified in many places (increase in blue areas) and some irrigated lands (green in 1990) transitioned out of agricultural production (reddish brown) by 2014. These water use maps can show not just seasonal ET but water used in a single day, or even over the course of decades thanks to the extensive Landsat archive. View the .gif animation below that shows an annual ET map for every year from 1984 to 2014. This map series shows flooding events around Tulare Lake Bed in 1984 and 1997. Accurate information on water availability and usage is necessary for planning sustainable use of water, particularly in an arid region like the southwestern United States. The study done for the San Joaquin Valley can become the basis for planning, monitoring, and assessing water use across the country. These maps can help farmers and land managers optimize and conserve water resources.
|
Agriculture | |||||||||||||||||||||||||||||||
| Etched in Snow | Earth As Art | rivers, snow | Is this a black-and-white image? No, this is a… | Is this a black-and-white image? No, this is a natural color image of snow-covered southwestern Russia. Windbreaks, roads, and fence lines look like random pencil marks near the Volga River, which flows across the top of the image. The thick lines are trees planted to protect fields from dry wind and erosion; these windbreaks retain snow, allowing more moisture to penetrate into the soil. |
||||||||||||||||||||||||||||||||
| Europe | Earth As Art | Europe is a modestly sized continent, only… | Europe is a modestly sized continent, only Australia is smaller, but its long, irregular coastline is riddled with bays, inlets, islands, and peninsulas, both great and small. |
|||||||||||||||||||||||||||||||||
| Every Pixel - Ground Stations | Video - Landsat | |||||||||||||||||||||||||||||||||||
| Every Pixel - Landsat's Orbit | Video - Landsat | |||||||||||||||||||||||||||||||||||
| Every Pixel - Landsat's Sensors | Video - Landsat | |||||||||||||||||||||||||||||||||||
| Every Pixel - Processing Data | Video - Landsat | |||||||||||||||||||||||||||||||||||
| Every Pixel - Recording Data | Video - Landsat | |||||||||||||||||||||||||||||||||||
| Expanding Oil Production in Mangystau Province, Kazakhstan | Image of the Week | land conversion, oil | ||||||||||||||||||||||||||||||||||
| Expansion at the Port of Rotterdam | Image of the Week | land conversion, ports, seawalls, shipping | A large infrastructure project has changed the… | A large infrastructure project has changed the shape of the coastline of the Netherlands while increasing the cargo capacity at Europe’s largest port. This pair of Landsat images spanning 15 years shows the Maasvlakte 2 project, which is an expansion of the Port of Rotterdam. The port provides accessibility for the transportation of cargo from Rotterdam to the rest of Europe. |
||||||||||||||||||||||||||||||||
| Expansion of the Suez Canal, Egypt | Image of the Week | canals, shipping | The Suez Canal is a man-made waterway connecting… | The Suez Canal is a man-made waterway connecting the Mediterranean Sea and the Red Sea. It is one of the world's most important waterways for trade, but the main channel was previously too narrow to allow ships to travel and pass in opposite directions. A massive expansion project was started in 2014 to increase the depth of the existing channels and create a separate shipping lane along a major portion of the Suez Canal. The project took one year to complete and included 22 miles (35 kilometers) of new channel near Ismailia, Egypt. This new shipping lane will dramatically shorten the travel times for ships traveling in both directions. This series of Landsat 8 images shows the area before, during, and after construction. The first image (August 2014) shows the Suez Canal near the time construction began. The new route is faintly visible in the second image (December 2014) while construction was in progress. The third image (August 2015) shows the completed and operational canal project, with the new shipping lane filled with water and clearly visible. The 40+ year archive of Landsat imagery is a valuable resource for monitoring land use changes over time. |
||||||||||||||||||||||||||||||||
| Expressions in the Desert | Earth As Art | erosion, sand dunes | In a remote part of the Western Desert in central… | In a remote part of the Western Desert in central Egypt, highly eroded plateaus rise from the desert floor. The bright speckles are ancient dry lakes, the salt deposits reflecting brightly. Long ago, water flowed off the plateau, forming the breaches seen on the plateaus’ edges. This desolate land between oases is surrounded by extensive sand dunes. |
||||||||||||||||||||||||||||||||
| Eye of Quebec | Earth As Art | craters, islands, lakes | Lake Manicouagan, Canada, is one of the Earth's… | Lake Manicouagan, Canada, is one of the Earth's largest and oldest known impact craters. The crater is 65 kilometers (40 miles) wide and is estimated to be about 214 million years old. The lake and island are clearly seen from space and are sometimes called the "Eye of Quebec." |
||||||||||||||||||||||||||||||||
| Eye of the Sahara, Mauritania | Image of the Week | erosion | Near the western edge of the Sahara Desert is a… | Near the western edge of the Sahara Desert is a feature that resembles a large eye when viewed from space. The Eye of the Sahara, also known as the Richat Structure or Guelb er Richat, is a symmetrical dome of eroded sedimentary and volcanic rock. The outermost rings measure approximately 40 km (25 miles) across. Persistent northeasterly winds keep much of the dome free from sand, exposing the various layers of rock. The circular feature was initially interpreted to be an asteroid impact structure, but most scientists have now concluded that it was caused by geologic uplift. This Landsat mosaic of four different scenes shows the geologic feature in false color. By blending visible and infrared wavelengths (bands), scientists can enhance the visibility of the various rock layers in contrast to the surrounding sand (yellow to white). The Eye of the Sahara is featured along with many other selected images in the USGS Earth as Art series: https://eros.usgs.gov/imagegallery. |
||||||||||||||||||||||||||||||||
| Facing the Tide | Earth As Art | rivers, sediment, tides | Rupert Bay, an arm of James Bay, extends into… | Rupert Bay, an arm of James Bay, extends into Quebec, Canada. Many rivers carry sediment into the bay and combine with seawater coming in from the tide. A prominent sediment stream extends past Stag Island and a vortex curls off Stag Rock in the middle of the bay. Sediment trails off the islands toward the mainland, indicating the tide was coming in at the time of image acquisition. |
||||||||||||||||||||||||||||||||
| Fanciful Fluorescence | Earth As Art | clouds | Fluorescent colors dominate this dreamlike scene… | Fluorescent colors dominate this dreamlike scene. The orange shapes look like glowfish in a fanciful underwater world. Those glowfish are actually clouds, and the neon green represents mountains, including Mount Rainier, near Seattle, Washington. |
||||||||||||||||||||||||||||||||
| Fangzhuang | Earthshots | urban growth | One new building project that exemplifies some… |
One new building project that exemplifies some of these trends is visible southeast of Beijing. Fangzhuang is a new city of 78,000 where in 1984 only 1,000 people lived in agricultural villages just outside the Outer City. In the 1977 image, agriculture, represented by red, dominates the area. By 2022, those lands have been swallowed up by development. Fangzhuang includes condominiums, 3-story apartment buildings, schools, parks, shops, and a community center. Such prestigious work-units as the Ministry of Foreign Affairs have bought blocks of apartments, and since 1994 some foreigners have moved in. Operations such as health care, day care, and garbage collection are still managed by socialist-style committees of residents. |
Cities | |||||||||||||||||||||||||||||||
| Fanned Out | Earth As Art | irrigation, rivers, water use | Water from the Balkh River fans out into an… | Water from the Balkh River fans out into an agricultural area toward an arid region in northern Afghanistan, near the border with Uzbekistan and Turkmenistan. Part of an ancient region called Bactria, extensive irrigation produces melons, almonds, apricots, and grains. Mazar-e Sharif is the urban area that dominates the lower right corner of the image. |
||||||||||||||||||||||||||||||||
| Farmland Inundated | Earthshots | flooding, lakes | The aerial photo from 1952 is black and white… |
The aerial photo from 1952 is black and white and doesn’t have the infrared imaging capability of Landsat, but it has something that Landsat doesn’t—very high resolution. It’s possible to locate trees and buildings in this image. Zooming in to an area near the lake is a location that is cultivated cropland. The sharp corners mark the different fields. Land here is divided into sections of 1 square mile. These extreme closeups show an area of land covering approximately six sections. This area shows three sections across and two sections high. A closer look shows farm buildings, with a shelterbelt of trees beside them. Later Landsat images reveal that those fields and structures are underwater.
* = Location of farm structures shown in the aerial photo closeup. |
Agriculture, Water, Wildlife | |||||||||||||||||||||||||||||||
| Faults | Earth As Art | faults, rock | When landmasses collide, rock layers can break.… | When landmasses collide, rock layers can break. Geologists call these breaks "faults." Rock layers are offset in this image in western China, making the faults remarkably clear. The different colors indicate rocks that formed at different times and in different environments. |
||||||||||||||||||||||||||||||||
| Festive Fields in North Carolina | Image of the Week | aerial photos, Christmas trees | The smell of a fresh cut Christmas tree can evoke… | The smell of a fresh cut Christmas tree can evoke visions of majestic evergreen forests teeming with winter wildlife. In truth, more than half of U.S. Christmas trees come from farms in Oregon, North Carolina, or Michigan. Cut Christmas trees are a commodity, tracked by the U.S. Department of Agriculture just like corn or soybeans. These USDA aerial images show tree harvest patterns over 12 years in Ashe County, North Carolina. It takes an average of seven years for a tree to grow to a sellable height. Harvest patterns are not always uniform. In some areas, trees are harvested from one field while those in neighboring fields are left to grow. On other fields, trees are thinned over time. Aerial imagery from the USDA is archived by EROS and available to the public at no charge, at Christmas time or any time at all. |
||||||||||||||||||||||||||||||||
| Filchner Ice Shelf, Antarctica | Earthshots | calving, crevasses, ice, ice shelf, icebergs | These images show the Filchner Ice Shelf on… |
These images show the Filchner Ice Shelf on the coast of Antarctica that faces the Atlantic Ocean. In the austral winter of 1986, the front edge of the Filchner Ice Shelf broke off into the sea, forming three large icebergs. This was a major, long-awaited calving. Most images in Earthshots are in “false color”; they are red/green/blue composites, representing three bands of Landsat data. These images of the Filchner Ice Shelf, however, represent only one band of near-infrared reflection, so they are grayscale. An ice shelf is a huge sheet of ice, connected to land but extending out into the ocean. Ice shelves develop mainly from glaciers flowing slowly downhill toward the ocean. “Upstream,” the ice shelf rests on land, but “downstream,” the ice shelf extends out onto and into the ocean, mostly below sea level. The Filchner-Ronne Ice Shelf is by volume the largest ice shelf on Earth. It is really one ice shelf, nominally divided by Berkner Island. Ice shelves are part of a cycle. Winds carry water (as clouds) to Antarctica, where it falls as snow, compacts into ice, flows slowly as glaciers into ice shelves, and then slowly progresses to the ocean, where chunks break off and are carried away by ocean and wind currents. These chunks are icebergs; the birth of icebergs (from glaciers, ice shelves, or larger icebergs) is called calving. It is widely known that most of an iceberg lies under water; this is also true of ice shelves. When a large piece of ice shelf calves into the ocean, it does not drop and splash down into the water, because the front of the ice shelf was already floating on water. In fact, the ocean’s tides lift and drop the ice shelf every day; this is called hinging, and the place where the ice shelf connects to the “shoreline” bedrock is called the hinge-line, since the outer shelf swings up and down from it. German scientists learned that the Filchner-Ronne Ice Shelf is two-layered. The top 150 m of ice came from snow and glaciers, but the bottom 80 m of ice came from the water below. This bottom layer is clear and bubble-free. The top layer is hard but snowy and bubbly. These bubbles (or “voids”) allow scientists to study atmospheric gasses trapped in the voids, by coring the ice. Antarctica has 90% of the world’s ice. Scientists are very interested in the net gain/loss of this ice mass because of its implications for world climate and sea level. |
Glaciers, Water | |||||||||||||||||||||||||||||||
| Fire | Earthshots | boreal forest, fire scars, near-infrared, shortwave infrared | You might have noticed that fire scars of… |
You might have noticed that fire scars of varying size show up in some of these images. These fire scars show up as red or maroon against the green vegetation. Fires are a part of life in the boreal forest, but in 2016, an unusually intense forest fire, fueled by dry conditions and high winds, devastated the region. The 80,000 residents of Fort McMurray were forced to evacuate, the largest evacuation on record in Canada. The fire destroyed 2,400 structures in and around Fort McMurray, and at least another 500 were damaged. Many structures still standing suffered smoke damage. At its peak, the fire moved 30 to 40 meters (98 to 131 feet) per minute. It burned a total of 589,552 hectares (nearly 1.5 million acres), and part of that area is shown in the series of images. Using shortwave infrared (SWIR) and near-infrared (NIR) bands to help penetrate clouds and smoke and create false-color images, Landsat shows the burned area in dark red. It’s clear that Fort McMurray was quickly surrounded by the blaze. Landsat’s infrared sensors are valuable for producing burn severity maps and other products quickly after images are acquired. |
Fires, Forests, Mining, Natural-Disasters | |||||||||||||||||||||||||||||||
| Fire and Rebirth: Landsat Tells Yellowstone’s Story | Image of the Week | burn scars, burn severity, logging, national parks | In the summer of 1988, a wildfire ravaged the… | In the summer of 1988, a wildfire ravaged the world’s first national park, consuming 1.2 million acres in and around the Greater Yellowstone Park ecosystem. Landsat imagery became an important record of the burn severity and recovery. As we celebrate the 100th anniversary of the National Park Service, which was established to better manage Yellowstone and other national parks within the Department of Interior, Landsat continues to prove the outstanding value of its land-monitoring mission. The June 2016 image, captured by Landsat 8, portrays the widespread recovery of tree cover and other vegetation within the 28-year-old burn scar. The national park’s western border is easily evident in images acquired shortly before and after the fire, on Sept. 22, 1987, and again on Oct. 10, 1988. A prohibition on logging in the national park is revealed in a dividing line of land use that shows dark green forests to the right of the park boundary, and the pink and light green hues of forest clearcuts to the left. |
||||||||||||||||||||||||||||||||
| Fire and Recovery | Earthshots | burn severity, fire scars, infrared, recovery | In these Landsat images, the old forest is… |
In these Landsat images, the old forest is dark green. In the 1987 image, this forest is occasionally broken up by lighter green grassy meadows or grassy plains. Geyser fields are pale blue and white. In a few places, a pink tinge may indicate old burn scars or dormant plants. The August 23, 1988, image was acquired when many fires were active. Smoke obscures some of the land, showing up as blue because the image uses infrared wavelengths of light. Land just burned is dark red. Lighter red patches are less severely burned. The band combination of shortwave infrared, near-infrared, and visible green highlights the changes in vegetation caused by the fires and recovery. Dark red burn scars fade over time as vegetation recovers. Grasses and wildflowers grow out of the ashes, and young trees begin to take root and grow. These light green areas start replacing the red and pink from the burn scar. As intense as the fires were, studies showed that less than 1 percent of soils were heated enough to sterilize the soil to kill belowground plant seeds and roots. Grass actually prospered in the rich soil immediately after the fires because of the release of nutrients and the decrease in shading from shrubs and trees. Less competition with other plants for resources also allowed grass to flourish. Even though grass flourished and saplings soon emerged, the recovery is gradual. Even in the 2011 and later images, the burned areas from 1988 can still be seen. The high elevation in this area causes a short growing season. With the hot, dry summers and cold, harsh winters, the forest will not return to its prefire conditions for decades. But recovery will continue. A few new fires show up in the later images to show that fire continues to be a part of the Yellowstone wilderness. |
Fires, Forests, Natural-Disasters | |||||||||||||||||||||||||||||||
| Fire in Greenland | Image of the Week | ice, near-infrared, shortwave infrared | It may seem surprising that wildfires burn in… | It may seem surprising that wildfires burn in Greenland, a huge island of ice and glaciers. But fires do happen there. Earth-observing satellites detected a fire in a remote area of western Greenland in August 2017. A relatively dry summer may have contributed to conditions that led to the igniting of willows, shrubs, grasses, and mosses in this coastal area. Landsat’s shortwave infrared (SWIR), near-infrared (NIR), and red bands combine to clearly show the difference between burned and unburned vegetation. Hazy smoke rises from the burned area to mix with a few bright, white puffy clouds in the August 12 image. |
||||||||||||||||||||||||||||||||
| Fire in Northern Australia: A 2023 Timelapse | Image of the Week | Australia, burn scar, EROS, fire, Image of the Week, Landsat, mosaic, northern, timelapse | The bushfire season in northern Australia… | The bushfire season in northern Australia generally runs from May to October. 2023 was an especially intense year in the north. Select infrared imagery from the Landsat archive was used here to produce a rolling mosaic timelapse of the landscape in eight day segments. Each new segment of imagery reveals fresh burn scars, increasing in size and frequency in October and November. Dry winters, fuel load and rising temperatures all play a role in the Australian bushfire season. Landsat imagery helps communities in Australia plan for fires and work to restore habitat. |
Fires, Natural-Disasters | |||||||||||||||||||||||||||||||
| Fires Across California | Image of the Week | smoke | Fires burned across California in late 2019. Fall… | Fires burned across California in late 2019. Fall is the state's most dangerous season for wildfires, propelled by dry and windy conditions. In recent years however, the fall fire season has been starting earlier and ending later. A series of images from the MODIS sensor on NASA's Terra and Aqua satellites show the Kincade Fire in northern California. This fire started on October 23rd. By the end of the month it had burned 77,758 acres. A strong wind from the northeast is evident as smoke billows from the fire toward the Pacific Ocean. Europe's Copernicus Sentinel-2 satellites captured more detailed images. The fire burned some areas already hit two years ago by the Tubbs Fire. Strong winds created small isolated fires seen as a pattern of hotspots in the images. Evacuation zones included the entire towns of Geyserville, Healdsburg, and Windsor, and the northern part of Santa Rosa. As the Kincade Fire burned in the north, several fires hit the Los Angeles area. A Landsat 8 image from November 6th shows scars of the Saddle Ridge, Getty, Tick, Easy, and Maria Fires. The Maria Fire was the largest in this region. It burned nearly 10,000 acres in just 6 days. Data from these three satellite systems complement each other to provide a complete picture of wildfires statewide. |
||||||||||||||||||||||||||||||||
| Fires Burn Farms and Ranches in Oklahoma and Kansas | Image of the Week | fire scars, near-infrared, shortwave infrared | Massive wildfires scorched nearly 780,000 acres… | Massive wildfires scorched nearly 780,000 acres of farm and ranch land in Oklahoma and Kansas in March 2017. The fires started on March 6, and dry conditions and high winds caused the fires to spread rapidly. The series of blazes damaged farms and ranches, and destroyed miles of fences. Many families lost most of their cattle herd, and several homes burned. The fires were considered contained by March 22. In Clark County, Kansas, the small town of Ashland, located about 40 miles south of Dodge City, had to be evacuated. Fire scars are prominent in Landsat 8’s March 17 image in vivid maroon tones surrounding Ashland, while green blocks of cropland are scattered throughout the image. Landsat’s shortwave infrared (SWIR) band measures reduced moisture content in soil and vegetation. When combined with its near-infrared (NIR) band, which helps reveal actively growing vegetation, Landsat produces highly accurate images and maps of burned areas. Landsat data can also be used to map the severity of the burn impact on soils and vegetation and to monitor the greenness or recovery of vegetation after the burn. |
||||||||||||||||||||||||||||||||
| Fires Burn Northern Mexico | Image of the Week | burn scars, drought | ||||||||||||||||||||||||||||||||||
| Fires in California, USA | Image of the Week | burn scars | A series of wildfires erupted along the coastal… | A series of wildfires erupted along the coastal region north of San Diego, California, in mid-May 2014. The first wildfire (Bernardo Fire) began on May 13, followed by several additional fires that occurred over the following days. At one point, firefighters were battling at least eight active wildfires and over 175,000 evacuation notices were issued. The Landsat 8 image (left) was acquired on May 9, 2014, and shows the area before the fires began. The Landsat 7 image (right) was acquired eight days later. The red tones show numerous areas that were burned as of May 17, 2014. The repetitive imagery provided by the Landsat satellites allows officials to evaluate the destructive impacts and monitor future recovery after disaster events such as these wildfires. |
||||||||||||||||||||||||||||||||
| Fires in Canada, May 2023 | Image of the Week | Smoke filled the skies over western Canada and… | Smoke filled the skies over western Canada and even much of the United States in May 2023. The source was several wildfires in Alberta and British Columbia. Near the end of May, rain and cooler temperatures finally brought some relief for the out-of-control fires. |
Fires, Natural-Disasters | ||||||||||||||||||||||||||||||||
| Fires in Lebanon | Image of the Week | burn scar, near-infrared, shortwave infrared | Wildfires burned across Lebanon in mid-October… | Wildfires burned across Lebanon in mid-October 2019. A pair of images taken just 10 days apart by the European Space Agency’s Sentinel-2A satellite show the burn scar from one of the larger wildfires. North of the fire scar is the country’s capital, Beirut. The October 18 image reveals several bright spots on city streets from numerous fires of a different type. These fires were set by protesters, burning tires and other debris to register frustration with government corruption, new taxes, declining public services, and an economic crisis. While Sentinel’s shortwave infrared and near-infrared bands capture burn scars, the brightness of reflected light from active fires saturates the sensors to show the locations of the hotspots. |
||||||||||||||||||||||||||||||||
| Fires in the Park | Earthshots | fire scars | Southeast Australia has a history of severe… |
Southeast Australia has a history of severe fire problems, with some historic deadly fires such as the Ash Wednesday fire of 1983, and lesser fires almost every year. The state of Victoria averages about 19 large fires (over 1,000 hectares) per year. These fires are often fast like grassfire but more intense. The winter rains that benefit wheat farming also aid the buildup of plant matter, which becomes highly combustible during the dry summers. Perhaps 60% of the fires in Wyperfeld are started by lightning, with the rest from various human accidents and purposes, including fuel reduction. Since the 1950s, Australians have systematically set controlled fires to reduce the risk of dangerous fires later. Wyperfeld staff currently set fuel-reduction fires along the park’s edges but fight all accidental fires, as required by law. These fires kill individuals, but communities of living things survive. Studies elsewhere in Victoria indicate that 2–4 years after a fire, the forest floor is again littered with small twigs and leaves, the habitat for many small animals. There are more plant species in the area than before the fire, though frequent burning certainly can kill out some species. Forest studies show that different post-fire stages favor different species; mice do well right after a fire, for example, but some birds do better in long-unburned or intermediate areas. Now that habitat is restricted to “islands” of parkland, there is danger of an entire park being burned out, with no adjacent communities to recolonize the burned areas. The Landsat images here show a stark change from unburned bush in 1977 to huge burn scars in the later images. The age of the scars can be estimated by their color; old scars are almost as dark as the bush, half-regrown scars are only pink, and the newest scars are very bright. |
Fires, Forests | |||||||||||||||||||||||||||||||
| Fires in the Western United States | Image of the Week | fire scars, near-infrared, shortwave infrared | On an average day during the fire season,… | On an average day during the fire season, multiple wildfires burn in the western United States. For example, 216 fires were active on July 7, 2017. Firefighters were battling 27 of these fires through ground and air support. A few of the larger fires in early July were in Arizona, Washington, and Utah. As with many wildfires, Landsat plays an important role in monitoring the spread of these fires and is the primary data source for mapping burn severity after the fires are contained. In these Landsat images, fresh fire scars are magenta, forest areas are green, cropland is bright green, and grasslands are indicated by duller green and pink hues. Landsat’s shortwave infrared (SWIR), near-infrared (NIR), and red bands combine to provide an accurate distinction between burned and unburned vegetation. The fires shown here started in mid- to late June and are all in steep, rugged terrain, which makes fighting the blazes difficult. The largest of these four fires is the Brian Head Fire in southwestern Utah, which has consumed more than 71,000 acres. Landsat 7 and 8 acquisitions help scientists continue to monitor the numerous wildfires in the West. They provide valuable data that assist land managers in understanding the impacts of fires and the need for resource rehabilitation and hazard mitigation. |
||||||||||||||||||||||||||||||||
| Fires Near Cape Town, South Africa | Image of the Week | fire scars | These two Landsat images show the urban area… | These two Landsat images show the urban area around Cape Town, South Africa. The more recent image (right) reveals scars from several fires that broke out in early March 2015, and were intensified by strong winds and hot summer temperatures. The dark fire scar on the left side of the March 11 image is from a fire that had started ten days earlier and burned more than 5,000 hectares (12,000 acres). The dark scar on the right side of the same image is from the Jonkershoek Fire, which started March 9 and was still active at the time this image was collected. About 4,000 hectares (10,000 acres) were burned before this second fire was contained. Landsat imagery is a valuable tool for the mapping and measurement of burned extent and lost vegetation due to wildfires. As the landscape begins to recover, Landsat will also be useful for monitoring the area’s regrowth and restoration. |
||||||||||||||||||||||||||||||||
| Fires Scar Alaska Landscape | Image of the Week | burn scars | ||||||||||||||||||||||||||||||||||
| Fires Scorch Northern Australia | Image of the Week | burn scars | ||||||||||||||||||||||||||||||||||
| Fires Tear Through Former Cane Fields | Image of the Week | burn scars, sugar cane | The waves of sugar cane that once defined the… | The waves of sugar cane that once defined the Hawaiian island landscape of Maui, have slowly given way to non-native annual grasses in recent decades. Those grasses have become a fire hazard along the way. The closure of central Maui's last large cane mill in 2016 opened up some 36,000 acres for new growth. Some of those acres burned in 2019 during one of the island's most active fire seasons. This false color Landsat image from July of that year shows the area after the fields went fallow, but before the fires took hold. What had been well-defined cropland in 2014, had become masses of brown vegetation. The second 2019 image shows the aftermath of a summer fire that blackened 25,000 acres. Landsat imagery and vegetation data from satellite-derived land cover datasets can help communities in Hawaii plan for fires, and work to restore habitat. |
||||||||||||||||||||||||||||||||
| Fires Worldwide as Seen by Landsat 8 | Image of the Week | burn scars, infrared, shortwave infrared | Landsat satellites acquire useful data on… | Landsat satellites acquire useful data on wildfires around the world. Their near infrared and shortwave infrared imaging allows for detection and mapping of fire, smoke, and burn scars often in remote areas. In California: the Dixie Fire near Lake Almanor and the Caldor Fire near Lake Tahoe. In Israel: over 6,000 acres in the Jerusalem Hills just west of Jerusalem. In Canada: active fire just west of Lake Winnipeg and a large burn scar from earlier in the summer. In Russia: numerous fires and burn scars in the Siberian region. In Greece: more than five times the yearly average of fire activity.
|
||||||||||||||||||||||||||||||||
| First U.S. Capitol Building and Wall Street | Image of the Week | buildings | ||||||||||||||||||||||||||||||||||
| Five Finger Plan | Earthshots | development, population, urban growth | In 1947, Copenhagen established the Five… |
In 1947, Copenhagen established the Five Finger Plan. The plan for the city’s growth designated five corridors of urban development, which were along railway lines to provide convenient transportation to Copenhagen’s business district in the central part of the city. Planned suburbs were to be built along these corridors and linked together like beads on a string. The development plan resembles a hand with five fingers stretching out away from the city center. The plan allowed for controlled urban growth while leaving space open for recreation and agriculture. These green spaces were to occupy the land between the fingers. As the series of images shows, the five fingers and hand shape are indeed vaguely recognizable. In these false-color images, the developed areas are shades of purple. Buildings and pavement are very reflective. On the other hand, water reflects very little sunlight, so it shows up as black. |
Cities | |||||||||||||||||||||||||||||||
| Flood Diversion Measures Along the Lower Mississippi River | Image of the Week | population, urban growth | ||||||||||||||||||||||||||||||||||
| Flooding along the Paraguay River | Image of the Week | flooding, rain, rivers, weather | Heavy rains starting in June have brought the… | Heavy rains starting in June have brought the worst flooding the country of Paraguay has ever seen. Thousands of residents have been displaced due to flooding of the urban and rural areas along the Paraguay River in this central South American country. These images, acquired by Landsat 8 on April 14, 2014, and July 19, 2014, show the Paraguay River, north of the city of Asuncion. The April image shows the area before the flooding began. The July image shows the dramatic change due to the flooding. Future Landsat data acquisitions will be useful in monitoring the affected areas. |
||||||||||||||||||||||||||||||||
| Flooding in Cambodia | Image of the Week | flooding, rivers, storms, typhoons, weather | ||||||||||||||||||||||||||||||||||
| Flooding in Fargo | Image of the Week | flooding, rivers | ||||||||||||||||||||||||||||||||||
| Flooding in Southeastern South Dakota | Image of the Week | flooding, hail, rain, rivers, storms, weather | In June 2014, southeastern South Dakota received… | In June 2014, southeastern South Dakota received record amounts of rainfall, and parts of neighboring states also received excessive rainfall due to a series of severe storms. As rivers overran their banks, many roadways became impassable and the rising waters damaged many homes and businesses. This area is an important agricultural region, and the heavy rainfall and accompanying hail damaged many of the recently planted corn and soybean crops. |
||||||||||||||||||||||||||||||||
| Flooding in the Balkan Peninsula | Image of the Week | flooding, rain, rivers, weather | The Balkan area of Europe received extraordinary… | The Balkan area of Europe received extraordinary amounts of rainfall during the month of May 2014, which led to the region’s worst flooding in more than 120 years of record keeping. |
||||||||||||||||||||||||||||||||
| Flooding in Tweed Heads, Australia | Image of the Week | flood, rain, river, sediment, weather | Europe's Copernicus Sentinel-2 satellites… | Europe's Copernicus Sentinel-2 satellites revealed flooding at Tweed Heads, New South Wales. Heavy rain that persisted for days in late February 2022 caused widespread flooding on Australia's east coast. The Harmonized Landsat and Sentinel-2 (HLS) project combines the two satellite programs to enable global observations of the land every 2–3 days at 30-meter resolution. As they flooded, the Tweed River and Terranora Creek carried runoff sediment into the ocean, shown with the lighter blue shade in the Sentinel images. The USGS distributes Sentinel data through its EarthExplorer portal. |
||||||||||||||||||||||||||||||||
| Florence Floods the Carolinas | Image Comparison Sliders | flooding, hurricanes, rain, rivers, storms, weather | ||||||||||||||||||||||||||||||||||
| Floriculture | Earthshots | floriculture, flowers, greenhouses, lakes, roses | The cut flower industry can be seen in Landsat… |
The cut flower industry can be seen in Landsat images near the lake in both outdoor fields and in glass greenhouses. The greenhouses are silvery in these views. The fields are a mix of green, tan, and purple. Tan and pink are fallow fields, and the green fields have growing plants. These fields and greenhouses have expanded over the time frame covered by these images. The flowers grown in the region include roses, carnations, statice, alstromeria, lilies, and hypericum. Since 1986, the nature of agriculture around Lake Naivasha has changed from mostly ranching to floriculture. The flower industry especially has led to increased population in Naivasha and the surrounding area. From 1969 to 2009, the population of the Naivasha Division increased more than 750%.
The flower farms use a lot of water from the lake and send nutrients and chemicals back to the lake. In addition, the increased population is placing more pressure on the freshwater resources in the region. As a result, the chemistry of the lake is changing. More blue-green algae and tiny crustaceans are appearing in the lake, which are food for flamingoes. The pink birds usually flock to lakes salty enough to find this food, so it was unusual to see them in abundance at Lake Naivasha. Floriculture began around Lake Naivasha in the early 1980s. During the 1990s and early 2000s, the amount of land dedicated to floriculture rapidly increased, changing from grassland and shrubland to flower farming. The increased water use led to a drop in the water level of the lake and an increase in farm runoff laden with agro-chemicals. |
Agriculture, Cities, Water | |||||||||||||||||||||||||||||||
| Florida | Shaded Relief | Shaded Relief Images of specific areas (generally… | Shaded Relief Images of specific areas (generally by state) have been selected from the National Elevation Dataset. For original data details, see NED. |
|||||||||||||||||||||||||||||||||
| Florida | State Mosaics | Founded by the Spanish in 1565, St. Augustine,… | Founded by the Spanish in 1565, St. Augustine, Florida is the oldest settlement of European origin in the United States. The Spanish fortress of Castillo de San Marcos in St. Augustine was built from 1672-1695 and is made of coquina, a soft, impact-absorbing stone composed of sea shells. |
|||||||||||||||||||||||||||||||||
| Florida Everglades | Earth As Art | national parks | Spanning the southern tip of the Florida… | Spanning the southern tip of the Florida Peninsula and most of Florida Bay, Everglades National Park is the only subtropical preserve in North America. It is the only place in the world where alligators and crocodiles exist side by side. |
||||||||||||||||||||||||||||||||
| FORE-SCE Land Use Model with Terry Sohl | Video - EROS | |||||||||||||||||||||||||||||||||||
| Forest Change Portrayed by Landsat Imagery | Image of the Week | tornadoes | On November 15, 2013, a new Global Forest Change… | On November 15, 2013, a new Global Forest Change survey was released. This online tool shows the forest change that has occurred worldwide from 2000 to 2012, and is based on the global repetitive observations by Landsat satellites during this time period. These example images show the observed changes in forest cover north and east of Tuscaloosa, Alabama. They also show the change after an EF5 tornado caused massive destruction on April 27, 2011. The two Landsat images show the forested areas in 2000 and 2011. The tornado path can be clearly seen in the second image. The derived Global Forest Change map for the same area (right) is based on repeated Landsat observations from 2000 to 2012. Red indicates net forest loss, and blue indicates net forest gain. Magenta indicates mixed activity (gain and loss) within this time interval. Green indicates no change to the forest cover, and black indicates nonforest. The overall mixed colors in the Global Forest Change map help to record the dynamic nature of the local forest land cover. The red streak clearly shows the forest loss caused by the 2011 tornado. The new Global Forest Change Web site is the result of collaboration between USGS, NASA, the University of Maryland, and Google. See the interactive map of global forest change at: http://earthenginepartners.appspot.com/science-2013-global-forest |
||||||||||||||||||||||||||||||||
| Forestry Research | Video - Landsat | |||||||||||||||||||||||||||||||||||
| Fossil Water | Earthshots | aquifer, center pivots, groundwater, irrigation, water use | The water that is used to grow these crops… |
The water that is used to grow these crops dates back to the last ice age. Known as fossil water, it has been buried deep underground for about 20,000 years. The agricultural fields are round because of a technique called center-pivot irrigation. Sprinkler systems move around a central pivot to water the field. The technique provides better control of water and fertilizer use, which is important where water can evaporate quickly. The fields shown in these close-ups vary in size. The largest circles are about 1 kilometer across. The drawback with this technique is that water in these aquifers is not recharged. Rainfall here averages only 100 to 200 millimeters per year, and that makes the groundwater in the area a nonrenewable resource. The amount of water stored in the aquifer under the desert ranges from 252 to 870 cubic kilometers. Hydrologists believe it will only be economical to pump this groundwater for about another 50 years. Groundwater irrigation here is only possible because of another nonrenewable resource—oil. The Saudi government used income from the sale of oil to fund these irrigation systems. Saudi Arabia spent billions of dollars developing agriculture in the last 15 years of the 20th century. In 2008, the Saudi government began phasing out domestic wheat production. By 2016, the country ended its domestic wheat production program because of concerns about the depletion of water reserves. However, since the announcement to phase out wheat, some farmers have begun growing forage crops to feed livestock, a less efficient use of water. |
Agriculture, Deserts, Water | |||||||||||||||||||||||||||||||
| Fractured | Earth As Art | ice, islands | Cracking ice on the Arctic Ocean fractures like… | Cracking ice on the Arctic Ocean fractures like broken glass in far northern Canada. Uninhabited Eglinton Island is the land on the right. Fingers of land from Prince Patrick Island stretch downward in the upper left of the image. |
||||||||||||||||||||||||||||||||
| Frank Island | Earthshots | fire scars, lakes | Besides some recovery from the 1988 fires on… |
Besides some recovery from the 1988 fires on the west side of Yellowstone Lake, this series of images shows the effects of another fire. Frank Island is the largest island in Yellowstone Lake. The island was set up as a protected area for ospreys that nest on the island. The public is not allowed on the island during the summer. Only a small picnic area on the southeast point is open for visitor use. On August 8, 2003, lightning struck Frank Island. An inferno quickly engulfed nearly all of the old growth trees. Most of the forest on the island burned. The first image in this series is from one week before the lightning strike that started the fire. The island appears deep green in the middle of the lake. In the other images, virtually no vegetation remains on the island. The green was replaced by pink, which indicates barren ground. |
Fires, Forests, Natural-Disasters | |||||||||||||||||||||||||||||||
| Free & Open Landsat Archive | Video - Landsat | |||||||||||||||||||||||||||||||||||
| From Chile to Your Smartphone | Image of the Week | evaporation ponds, lithium, salt flats | If you like being connected to the world… | If you like being connected to the world everywhere you go with a smartphone or other device, then you have a desolate salt flat in northern Chile to thank. The Salar de Atacama salt flat has the planet’s largest deposit of economically recoverable lithium, a key ingredient in rechargeable batteries. Landsat imagery shows the expansion of the lithium mining operations from 1991 to 2018. Located in Chile’s Atacama Desert, the salt flat has hard crusts of sodium chloride. Lithium-rich brine is pumped to the surface and sent via canals to evaporation ponds. The water evaporates efficiently in the dry environment and leaves behind concentrated salts. The ponds vary in color because of varying amount of salts in the water. The brighter ponds contain more concentrated salts. The deep blue ponds indicate more water content. Images created from Landsat data help monitor changes taking place on the Earth’s surface, along with the effects that resource extraction has on the local environment. |
||||||||||||||||||||||||||||||||
| Funny River Fire, Alaska | Image of the Week | smoke | The Funny River Fire was first discovered on May… | The Funny River Fire was first discovered on May 19, 2014. By early June, it had burned almost 200,000 acres in south-central Alaska, including much of the Kenai National Wildlife Refuge. The Landsat 8 image on May 4 shows the area before the fire began. Heavy smoke covers the Kenai Peninsula in the May 20 image, and this image also shows some of the areas of active burning (bright orange) along the edges of the wildfire area. On June 5, Landsat 8 captured the total extent of the burned area. |
||||||||||||||||||||||||||||||||
| Further Problems | Earthshots | canals, irrigation, rivers | Many projects were headed by loyal party… |
Many projects were headed by loyal party leaders with no technical skills, which is another reason the canals were not more effective. Teachers, technicians, and other skilled (usually urban) professionals—hated by the Khmer Rouge as corrupting urban influences—were executed. Thus, primarily inexperienced and unskilled citizens, including the evacuated city-dwellers, were forced to work in the countryside growing rice and building these irrigation works, with rigid work quotas and hard, slave-like conditions. The lack of experience led to inefficient canals that occasionally collapsed in the rain. Not only were the canals poorly constructed, but they also were built in straight lines, regularly spaced, at right angles along the 1-km gridlines of their military maps, ignoring hills, villages, and other topography. Some claim that many of the canals actually did more harm than good, disrupting natural water supplies and encouraging erosion. This pattern can be seen in most of these images. In more recent years, the irrigation system built during the Khmer Rouge regime is much less defined in satellite imagery. It appears in the images that each district had to dig a certain amount of ditches, whether needed or not. Indeed, workers had rigid daily quotas, so that some finished early and some could never finish. There were strict decisions about which varieties of rice were acceptable, diminishing the diversity of varieties which had adapted to local conditions. Though it is likely that by the end of the Khmer Rouge regime canal construction expertise had improved, the post-Khmer Rouge government had to devote considerable resources to repairing irrigation works. One official said 80% of the projects had been poorly constructed, though it varied by region. Although many of the canals were poorly built, some of them can still be used. The Cambodian Prime Minister Hun Sen started supporting the re-digging of the canals in 2005, and now that the people who are rebuilding them are no longer under the Khmer Rouge, they get paid a small amount, and the crops that are harvested aren't taken away by the government. |
Water | |||||||||||||||||||||||||||||||
| Future of 90-year old Yosemite Reservoir in Question | Image of the Week | lakes, national parks, reservoirs, rivers, water use | ||||||||||||||||||||||||||||||||||
| Gaborone, Botswana | Image of the Week | population, reservoirs, urban growth, water use | Gaborone is the capital and largest city in… | Gaborone is the capital and largest city in Botswana. Its current residential population is estimated at 250,000 within the city limits (450,000 when including the outlying areas). Almost all of this urban development has occurred within the last 50 years. Development of initial infrastructure began in 1963, and the city was formally established in 1966 on the eve of Botswana’s independence. Since that time, Gaborone has experienced rapid urban growth. This expansion is expected to continue as economic and commercial entities become further established there. The Gaborone Dam, south of the city, was completed in 1964 and provides critical water supply for the growing city. Within the last decade, the water levels have dropped significantly due to increasing water usage along with climate factors. In the early 2000s, the reservoir was estimated to be 80 percent full; as of December 2013, the water level of the reservoir reached its lowest point since the dam was built, at approximately 13 percent full. These Landsat images show the city of Gaborone and the surrounding area in 2001 and again in 2013. These images show the urban growth (gray) extending into the landscape in the later image. The images also show the reduction in size of the reservoir over the past 12 years. As urban populations continue to grow, the changing landscape and water resource management become important issues for community leaders. Landsat imagery provides repetitive views of the Earth’s surface which can help monitor urban growth patterns and other changes to Earth’s resources. |
||||||||||||||||||||||||||||||||
| Ganges River Delta | Earth As Art | deltas, rivers | The Ganges River forms an extensive delta where… | The Ganges River forms an extensive delta where it empties into the Bay of Bengal. The delta is largely covered with a swamp forest known as the Sunderbans, which is home to the Royal Bengal Tiger. |
||||||||||||||||||||||||||||||||
| Garden City, Kansas | Earth As Art | center pivots, irrigation, water use | Center pivot irrigation systems created these… | Center pivot irrigation systems created these circular patterns in crop land near Garden City, Kansas. The red circles indicate irrigated crops of healthy vegetation. The light-colored circles represent harvested crops. |
||||||||||||||||||||||||||||||||
| Garden City, Kansas, USA | Earthshots | aquifer, center-pivot, harvest, irrigation, population, river, water use, wildlife area | These Landsat images feature the significant… |
These Landsat images feature the significant growth in the use of center-pivot irrigation—essentially enormous sprinkler systems—in Kansas between 1972 and 2021. The Arkansas River flows east just south of Garden City in southwestern Kansas. From 1972 to 1990, Garden City's population grew from about 15,000 to about 24,000. The town's population as recorded by the 2020 Census stood at 28,151. Much of the former shortgrass prairie of western Kansas is now irrigated cropland. Common crops in this area are corn, wheat, and sorghum. Red areas in the images are healthy vegetation. Light-colored cultivated fields in the images are fallow or recently harvested wheat fields. These images show center-pivot irrigation systems (the small circles) multiplying between 1972 and 1988. From 1969 to 1987, irrigated acreage in Kansas increased by 62%, from 1.5 million acres to 2.4 million acres. In the five years from 1984 to 1988, Kansas farms with center-pivot irrigation systems increased 19%, from 2,630 farms to 3,122 farms. This area uses irrigation water from the High Plains Aquifer—also known as the Ogallala Aquifer—one of the world's largest aquifers, which underlies an area from Wyoming to Texas. Landsat images are useful for measuring irrigated crop acreage, a key component of modeling aquifer response to changes in water use. Landsat is also used to monitor the depletion of the aquifer, which is affected by not only the irrigation but also drought. |
Agriculture, Water | |||||||||||||||||||||||||||||||
| GEO | Video - EROS | |||||||||||||||||||||||||||||||||||
| Geometric Desert | Earth As Art | aquifers, center pivots, irrigation, water use | Geometric shapes lie across the emptiness of the… | Geometric shapes lie across the emptiness of the Sahara Desert in southern Egypt. Each point is a center pivot irrigation field a little less than 1 kilometer (0.6 mile) across. With no surface water in this region, wells pump underground water to rotating sprinklers from the huge Nubian Sandstone aquifer, which lies underneath the desert. |
||||||||||||||||||||||||||||||||
| Georgia | Shaded Relief | Shaded Relief Images of specific areas (generally… | Shaded Relief Images of specific areas (generally by state) have been selected from the National Elevation Dataset. For original data details, see NED. |
|||||||||||||||||||||||||||||||||
| Georgia | State Mosaics | Georgia is home to Okefenokee Swamp, a unique… | Georgia is home to Okefenokee Swamp, a unique area of primitive wetland that provides sanctuary for hundreds of species of birds and wildlife, including several endangered species. |
|||||||||||||||||||||||||||||||||
| Ghadamis River | Earth As Art | rivers | This scar on an arid landscape is the dry… | This scar on an arid landscape is the dry riverbed of the Ghadamis River in the Tinrhert Hamada Mountains near Ghadamis, Libya. |
||||||||||||||||||||||||||||||||
| Ghostly Grease Ice | Earth As Art | ice, islands | Ethereal swirls of grease ice appear turquoise… | Ethereal swirls of grease ice appear turquoise against the midnight blue of the northern Baltic Sea near the Aland Islands (red) between Finland and Sweden. An early stage of sea ice formation, grease ice consists of a viscous mix of tiny ice crystals and resembles an oil slick on the ocean's surface. Wind and currents constantly shape and reshape grease ice into surreal, ghostly patterns. |
||||||||||||||||||||||||||||||||
| Gibe III Dam | Earthshots | electricity, hydropower, irrigation, lakes, reservoirs, rivers | At nearly 244 meters tall, Gibe III is Africa’… |
At nearly 244 meters tall, Gibe III is Africa’s tallest dam and the continent’s third largest hydroelectric plant. Its estimated production capacity is 6,500 GWh a year. The first large dam on the Omo River, Gibe III takes its name from a tributary of the Omo, the Gibe River, on which two smaller dams were previously built. The Gibe I hydroelectric turbine was installed in 2004, and Gibe II in 2010. Gibe IV and Gibe V are planned to be built on the Omo downstream of Gibe III. Construction of Gibe III began in 2006. The reservoir, now 155 kilometers long, began filling in February 2015. The reservoir fills the entire canyon that the river flowed through. The dam began generating electricity later in 2015 and was fully commissioned in December 2016. The electricity generated by the dam is also exported to Kenya and other countries, bringing in hundreds of millions of dollars of revenue for Ethiopia. Electricity can also be delivered to Ethiopia’s rural areas, where just 26.5% of the population had access to electricity in 2015. Located 450 kilometers south of the capital Addis Ababa, the dam is also used to regulate floodwater and provide water for irrigation. However, the dam ended the natural annual flooding that brought nutrients to the banks of the Omo River. The lack of floods makes it more difficult to grow food there. An artificial regulated flow through the dam was intended to mimic this natural flood pulse. But the dam traps sediment, so even with regulated flow through the dam, there will still be impacts on wildlife and farming because of the reduced nutrients from this sediment. Because the Omo River accounts for 90% of the inflows to Lake Turkana in Kenya, there are major effects on the water levels and water quality of that lake, especially now that the water is used for other purposes such as large-scale irrigation. Furthermore, the reduced flow from the Omo causes increased salinity in Lake Turkana, which can affect some fish species. |
Dams, Energy, Water | |||||||||||||||||||||||||||||||
| Gibe III Dam, Ethiopia | Earthshots | electricity, hydropower, irrigation, lakes, reservoirs, rivers, sugar plantations | The great thing about hydropower is that it’s… |
The great thing about hydropower is that it’s a renewable nonpolluting source of power. Once it’s up and running, operation costs are relatively low, and the energy supply is very reliable. In the United States, most of the best locations for hydropower have already been taken (such as Hoover Dam near Las Vegas and the Glen Canyon Dam). Other countries are starting large hydro projects to further development and provide reliable power for more communities. In Ethiopia, for example, a series of large dams on the Omo River provide electricity for the country and enough to export to neighboring countries. They also provide irrigation water for large-scale agriculture. Hydropower projects of this scale often come with downsides as well. Large hydropower projects can have a massive effect on the landscape. Reservoirs can change local ecosystems and fish habitat, and sometimes displace large populations of people. In the case of the Gibe III dam, the rapid changes could have substantial effects on the people living downstream who depend on the river’s regular pulse floods for farming and fishing. Gibe III is the third hydropower plant on the Omo River, what they’re calling a hydroelectric cascade. The Omo River has a unique geo-political dynamic. The river is entirely contained within Ethiopia’s borders. However, the river empties into Lake Turkana, which lies almost entirely within neighboring Kenya to the south. |
Dams, Energy, Water | |||||||||||||||||||||||||||||||
| Gilli Gilli | Earthshots | logging, rain forest | Another forest reserve called Gilli Gilli lies… |
Another forest reserve called Gilli Gilli lies directly south of Okomu. Gilli Gilli has experienced less deforestation than Okomu—limited to smaller areas of degradation on its northern side. The low rate of degradation in Gilli Gilli could be because few settlements are located near it. This area is more inaccessible than Okomu. In Okomu, a farming system called Taungya was introduced in 1945. The plan allocated parts of the reserve to food crops. Trees were required to be planted on the same farm plots and would be allowed to be harvested as timber. In Okomu, however, migrant farmers often did not plant trees. In Gilli Gilli, however, the Taungya system was not introduced. The Landsat images do show moderate deforestation in its northern part, gradually spreading toward the southeast. However, this area’s inaccessibility has spared it from large-scale forest degradation. |
Forests | |||||||||||||||||||||||||||||||
| Glacial Changes in Chile | Image of the Week | ice, icebergs, lakes, proglacial lakes | The remote ice fields of southern Chile have seen… | The remote ice fields of southern Chile have seen some dramatic change over the past three decades; change made clear by Landsat's deep archive of imagery. In 1987, the terminus of Erasmo Glacier was at the end of a low sloping valley. By 2015 it had retreated almost 3 kilometers, and formed a water body referred to as a proglacial lake. The end of the glacier now lies about 4.3 kilometers from where it was in 1987. Landsat imagery reveals several icebergs in the lake. Over time, fewer icebergs appear, until the 2021 image shows an uncluttered body of water. Data from Landsat provide consistent measurements of remote glaciers over time, allowing long term monitoring. |
||||||||||||||||||||||||||||||||
| Glacial Retreat | Earthshots | ice, icebergs, lagoon, moraines, snow | A stable glacier advances a little in the… |
A stable glacier advances a little in the winter and retreats the same amount in the summer. Bear Glacier likely did this and gradually built up a terminal moraine. (A moraine is a buildup of glacial material, and a terminal moraine is one that is built up at the end of the glacier.) During the last 100 years in Alaska, the annual average temperature has increased by about twice the global annual average temperature change. A temperature increase like this can change the regular pattern of glacial advance and retreat. Between 1950 and the 1990s, Bear Glacier retreated 1.55 kilometers (1 mile). Small icebergs were calving into a lagoon that had developed. By 2004, the glacier’s floating terminus calved, causing an additional 2 kilometers (1.25 miles) of retreat. Between 2000 and 2007, the terminus retreated another 3.5 kilometers (2 miles). Large icebergs now float in the lagoon, visible in the Landsat images as light blue spots in the water. |
Glaciers, Water | |||||||||||||||||||||||||||||||
| Glacial Retreat Fills Alaska Lake | Image of the Week | icebergs, lakes | The visible impact of climate change on the Earth… | The visible impact of climate change on the Earth’s surface is often clearest in the Arctic’s receding glaciers and swelling glacial lakes. Southeastern Alaska’s Harlequin Lake is one of the fastest-growing in North America. These false color Landsat images show the rapidly-retreating Yakutat Glacier, which feeds the lake. Landsat can be used to illustrate the lake’s expansion by more than 15 square miles since 1999. The glacier flowed deep into the lake’s northeastern edge in the summer of 2000, the thicker ice above it shown as deep turquoise. The glacial retreat is starkly apparent a decade later as the icy edge pulls back and the thick turquoise tones give way to reveal clear lines of movement. The upper lake is nearly free of ice by 2020. |
||||||||||||||||||||||||||||||||
| Glacier Loss in Iceland | Image of the Week | ice, volcano | The island nation of Iceland is replete with… | The island nation of Iceland is replete with unique natural wonders and geothermal features, with a rugged interior defined by ice caps, glaciers, and volcanic peaks. Iceland had 269 named glaciers as of the year 2000, but ice has retreated in the face of warming temperatures. By 2014, Ok Glacier in western Iceland had lost so much mass that it was no longer considered one at all. Icelanders now refer to it simply as “Ok,” the name of the volcano upon which it rests. Landsat has recorded its decline for nearly five decades. This border shows Ok’s glacial footprint in the year 2000. The glacier spilled well outside that border in 1973. A growing gap between the glacial mass and the volcano’s summit crater is apparent by 1987. By 2019, just a smattering of ice remains. Declines in glacial mass are also evident in larger glaciers to the east of Ok. Glaciologists in Iceland who analyzed 80 years of records and concluded in 2014 that the country will lose all but its highest-elevation glaciers by the year 2200 if shrinkage continues at its current rate. |
||||||||||||||||||||||||||||||||
| Glacier Repeat Photography | Earthshots | ice, snow | USGS uses repeat photography of glaciers to… |
USGS uses repeat photography of glaciers to quantify changes in glaciers over time. Repeat photography is a technique in which a historical photograph and a modern photograph, both having the same field of view, are compared. For example, oblique aerial photographs of Bear Glacier were taken facing north and show glacial retreat along with icebergs floating in Bear Glacier Lagoon. Photographs taken from the ground look north and were from the same location on the eastern part of the terminus of Bear Glacier. In the 96 years between photographs, Bear Glacier has retreated more than 3 kilometers (1.9 miles) and thinned by as much as 200 meters (656 feet). Only a very small part of Bear Glacier is visible from this location today, and the terminus is obscured by the trees. |
Glaciers, Water | |||||||||||||||||||||||||||||||
| Glen Canyon Dam | Earthshots | hydropower, lakes, marinas, reservoirs, rivers, water use | … |
Glen Canyon Dam near Page, Arizona, creates Lake Powell. The 710-foot-high dam was completed on September 13, 1963, about 9 years before the first clear Landsat 1 images were acquired. The dam also generates electricity. From 1980 to 2013, its average annual gross electricity generation was about 5 billion kwh. (kwh = kilawatt-hours, a measure of a power station’s electricity output.) Its electricity generation varies based on the amount of water that flows into the lake, which is influenced by precipitation. In the Landsat series of images shown here, we begin with 1972 when the lake was still filling. In 1984, the lake was at one of its highest water levels. Near the dam is the city of Page, Arizona, which began in 1957 as a housing camp for workers building the dam. Page is now a major resort area. Its 2021 population was 7,375. At various marinas on the lake, tourists can rent houseboats and other recreational watercraft. Wahweap is the largest marina on Lake Powell. This marina needs to move based on the lake’s water level. Antelope Point is the newest marina on Lake Powell, established in 2004. Antelope Island is in the center of these images. It looks a lot less like an island in the later low water level images. The National Park Service dug a channel on the island’s north end called Castle Rock Pass. Even though it begins to look more like a peninsula by the 2005 image, it is still called Antelope Island. The channel around the north side of the island is navigable when the lake’s water level is 3,620 feet or higher. |
Dams, Water | |||||||||||||||||||||||||||||||
| Global Forest Maps | Earthshots | monarch butterflies | Researchers from the University of Maryland… |
Researchers from the University of Maryland and USGS have mapped changes in forests globally from 2000 to 2013. The maps displayed here are from that database and are paired with a corresponding Landsat image. The study defined trees as all vegetation taller than 5 meters. In the forest change map, green indicates forest extent, and red is forest loss during the period 2000–2013. Any blue that appears is forest gained during that time period. Black is land that was non-forest during the time period. The study used data from over 650,000 Landsat scenes and used 143 billion 30-meter Landsat pixels. |
Forests, Wildlife | |||||||||||||||||||||||||||||||
| GOES-16 and Landsat 8 | Image Comparison Sliders | near-infrared | ||||||||||||||||||||||||||||||||||
| Goksu River Dam Project | Image of the Week | hydropower, lakes, reservoirs, rivers, water use | ||||||||||||||||||||||||||||||||||
| Google's Earth Engine with Noel Gorelick | Video - Landsat | |||||||||||||||||||||||||||||||||||
| Gosses Bluff | Earth As Art | craters | 142 million years ago, an asteroid or comet… | 142 million years ago, an asteroid or comet slammed into what is now the Missionary Plains in Australia's Northern Territory, forming a crater 24 kilometers in diameter and 5 kilometers deep. Today, like a bull's eye, the circular ring of hills that defines Gosses Bluff stands as a stark reminder of the event. |
||||||||||||||||||||||||||||||||
| Grampians Fire, Australia | Image of the Week | burn scars | On January 15, 2014, lightning sparked a… | On January 15, 2014, lightning sparked a brushfire in Grampians National Park in the State of Victoria in southeastern Australia. The combination of dry, hot weather and strong winds contributed to a rapidly spreading complex. The fire became so intense it created a 12-km (7.5-mi) wide convection column that created its own weather, generated lightning strikes, and sparked many smaller spot fires. |
||||||||||||||||||||||||||||||||
| Grand Canyon Perspective | Image of the Week | canyons, elevation | ||||||||||||||||||||||||||||||||||
| Grand Canyons | Earthshots | aerial photos, iron ore, open pit, tailings ponds | Other mines also continue to expand, even in… |
Other mines also continue to expand, even in the Landsat era. The Hull-Rust-Mahoning Mine near Hibbing is one of the biggest mines in the world. Some call it the “Grand Canyon of the North.” Rather than a natural wonder, the 535-foot-deep mine is another huge open pit gouged into the Mesabi Range and expanded over the decades. In the Landsat images, it’s still the tailings basin that stands out and takes up more land area. The mine itself is between the tailings basin and the city of Hibbing. Both the basin and the mine expand during this time series of Landsat images. Another tailings pond expands farther to the south. This is the Keetac mine and tailings basin. Another USGS aerial photo shows part of this area pre-Landsat. The Hull-Rust-Mahoning open-pit mine is just north of Hibbing in 1953, but the current tailings basin had not been established yet. |
Mining | |||||||||||||||||||||||||||||||
| Grand Ethiopian Renaissance Dam, Ethiopia | Earthshots | hydropower, reservoirs, rivers, water use | The reservoir behind the largest hydropower… |
The reservoir behind the largest hydropower plant in Africa has begun filling. Under construction since 2011, the Grand Ethiopian Renaissance Dam (GERD) is 1.1 miles long, 509 feet tall, and spans the Blue Nile River in Ethiopia. The GERD reservoir is in a deep gorge, so its surface area is relatively small compared to its volume. This means less water will be lost to evaporation than in desert reservoirs. The lake’s capacity is about twice the volume of Lake Mead. Including the Aswan High Dam in Egypt, which forms Lake Nasser and has the capacity of four times the volume of Lake Mead, two of the world’s largest dams are now on the Nile River system, in two different countries. The first phase of GERD reservoir filling began in summer 2020. The curved shape southwest of the main dam is referred to as the Saddle Dam, and the reservoir reached it for the first time in 2022. Landsat imagery may make it look like the lake is filling at a rapid pace, but filling the reservoir is still a gradual process. Filling too quickly could lead to hydrologic water shortages downstream, especially if a drought hits at the time. |
Dams, Energy, Water | |||||||||||||||||||||||||||||||
| Granja Porcón | Earthshots | afforestation | Just west of the mining area, a dark green… |
Just west of the mining area, a dark green patch of land emerges in the time series of images. This is a cooperative farm called Granja Porcón. The 12,000 hectares of land in the cooperative were originally grassy plains. The dark green area on the images indicates the effects of an afforestation project. Granja Porcón includes a nursery that produces over a million seedlings per year, and the forest plantations provide wood as a source of income for the local population. Pine species are planted in this location because of their resistance to cold at high elevation. Tourists can visit and work alongside the residents of the cooperative in day-to-day tasks, such as milking cows or working in the fields. |
Mining | |||||||||||||||||||||||||||||||
| Great Barrier Reef | Earth As Art | coral | What might be mistaken for dinosaur bones being… | What might be mistaken for dinosaur bones being unearthed at a paleontological dig are some of the individual reefs that make up the Great Barrier Reef, the world's largest tropical coral reef system. The reef stretches more than 2,000 kilometers (1,240 miles) along the coast of Queensland, Australia. It supports astoundingly complex and diverse communities of marine life and is the largest structure on the planet built by living organisms. |
||||||||||||||||||||||||||||||||
| Great Salt Desert | Earth As Art | lakes, marshes | Like swirls of paint on an enormous canvas,… | Like swirls of paint on an enormous canvas, shallow lakes, mudflats, and salt marshes share the sinuous valleys on Iran's largely uninhabited Dasht-e Kavir, or Great Salt Desert. |
||||||||||||||||||||||||||||||||
| Great Salt Lake 1985-2010 | Image of the Week | drought, lakes, rivers, saltwater | ||||||||||||||||||||||||||||||||||
| Great Salt Lake North Arm Reaches Record Low | Image of the Week | evaporation ponds, lakes, saltwater | The water level of the north arm of Great Salt… | The water level of the north arm of Great Salt Lake, Utah, has reached a record low elevation of 4,191.6 feet, 1 foot below the previous record. Lower snowpack in recent years has lessened the spring runoff flowing into the lake. These Landsat images show the change in water levels between 2011 and 2015. |
||||||||||||||||||||||||||||||||
| Great Salt Lake, Utah | Image of the Week | lakes | ||||||||||||||||||||||||||||||||||
| Great Salt Lake, Utah, USA | Earthshots | algae, drought, flooding, lakes, salt, saltwater, water use | These images show the dramatic effects of the… |
These images show the dramatic effects of the Great Salt Lake's high water levels in the 1980s. These effects included a great increase in the lake’s area, the opening of the causeway crossing the lake, and the creation of a new evaporation basin west of the lake. The Great Salt Lake is a terminal lake, with no outlet rivers running to the ocean. Since water leaves the lake only through evaporation, it leaves behind its dissolved minerals, making the lake up to 8 times as salty as seawater. The lack of outlets also means the lake responds dramatically to change in inflow. Rainy weather beginning in 1982 brought the highest levels in recorded history, peaking in June 1986 and March–April 1987. The lake is shallow for its size—about 70 miles long and 30 miles wide, but only about 40 feet deep. Because the lake basin is so shallowly sloped, extra inflow to the lake makes it rise only slowly, but any rise means a large increase in area. Highways, causeways, and parts of Salt Lake City were flooded or threatened in the 1980s, costing millions of dollars. Long-term drought and water use led to Great Salt Lake reaching its lowest level on record in November 2022. This low level of the lake can increase dust pollution and reduce mineral extraction, shrimp production, waterfowl habitat, and recreational opportunities. Landsat imagery shows the lake shrinking from June 2022 to October 2022, then slightly expanding in 2023. Landsat has been monitoring the lake for over 50 years, and will keep tracking the water level changes. |
Water | |||||||||||||||||||||||||||||||
| Great Sandy Desert | Earth As Art | The western region of Australia's Great Sandy… | The western region of Australia's Great Sandy Desert is an area almost devoid of sand, but characterized by complex geology. |
|||||||||||||||||||||||||||||||||
| Great Sandy Scars | Earth As Art | burn scars, sand dunes | In a small corner of the vast Great Sandy Desert… | In a small corner of the vast Great Sandy Desert in Western Australia, large sand dunes—the only sand in this desert of scrub and rock—appear as lines stretching from left to right. The light-colored fan shapes are scars from wildfires. |
||||||||||||||||||||||||||||||||
| Greater Chesapeake Bay Region | Image of the Week | |||||||||||||||||||||||||||||||||||
| Greeley | Earthshots | freeways, urban growth | Other urban centers near Denver are also… |
Other urban centers near Denver are also growing quickly. While the population of the Denver metropolitan area increased by 84% between 1990 and 2022, Greeley, about 40 miles north of Denver, increased by 80.4% in the same time period. In these false color images, residential areas are a mottled green, with streets, highways, and other infrastructure showing up in purple hues. The brightest green spots are golf courses, parks, and other areas that have growing green grass. Bright green circles and rectangles are farm fields. In fact, just about everything that is green in these images away from the mountains is irrigated. Other expansion seen in these images is the petroleum and natural gas industry. An increased number of bright spots indicates more oil and gas wells.
|
Cities | |||||||||||||||||||||||||||||||
| Green Cropland in Northwest China | Image of the Week | irrigation, water use | ||||||||||||||||||||||||||||||||||
| Greenland Coast | Earth As Art | ice | Along Greenland’s western coast, a small field of… | Along Greenland’s western coast, a small field of glaciers surrounds Baffin Bay. |
||||||||||||||||||||||||||||||||
| Growing Season to Harvest | Earthshots | center-pivot, harvest, irrigation, water use | These 2021 images show the seasonal… |
These 2021 images show the seasonal progression of the irrigated crops in this area, from around the peak of the growing season to harvest. The August image is at the height of the growing season, and the November image is after many fields have been harvested. The harvested fields are a conspicuous white and not red because the vegetation has been removed. |
Agriculture, Water | |||||||||||||||||||||||||||||||
| Growth and Housing | Earthshots | population, suburbs, urban growth | From 1975 to 2020, Santiago’s population… |
From 1975 to 2020, Santiago’s population increased from under 3.5 million to just over 7 million. In the late 1970s, housing shortages were increasing, particularly for the poor. In the early 1990s, Santiago’s elites moved to the northeastern suburbs to escape the city center’s increasing congestion, retail, and rural immigrants. The affluent Barrio Alto district is in this quarter, flanked by the Andes and the San Cristobal Hills. A squatter settlement existed in the Barrio Alto, housing many domestic servants and workers for wealthy households nearby, until the mid-1970s when the government evicted them. A park in place of the squatter settlement was discussed, but instead one of Chile’s largest shopping malls, the Parque Arauco, was built. The former squatters were resettled in public housing in the southeastern part of the metropolitan area. This followed the pattern of the military government: slum clearance in the city’s center and northeast, with a shift to public housing on the urban fringe, which has been called “the bedroom community of the working poor.” The bulk of metropolitan growth since the World War II has in fact been along the southern edge, where the Central Valley widens and land is relatively cheap. In the mid-1970s, the government bought large tracts of agricultural land and committed its housing resources in this area. The government’s “making neighborhoods healthy” (saneamiento) program has brought services such as water, sewer, and electricity to much of this housing. A Bit of Trivia |
Cities | |||||||||||||||||||||||||||||||
| Growth of Nucleos | Earthshots | rain forest, soybeans | In the 1975 image, the initial clearing for… |
In the 1975 image, the initial clearing for the San Julian settlements is visible along the highway—the pink line heading north-south. Later images show a well-defined 3x3 box pattern with roads connecting them. The United States Agency for International Development (USAID) helped fund new roads along with wells and community center clearing. In the middle of the two groupings of nucleos is a clearing of a different pattern. This is the Zapito private farm, which is not part of the San Julian colonies. |
Deforestation, Forests | |||||||||||||||||||||||||||||||
| Guangzhou and Foshan | Earthshots | megacities, urban growth | As an example of how the cities of the region… |
As an example of how the cities of the region have merged after the 1978 reforms, these images are a closer look at Guangzhou and Foshan. Even in 2000, they were clearly separate cities. The land between them then fills in with urbanization. The 2017 image shows the appearance of what appear to be several black dots between the two cities. These are high-rise residential buildings. They look a little similar to the fish ponds, but these are a bit smaller, and they are dark because of the shadows they cast on the ground. |
Agriculture, Cities, Coasts | |||||||||||||||||||||||||||||||
| Guinea-Bissau | Earth As Art | rivers | Guinea-Bissau is a small country in West Africa.… | Guinea-Bissau is a small country in West Africa. Complex patterns can be seen in the shallow waters along its coastline, where silt carried by the Geba and other rivers washes out into the Atlantic Ocean. |
||||||||||||||||||||||||||||||||
| Gulf of Fonseca, Honduras and Nicaragua | Earthshots | mangrove, salt flats, shrimp, shrimp farms, volcano | Honduras is one of Latin America’s top… |
Honduras is one of Latin America’s top producers of cultured shrimp. Since the 1980s, vast areas of land have been converted to shrimp farms around the Gulf of Fonseca along the Honduras-Nicaragua border. But there are concerns about the environmental impact of this industry on the gulf’s wetlands. |
Aquaculture, Coasts, Water | |||||||||||||||||||||||||||||||
| Gypsy Moth Infestation Continues in New England | Image of the Week | insect infestation | A large outbreak of gypsy moth (Lymantria dispar… | A large outbreak of gypsy moth (Lymantria dispar) caterpillars attacked the hardwood forests of the northeastern United States in 2016. A fungus (Entomophaga maimaiga) introduced from Japan has kept gypsy moth populations at relatively low levels since the late 1980s. However, abnormally low rainfall during May and June in 2014, 2015, and 2016 reduced the effectiveness of the fungus, resulting in the worst outbreak seen in New England in over 30 years. Gypsy moth caterpillars devour the leaves of hardwood trees, causing the greatest damage in late June as the larvae reach maturity. While the gypsy moth caterpillars thrived in the 2016 drought conditions, this spring's rainfall made the fungus effective again and caused high levels of mortality. However, mortality reached a peak at the end of the larval stages, after the caterpillars had already caused most of the damage. Oak-dominated forests in Rhode Island and eastern Connecticut were hit particularly hard this year. Valerie Pasquarella, a Postdoctoral Research Associate at the University of Massachusetts Amherst, is using Landsat data to track the spread of the outbreak and monitor defoliation. She compares newly acquired Landsat observations with long-term average conditions derived from Landsat time series to detect changes in vegetation greenness in near-real time. Individual near-real-time assessments can also be combined to produce wall-to-wall assessments of average potential damage over the course of the growing season. In these season-integrated maps, blue indicates forest conditions that are within the normal range of variability, while yellow, orange, and red show decreases in vegetation greenness indicative of defoliation. The 2017 image is preliminary and represents an averaged view of the potential damage as of August 1. While Landsat has not typically been used to monitor insect outbreaks in near-real time, new analytical tools along with the open access to Landsat data make it possible to quantify insect damage over a large area at a level of detail not possible with aerial surveys alone. A new journal article describing the methods used to generate these maps is available at http://www.mdpi.com/1999-4907/8/8/275. |
||||||||||||||||||||||||||||||||
| Gypsy Moth Infestation, MA, CT, RI, USA | Earthshots | caterpillar, defoliation, drought, insect infestation, moth, tornado | While certainly too small to see from space,… |
While certainly too small to see from space, the gypsy moth caterpillar (Lymantria dispar) can cause enough change in a forest to be seen with Landsat’s 30-m resolution. A mere 1/16 inch long when they hatch in May, the caterpillar can reach 3 inches long by late June when they pupate. In that short time span, the pest feeds on the leaves of deciduous trees. Beginning in 2016, they caused noticeable change in the Northeastern United States. While Landsat has not typically been used to monitor insect outbreaks in near-real time, new analytical tools combined with the open access to Landsat data make it possible to quantify insect damage over a large area at a level of detail not possible with aerial surveys alone. The 2016 and 2017 images show the widespread defoliation of the trees in orange-brown, with a large area of heavy defoliation to the west of Providence, Rhode Island, and additional patches in eastern Connecticut. In 2018, defoliation was much less widespread and severe; however, continued defoliation is now mixed with mortality as individual trees succumb to multiple years of defoliation and other stressors including drought. |
Forests, Wildlife | |||||||||||||||||||||||||||||||
| Hailstorm at EROS, Sioux Falls, SD, USA | Earthshots | hail, hailstorm, storm, weather | These images show the location of the USGS… |
These images show the location of the USGS Earth Resources Observation and Science (EROS) Center, about 10 miles north of Sioux Falls, South Dakota. On Sunday, July 13, 1997, an unusually severe hailstorm blasted through the area, missing Sioux Falls but hitting EROS head-on. The storm pounded EROS with 20 minutes of baseball- to softball-sized hail. Landsat 5 passed overhead three days later and documented the aftermath. Healthy crops normally surround Sioux Falls. The healthy crops appear bright red because red represents the near-infrared light (that human eyes can’t see) that is highly reflected by healthy vegetation. Most of the crops grown in this area are soybeans and corn. Some of those fields turned gray in the 1997 image, where the hailstorm converted the cropland into bare soil. The conversion was temporary, however, as the Landsat 5 image from 1998 demonstrates. The cropland is back to the expected red, indicating healthy crops. |
Agriculture, Natural-Disasters | |||||||||||||||||||||||||||||||
| Halley Station | Earthshots | calving, chasm, crevasses, ice, ice rumples, ice shelf, icebergs, rifts | The British Antarctic Survey has studied Brunt… |
The British Antarctic Survey has studied Brunt Ice Shelf in person since 1955. Scientists at their Halley Research Station study Earth, atmospheric, and space weather processes. Since 2012, the station has been made up of eight interlinked pods, built on skis so they can be moved, such as during the Antarctic summer of 2016–2017. Referred to as Halley VI Research Station, it was moved to the eastern side of Chasm 1. The station is constantly on the move anyway, since the floating ice shelf flows at a rate of up to 2 km per year toward the west. Images from Europe’s Copernicus Sentinel-2 satellites show the station’s previous location in 2016 and new location after that. Even at this satellite’s 10-m resolution in natural color images, the station consists of only a few pixels. |
Glaciers | |||||||||||||||||||||||||||||||
| Halloween Crack | Earthshots | calving, chasm, crevasses, ice, ice rumples, ice shelf, icebergs, rifts | Another rift appeared on the Brunt Ice Shelf… |
Another rift appeared on the Brunt Ice Shelf in October 2016 and quickly extended eastward. Dubbed Halloween Crack, it’s located about 12 km north of Halley Research Station. By March 2017, the crack cut 35 km across the ice shelf. By October 2018, it was 60 km long. These images from Landsat 8 use only its panchromatic band. The resolution of this band is 15 m, rather than the 30 m of the other bands. It makes the images grayscale, which in Antarctica is not much different from natural color. Do you see Halley Research Station move into view in the lower right of the images? How about another rift forming in the last images and an iceberg breaking from the shelf? More on that in the “North Rift” sections. |
Glaciers | |||||||||||||||||||||||||||||||
| Harbours | Earthshots | harbors, Olympics, urban growth | Sydney Harbour defines the city and makes it… |
Sydney Harbour defines the city and makes it recognizable worldwide. Parks, reserves, and gardens line the 240 kilometers of shoreline of this beautiful natural harbour. Any green that you see in the images along the harbour are parks or reserves—along with a few golf courses. The Sydney Harbour Bridge crosses the harbour. This well-known Australia landmark opened in 1932. The height of the top of the arch is 134 meters above sea level. The 1-kilometer-long bridge is visible in the Landsat images, but you have to look closely. Located near the bridge is one of the world’s most recognizable buildings and part of Sydney Harbour’s landscape. The Sydney Opera House was completed in 1973. It is seen as a few bright pixels in the images, on the end of the point nearest the bridge. The 2000 Summer Olympic Games took place in Sydney. Can you spot the location of Sydney’s Olympic Park? |
Cities, Coasts | |||||||||||||||||||||||||||||||
| Harrat Al Birk | Earth As Art | lava field, volcanoes | Dark-colored volcanic cones sprout from an… | Dark-colored volcanic cones sprout from an ancient lava field known as Harrat Al Birk along Saudi Arabia's Red Sea coastline. Many such lava fields dot the Arabian Peninsula and range in age from 2 million to 30 million years old. |
||||||||||||||||||||||||||||||||
| Haruj Volcanic Field, Libya | Image of the Week | lava flows, volcanoes | Haruj is the large volcanic field that dominates… | Haruj is the large volcanic field that dominates this Landsat image mosaic acquired over central Libya. The plateau was built from basaltic lava flows that erupted over time from approximately 150 separate volcanoes. The volcanic craters and lava flows are all evidence of a previous active period, well preserved in the dry Sahara Desert. The geologic evolution of this landscape is not fully understood, but some scientists have used the texture and color differences revealed in satellite images to try to interpret the relative ages and sequence of different volcanic events. The numerous spectral bands and band combinations available from Landsat mean that the color variation of individual lava flows can be especially helpful for interpreting different phases of volcanic activity. Many of the bright spots within the darker colored basalt flows are sand-filled craters associated with individual volcanoes. Other light-colored areas are depressions covered with silt and fine sand. This image mosaic consists of numerous Landsat 8 scenes acquired in early 2015. Landsat images can be useful to support geologic mapping and studies of large and remote features such as this. |
||||||||||||||||||||||||||||||||
| Hasankeyf | Earthshots | Another consequence of the dam is the burial… |
Another consequence of the dam is the burial and inundation of the Hasankeyf archaeological site. The site has evidence of human habitation dating back 12,000 years. Before the reservoir inundated the town, residents were relocated to high ground north of the river. Named New Hasankeyf, the new town is home to a few historical structures moved from their original locations, including a tomb, a mosque, and an ancient bath. While a section of the old town remains above the water, many archaeological sites were submerged beginning in 2019. The declassified Hexagon satellite image also shows enough detail to reveal Hasankeyf’s previous location. |
Dams, Energy, Water | ||||||||||||||||||||||||||||||||
| Hawaii | Shaded Relief | Shaded Relief Images of specific areas (generally… | Shaded Relief Images of specific areas (generally by state) have been selected from the National Elevation Dataset. For original data details, see NED. |
|||||||||||||||||||||||||||||||||
| Hawaii | State Mosaics | The state of Hawaii consists of eight main… | The state of Hawaii consists of eight main islands: Niihau, Kauai, Oahu, Molokai, Lanai, Kahoolawe, Maui, and Hawaii. From east to west, Hawaii is the widest state in the country. |
|||||||||||||||||||||||||||||||||
| HDDT - Landsat Data Recovery | Video - Landsat | |||||||||||||||||||||||||||||||||||
| High Park Fire, Colorado | Image of the Week | burn scars | ||||||||||||||||||||||||||||||||||
| Himalayas | Earth As Art | rivers, snow | Soaring, snow-capped peaks and ridges of the… | Soaring, snow-capped peaks and ridges of the eastern Himalaya Mountains create an irregular white-on-red patchwork between major rivers in southwestern China. The Himalayas are made up of three parallel mountain ranges that together extend more than 2,900 kilometers. |
||||||||||||||||||||||||||||||||
| History | Earthshots | bayou, delta, island | The Biloxi-Chitimacha-Choctaw community began… |
The Biloxi-Chitimacha-Choctaw community began in the early 1800s when Frenchman Jean Marie Naquin married Pauline Verdin, a Native American. Naquin’s family disowned him for this, and the couple moved to the delta region, where his father had traveled many times. Despite being disowned, Naquin named the island where the couple settled after his father Jean Charles Naquin. Naquin and Verdin, along with the other original inhabitants of the island, had also moved there to escape the Trail of Tears, the forced removal of Native Americans from the southeast in the 1830s to present-day Oklahoma. They sought refuge in the dense forested swamps of the Mississippi Delta, which white settlers thought were uninhabitable. Most of Jean Marie and Pauline’s children married descendants of the Biloxi-Chitimacha and Choctaw tribes. Other families moved to the island after intermarriage between the families. By 1910, the island population had grown to 16 families, all descendants of the first families to settle there. They lived by fishing, gathering oysters, trapping, and hunting. By the 1950s, there were around 80 families living in Isle de Jean Charles, and the island spanned 33,000 acres. Today, the island has shrunk to 320 acres and fewer than 30 families remain. Many residents moved elsewhere, fracturing the community. With the people scattered, the heritage and traditions are fading away. Afraid of losing their culture, the community is now planning another resettlement, possibly the only way for them to adapt to the changing Louisiana coast. The tribe has been planning resettlement since 2000, and in January 2016, the U.S. Department of Housing and Urban Development (HUD) awarded the tribe $48 million to help them move. A possible location has been chosen that would allow the community to regain their culture with traditional hunting, fishing, and agriculture. The site is a 515-acre sugar farm north of Houma. Resettlement, however, is a difficult concept to accept. Tribe members say losing the island is like losing a family member. Moderate resolution imagery from Landsat (30 meters) and Sentinel (10 meters) shows a broad view of the changes around the island over time. Landsat’s history goes back to 1972, with 60-meter resolution imagery to show a long view of the change.
Sentinel-2A Imagery from the Europe's Copernicus Sentinel-2 satellite is distributed by the USGS through EarthExplorer. |
Coasts, Water, Wetlands | |||||||||||||||||||||||||||||||
| Holuhraun Lava Flow, Iceland | Image of the Week | eruption, fissures, lava, lava flows, near-infrared, shortwave infrared, thermal, volcanoes | A volcanic eruption that started on August 31 in… | A volcanic eruption that started on August 31 in Iceland shows no sign of weakening. This eruption is occurring at the Bardarbunga volcano, which lies north of the Vatnajökull glacier in south-central Iceland. Lava has been flowing spectacularly from the Holuhraun lava field, and the eruptive fissure has now spread lava across more than 70 square kilometers (27 square miles). |
||||||||||||||||||||||||||||||||
| Honey Prairie Fires | Image of the Week | burn scars, grasslands | ||||||||||||||||||||||||||||||||||
| How Landsat Helps | Earthshots | caterpillar, defoliation, insect infestation, moth | Landsat data can track the spread of the… |
Landsat data can track the spread of the outbreak and monitor defoliation. Comparing newly acquired Landsat observations with long-term average conditions modeled from Landsat time series makes it possible to detect changes in vegetation “greenness” in near-real time. These forest condition assessment maps represent changes in expected forest reflectance signatures compared to average patterns over an 11-year baseline. Blue pixels indicate forest conditions that are within the normal range of variability, while yellow, orange, and red show sustained decreases in vegetation greenness that coincide with caterpillar stages of the gypsy moth life cycle and are indicative of varying degrees of defoliation. Black is non-forest, according to National Land Cover Database 2011 (NLCD 2011) classifications. Data from Landsat not only detects initial outbreak and magnitude of the defoliation but also recovery later in the season.
|
Forests, Wildlife | |||||||||||||||||||||||||||||||
| Huang He Delta and Laizhou Bay | Image of the Week | deltas, rivers, sediment, tidal flats | The Huang He (Yellow) River in China is the most… | The Huang He (Yellow) River in China is the most sediment-filled river on Earth. It flows from the Bayan Har Mountains to the Bohai Sea. Along the way, it crosses a soft plateau that is covered with fine, wind-blown soil. The river carries away millions of tons of this delta-building material every year. Over time, the river carries its sediment load farther outward into the sea. These Landsat images provide a view of the dramatic changes to the shoreline. |
||||||||||||||||||||||||||||||||
| Huang He Delta, China | Earthshots | delta, erosion, levees, peninsula, rivers, sediment, shrimp farms, tidal flats | The Huang He River in China is a wanderer. Its… |
The Huang He River in China is a wanderer. Its lower reaches have changed course many times, moving the delta up and down the coast several hundred kilometers over the centuries. The Huang He (Yellow) River is over 4,800 kilometers long. It’s the 2nd longest river in China and the 5th longest in the world. It’s also the muddiest river on Earth. On its long journey, the river crosses a soft plateau that’s covered with fine, wind-blown soil. The river carries away millions of tons of this delta-building material every year. The Huang He derives its yellow color from fine particles of mica, quartz, and feldspar. The river shows up well in most of these Landsat images because of the high sediment load, which reflects light. The sediment even shows up in the water of many of these images where the river flows into the sea. |
Aquaculture, Cities, Coasts, Water | |||||||||||||||||||||||||||||||
| Hubbard Glacier, Alaska, USA | Earthshots | fjord, ice, lake | Unlike many glaciers in Alaska and around the… |
Unlike many glaciers in Alaska and around the world, Hubbard Glacier is thickening and advancing. Hubbard Glacier has a large accumulation area, like a river with a large watershed. This large area of snow in the mountains upstream either melts or flows down to the end of the glacier, and Hubbard steadily grows. In fact, Hubbard Glacier has advanced 1.5 miles, or about 2.4 kilometers, since 1895. These Landsat images illustrate an unusual event that was observed twice at the terminus of Hubbard Glacier. Hubbard temporarily blocked Russell Fjord (a long, narrow inlet of the sea) from the rest of Disenchantment Bay and the Gulf of Alaska. It’s even possible that the glacier could one day permanently block the fjord. |
Glaciers, Water | |||||||||||||||||||||||||||||||
| Hurricane Florence | Image of the Week | flooding, hurricanes, rain, rivers, storms, weather | Hurricane Florence hit the Carolina coast on… | Hurricane Florence hit the Carolina coast on September 14, 2018, but it took much longer for the full impact to emerge.
|
||||||||||||||||||||||||||||||||
| Hurricane Florence fills Georgetown rivers | Image Comparison Sliders | flooding, hurricanes, rain, rivers, storms, weather | ||||||||||||||||||||||||||||||||||
| Hurricane Florence swells river, refills drained lake in South Carolina | Image Comparison Sliders | flooding, hurricanes, lakes, rain, rivers, storms, weather | ||||||||||||||||||||||||||||||||||
| Hurricane Florence's Impact on Lumberton, N.C. | Image Comparison Sliders | flooding, hurricanes, rain, rivers, storms, weather | ||||||||||||||||||||||||||||||||||
| Hurricane Harvey Flooding | Image Comparison Sliders | flooding, hurricanes, rain, rivers, storms, weather | ||||||||||||||||||||||||||||||||||
| Hurricane Harvey Flooding | Image of the Week | flooding, hurricanes, rivers, storms, weather | Extensive flooding inundated the Gulf Coast of… | Extensive flooding inundated the Gulf Coast of Texas after Hurricane Harvey made landfall as a Category 4 hurricane on August 25, 2017. Among the many waterways in southeastern Texas that exceeded flood stage was the Brazos River, which flows past Houston to its west and to the Gulf of Mexico at Freeport. A USGS streamgage on the Brazos near Rosharon showed that a river level normally at around 10 feet peaked at 52.65 feet on August 29. That was about 10 feet above flood stage. Even with scattered clouds in these Landsat images, the extent of flooding on the landscape just south of Houston is evident. The Landsat 8 image from August 12 shows the area before the storm hit. Landsat 7 passed over the same area on September 5 to show the flooded Brazos River. Landsat continues to monitor the extent of the flooding caused by Hurricane Harvey. |
||||||||||||||||||||||||||||||||
| Hurricane Harvey Inundates Gulf Coast | Image of the Week | flooding, hurricanes, rain, rivers, storms, weather | Hurricane Harvey made landfall on the Gulf Coast… | Hurricane Harvey made landfall on the Gulf Coast of Texas as a Category 4 hurricane on the night of August 25, 2017. It then stalled over southeastern Texas as a tropical storm and continued to creep northeast over Louisiana. What made Harvey an unusually devastating storm was its rain. Extraordinary rain totals were recorded at several locations. On August 30, the National Oceanic and Atmospheric Administration (NOAA) reported a rainfall total of 51.88 inches at Cedar Bayou and FM Road No. 1942, just east of Houston. These four images show Harvey’s development over the Gulf of Mexico and its movement across Texas. The images were created using NASA-generated Surface Reflectance data products from the Visible Infrared Imaging Radiometer Suite (VIIRS), one of the instruments on the NOAA/NASA Suomi National Polar-orbiting Partnership (S-NPP) satellite. VIIRS provides daily global coverage at multiple resolutions. Land S-NPP NASA VIIRS data products are made available by the Land Processes Distributed Active Archive Center (LP DAAC) and can be accessed using NASA’s Earthdata Search or the USGS’ EarthExplorer. |
||||||||||||||||||||||||||||||||
| Hurricane Irma Slams Barbuda | Image of the Week | hurricanes, near-infrared, shortwave infrared, storms, weather | Hurricane Irma was a Category 5 superstorm when… | Hurricane Irma was a Category 5 superstorm when it lashed the Caribbean island of Barbuda on September 6, 2017. Irma’s eye passed directly over the small island, and wind gusts of 185 miles per hour stripped the island’s vegetation. Villages were destroyed. An estimated 95 percent of the island’s structures were damaged, including destruction of its hospital, schools, and airport. Barbuda’s 1,800 residents evacuated to Antigua. The dramatic changes to the island caused by Irma, the strongest Atlantic hurricane on record, are shown in this pair of images from Landsat 8. Landsat uses shortwave-infrared, near-infrared, and green wavelengths to reveal those changes. The August 27 image shows healthy vegetation as bright green. In the September 12 image, that bright green appears washed out, the degraded vegetation after the storm. |
||||||||||||||||||||||||||||||||
| Hurricane Isaac Flooding | Image of the Week | flooding, hurricanes, lakes, rain, sediment, storms, weather | ||||||||||||||||||||||||||||||||||
| Hurricane Katrina, New Orleans, Louisiana, USA | Earthshots | canals, flooding, hurricane, lake, river, storm, weather | Hurricane Katrina was one of the most intense… |
Hurricane Katrina was one of the most intense and costliest hurricanes to hit the United States. On August 28, 2005, Katrina was a category 5 storm (on the Saffir-Simpson scale) in the middle of the Gulf of Mexico. It made landfall the next morning as a strong category 3 storm with sustained winds of 125 miles (200 kilometers) per hour. Flooding in New Orleans began early that morning, and water continued pouring into the city until September 1. State health departments estimate that Hurricane Katrina caused about 2,000 deaths, most occurring in Louisiana. About 75 percent of the New Orleans metropolitan area was flooded. The storm caused an estimated $80 billion in damage. Landsat recorded the devastation and continues to monitor the region’s wetlands. New Orleans, Louisiana, is near the bottom of the images along the Mississippi River. The city lies just south of Lake Pontchartrain. Hundreds of square miles of wetlands were lost after Katrina. Some marshlands became permanent water bodies. Some projects now aim to bring back marshlands because of their value in defending the coastline from storms. (Black stripes run through the Sep. 15, 2005, images because of the Scan Line Corrector failure on Landsat 7 in May 2003.) |
Cities, Natural-Disasters, Water, Wetlands | |||||||||||||||||||||||||||||||
| Hurricane Matthew Exacts Heavy Toll on Haiti | Image of the Week | hurricanes, rain, rivers, sediment, storms, weather | A week after Hurricane Matthew slammed through… | A week after Hurricane Matthew slammed through southwestern Haiti on October 4, 2016, Landsat 8’s Operational Land Imager sensor provided dramatic documentation of the scope of destruction in the Caribbean country. |
||||||||||||||||||||||||||||||||
| Hurricane Michael | Image of the Week | hurricanes, storms, weather | Hurricane Michael made landfall in the Florida… | Hurricane Michael made landfall in the Florida Panhandle on October 10, 2018. Landsat 7 images captured before and after highlight the destructive path of the Category 4 storm. Mexico Beach was all but demolished, with homes left in heaps by wind and storm surge. The green leaves that pop in the September image are stripped from trees by October, and the dull brown of debris remains. Panama City and the surrounding areas also lost color after the storm. Aerial imagery from Civil Air Patrol shows the flattened trees responsible for the change. The coast saw serious impacts. A strip of Crooked Island disappears beneath the water in the October image, and bright aqua streaks thread through the sand south of Tyndall Air Force Base. Landsat can be used to track and study the impact of hurricanes and other disasters. |
||||||||||||||||||||||||||||||||
| Hurricane Sandy Slammed Eastern U.S. Four Years Ago | Image of the Week | hurricanes, islands, storms, weather | On October 29, 2012, Hurricane Sandy barreled… | On October 29, 2012, Hurricane Sandy barreled across the shorelines of New Jersey, New York, and Connecticut, impacting lives across two dozen states that fell within its destructive path. High Resolution Orthoimagery archived at the USGS EROS Center and inset into the larger image show the New Jersey coastal town of Mantoloking five years before Sandy made landfall, as well as the slow recovery three years after the storm. Entire blocks of houses visible in the 2007 image were damaged or completely washed away by the storm surge and wind, replaced by empty patches of sand in the 2015 image. The larger background image acquired by the Remote Sensing Division of the National Oceanic and Atmospheric Administration in the days after the storm in 2012 shows the immediate devastation, including a breach cut across the island and connecting the Atlantic Ocean to Barnegat Bay. The Mantoloking Bridge was covered in water, sand, and debris from houses after the storm. Built for roughly $25 million and opened in 2005, it was closed after Sandy went through because county officials considered it unstable, and didn’t reopen until the first week of January 2013. |
||||||||||||||||||||||||||||||||
| Hurricane Sandy’s Lasting Effects on Fire Island, NY | Image of the Week | hurricanes, islands, storms, waves, weather | As Hurricane Sandy made landfall on October 29,… | As Hurricane Sandy made landfall on October 29, 2012, the storm’s waves and wind cut a breach in a narrow part of Fire Island, a barrier island south of Long Island, New York. Referred to as the “wilderness breach,” the new channel was cut in an area called the Otis Pike Fire Island High Dune Wilderness of the Fire Island National Seashore. The breach grew rapidly. The year after the storm, several nor’easters widened the opening. This series of Landsat images shows Fire Island before Hurricane Sandy hit, then again after the storm. The November 6 image shows the breach starting to open, under thin cloud cover. The growing shoal area on the north side of the breach can be seen in the images after the storm. Breaches are natural barrier island features, and they can change flooding risk to coastal communities. The Fire Island breach provided USGS scientists with an opportunity to study this natural process in depth. Bathymetric surveys in the years after Hurricane Sandy along with satellite images help scientists model future changes of the barrier island and better predict what may happen to the region in future storms. |
||||||||||||||||||||||||||||||||
| Hyacinth | Earthshots | floriculture, flowers, greenhouses, hyacinth, lakes, roses | The Sentinel-2 satellites from the European… |
The Sentinel-2 satellites from the European Space Agency (ESA) use infrared imaging to highlight certain information about the land surface. In the near-infrared wavelength of light, actively growing vegetation appears red in these images that show the lake more closely at a resolution of 10 m. The cropland appears in bright red around the lake, and the greenhouses are the light blocky shapes. However, bright red swirls also appear on the surface of the lake, and the extent and location change in each image. Sentinel’s near-infrared proves that it’s vegetation and that it’s alive. The nuisance plant is water hyacinth, a fast-spreading, free-floating plant that forms moving, impenetrable mats. It hinders boating and fishing and interferes with the ecology of the lake. European settlement in the early 1900s likely brought hyacinth to Lake Naivasha. Around 1920, hyacinth was tossed into the lake to beautify it. Low nutrients restricted it to the shallow northern shores for decades. It spread to other parts of the lake in the 1980s. The flower farms increased at this time, using so much water that the lake level dropped, exposing hyacinth seeds. As the lake became over-enriched with farm runoff, the hyacinth thrived. In the Landsat images in the other sections, the near-infrared wavelength is used to make vegetation appear green. The extent and location of the hyacinth on the lake’s surface changes over the years in those images, visible as the bright green shapes on the lake. The hyacinth was at first limited to protected bays and estuaries. The western part of the lake has been most affected recently, but these images do show it spreading over various parts of the lake. Scientists will continue to use Sentinel, Landsat, and other remote sensing instruments to track the changes caused by the blooming cut flower industry. |
Agriculture, Cities, Water | |||||||||||||||||||||||||||||||
| Hydrology | Earthshots | flooding, lakes, rivers | An aerial image from 1952 shows Lake Thompson… |
An aerial image from 1952 shows Lake Thompson as a wetland, with about one-third of it as open water. Landsat began observing the area in 1972 with multispectral imaging that includes visible and near-infrared bands, which are great at distinguishing open water from dry land. Water levels have fallen somewhat since the 1990s but continue to fluctuate depending on annual precipitation. Some shoreline and shallow areas change between dry land, marshland, and open water. Most lakes in the PPR are closed systems. That means they do not have an outlet for water to flow out. It also means they can change a lot based on variable rainfall and snowmelt from year to year. As these water bodies expand, they can connect to other water bodies that were previously disconnected. From around the 1890s until the mid-1980s, most lakes around Lake Thompson were closed lakes, disconnected from one another. Above average precipitation in 1984 brought an increase in tributary inflow into the lakes of Kingsbury County. Above average rain continued for two more years, and a chain reaction began that went something like this: In April 1986, Spirit Lake overflowed and drained into Mud Lake. Mud Lake then overflowed, its water draining to Silver Lake by way of a drainage channel. Silver Lake then overflowed into Lake Thompson. But that’s not all. Lake Preston also overflowed around that time and drained into Lake Whitewood, which subsequently rose above its outlet and drained into Lake Thompson. By October 1986, Lake Thompson ceased to be a closed basin when it drained into the East Fork Vermillion River. Water from the East Fork Vermillion River subsequently flows into the Missouri River. This marked the first time Lake Thompson had overflowed in over 100 years.
|
Agriculture, Water, Wildlife | |||||||||||||||||||||||||||||||
| Hydrology | Earthshots | coal, groundwater, hydrology, mountaintop removal, reclamation, valleys | The effects on the hydrology in the region… |
The effects on the hydrology in the region where mountaintop mining takes place is not well understood—how does this mining activity affect the movement and storage of water? The EPA, in a 2011 report, explains that stream ecosystems are affected by mountaintop mining in five principal ways:
One way hydrology changes is through the reclamation process. Heavy equipment compacts the soil, which inhibits water infiltration and natural succession. That is, the compacted soil doesn’t soak in water the same way as it did before when it was natural forest. Native trees do not grow well in this compacted soil, where rainfall runs off faster. Even when grasses are planted immediately during reclamation, runoff is increased in these areas. Increased runoff can lead to more frequent downstream flooding. Some fill areas that have large volumes of crushed rock can actually increase watershed storage. But how and to what extent these areas control runoff are not clear. Furthermore, groundwater samples from mined areas after reclamation have been found to contain more mine-derived chemicals than water from unmined areas. These chemicals (lead, aluminum, chromium, manganese, and selenium) would otherwise remain sealed up in the coal and rock. Water flowing through the valley fills picks up these chemicals and flows into the streams. Researchers have linked declines in stream biodiversity to an increase in these contaminants, affecting the freshwater species found there. |
Mining, Mountains | |||||||||||||||||||||||||||||||
| Hydropower in Ethiopia | Image of the Week | hydropower, lakes, reservoirs, rivers, water use | A 1.1-mile long, 509-foot-tall concrete dam… | A 1.1-mile long, 509-foot-tall concrete dam spanning the Blue Nile River is set to become the largest hydropower plant in Africa. Under construction since 2011, the Grand Ethiopian Renaissance Dam is expected to produce about 16,000 GWh of electricity annually when fully complete in 2023, providing power to 60% of Ethiopia’s estimated 115 million people. An initial filling of the Ethiopian Reservoir can be seen in the 2017 Landsat image. The water level then dropped before the first phase of reservoir filling began in the summer of 2020. The 2021 image was acquired in April during the dry season. The curved shape southwest of the main dam is referred to as the Saddle Dam and hints at the reservoir's eventual capacity of 74 cubic kilometers. That's about twice the volume of Lake Mead which supplies water for irrigation and human consumption in the southwestern United States. |
||||||||||||||||||||||||||||||||
| Ice Breakup | Earthshots | fishing, ice, ice fishing, ice road, lakes | The Mille Lacs Lake ice roads are short-lived… |
The Mille Lacs Lake ice roads are short-lived. Ice houses need to be off the lake before the ice breaks up in the spring. The deadline varies by year, depending on ice conditions. It’s usually in late February to early March. |
Water | |||||||||||||||||||||||||||||||
| Ice Fishing | Earthshots | fishing, ice, ice fishing, ice road, lakes | The number of ice houses on Mille Lacs Lake… |
The number of ice houses on Mille Lacs Lake can exceed 5,500. Ice fishers are after walleye, northern pike, muskie, yellow perch, largemouth and smallmouth bass, and tullibee. It’s possible for the roads to be obscured after a snowfall, to the extent that they need to be plowed. So some images show the roads as less clear. |
Water | |||||||||||||||||||||||||||||||
| Ice Road | Earthshots | diamonds, ice, ice road, lakes, tundra | The world’s longest ice road connects… |
The world’s longest ice road connects Yellowknife to three diamond mines: Ekati, Diavik, and Snap Lake. Of the 475 kilometers (300 miles) of ice road, 86 percent of it is across frozen lakes. The ice road is the only overland supply route for the mines. Each winter, a year’s worth of fuel, construction material, heavy mining equipment, and explosives are trucked to the mines. The road provides the most cost-effective method for transporting these supplies. Open only 8–10 weeks of the year, the ice road is open from mid-January to March. It has to be rebuilt each year. Work on the road starts soon after Christmas. When the ice is 1 meter (42 inches) thick, it can support a truck fully loaded with over 40 metric tons (44 tons) of fuel. Full trucks traveling north have a strict speed limit of 25 kilometers (15.5 miles) per hour. Empty trucks heading south can use the express lane and go up to 70 kilometers (43.5 miles) per hour. The number of trucks the road handles per year varies. Just over 6,000 truckloads were driven north during the 2013 season. This place is so far north it’s too dark for satellite imaging in the middle of winter. Early summer, late summer, and late winter images are shown for comparison. There is still some ice on the lake in the July images. In the April images, the straight dark lines across the ice are the temporary roads. |
Mining, Water | |||||||||||||||||||||||||||||||
| Ice Routes in Finland Revealed by Landsat | Image of the Week | EROS, Finland, ice, icebreaker, Image of the Week, Landsat, snow | Cloud-free satellite views of Lake Saimaa in… | Cloud-free satellite views of Lake Saimaa in Finland are rare in January. But this Landsat 9 scene, captured on January 4th, reveals over 200 miles of winter shipping lanes. The water vapor from 3 large wood pulp factories can be seen on this shoreline. One is located in Lappeenranta, where the ice route begins. Icebreakers in Finland often keep shipping lanes open through November and December, or until the ice is too thick to break. This route leads north, winding through the coniferous forest of Finland's “Lakeland”. Savonlinna is the home port of at least one local icebreaker, TYRSKY, which appears to be in winter layup as of January 3rd. Icebreaking activity north along the route is still visible. Here, the route splits near Linnansaari National Park. One branch leads northwest, eventually reaching Varkaus, where another wood mill is visible. The east branch of the route continues on toward Joensuu. Here the route passes through Lake Paasselkä, a deep lake over an ancient impact crater. The frozen lane continues north. This scene ends before the ice route's destination: Joensuu, Finland, but we can see the remainder in a previous capture from 2020. On January 20th, Landsat 9 captured a new scene, showing that the route has been frozen over until spring. The Landsat archive is used in Finland, and around the world to monitor seasonal changes like these. |
Energy, Water | |||||||||||||||||||||||||||||||
| Ice Rumples | Earthshots | calving, chasm, crevasses, ice, ice rumples, ice shelf, icebergs, rifts | Major rifts have formed near a distinctive… |
Major rifts have formed near a distinctive feature called the McDonald Ice Rumples. The feature, rising about 10 m above the surrounding ice shelf, may be responsible for the relative stability of Brunt Ice Shelf over most of the 20th Century. Ice rumples form when ice flows over a rocky formation on the seabed. As the shelf moves toward the ocean, ice collects behind the rock and wrinkles. This rocky formation impedes the flow of ice, causing pressure waves, crevasses, and rifts to form at the surface. Through this Landsat time series, the feature that causes the rumples remains stationary, while the ice shelf and its rifts flow west. |
Glaciers | |||||||||||||||||||||||||||||||
| Ice Stars | Earth As Art | ice | Like distant galaxies amid clouds of interstellar… | Like distant galaxies amid clouds of interstellar dust, chunks of sea ice drift through graceful swirls of grease ice in the frigid waters of Foxe Basin near Baffin Island in the Canadian Arctic. Sea ice often begins as grease ice, a soupy slick of tiny ice crystals on the ocean's surface. As the temperature drops, grease ice thickens and coalesces into slabs of more solid ice. |
||||||||||||||||||||||||||||||||
| Ice Waves | Earth As Art | fjords, ice, icebergs | Along the southeastern coast of Greenland,… | Along the southeastern coast of Greenland, an intricate network of fjords funnels glacial ice to the Atlantic Ocean. During the summer melting season, newly calved icebergs join slabs of sea ice and older, weathered bergs in an offshore slurry that the southward-flowing East Greenland Current sometimes swirls into stunning shapes. Exposed rock of mountain peaks, tinted red in this image, hints at a hidden landscape. |
||||||||||||||||||||||||||||||||
| Iceberg B17B South of Australia | Image of the Week | calving, ice shelf, icebergs | ||||||||||||||||||||||||||||||||||
| Iceberg Separates from Larsen C Ice Shelf | Image of the Week | calving, ice shelf, icebergs, infrared, rifts | Around July 10–12, 2017, in the middle of the… | Around July 10–12, 2017, in the middle of the long, dark Antarctic winter, a rift in the Larsen C Ice Shelf broke through the last few miles of ice to the Weddell Sea and formed a new iceberg. The NOAA National Ice Center has given the Delaware-sized iceberg the designation A-68. Even in the darkness, Earth-observing satellites are monitoring this new iceberg with infrared imaging. In a July 12 image, the Moderate Resolution Imaging Spectroradiometer (MODIS) sensor on NASA’s Aqua satellite shows relatively warm open water completely around the new iceberg. The crack between the iceberg and the ice shelf is really a soup of floating, broken pieces of ice on top of the water. On the same date, the Thermal Infrared Sensor (TIRS) on Landsat 8 recorded its own image showing the relative temperature of the ice and the rift. The bright line, located at the edge of the Landsat scene, is sea water at the freezing point rather than frozen solid. Normally, Landsat acquisitions for Antarctica are suspended when the Sun gets close to the horizon around early April. A special acquisition request was made to get nighttime imagery of the Larsen C area to help track the growth of the rift as it got closer to breaking free. Landsat and MODIS will continue to monitor the movement of the iceberg as it separates from the ice shelf and likely drifts northward along the Antarctic Peninsula. Many factors will affect the iceberg’s future motion, including wind, tide, and current, and the fact that ice on the sea next to the iceberg will inhibit it from drifting as far as it would if there were no ice. All of these factors will be visible thanks to the satellites’ thermal infrared imaging. |
||||||||||||||||||||||||||||||||
| Iceland’s Ice Caps | Image of the Week | ash, eruptions, ice, ice caps, snow, volcanoes | These two Landsat images show several of Iceland’… | These two Landsat images show several of Iceland’s ice caps as they appeared in September 1986 and 2014. The largest white area is the Mýrdalsjökull Ice Cap. Underneath this massive mound of ice sits the active Katla volcano. Katla erupts every 40–80 years and is accompanied by high-volume glacial outburst floods (jökulhlaups). The smaller ice cap to the west is Eyjafjallajökull. This ice cap also covers an active volcano, which last erupted in 2010 and disrupted air travel for several weeks. The brown areas on both ice caps consist of accumulated volcanic ash and other deposits from past volcanic eruptions. The dark cover of volcanic ash from the 2010 eruption is especially prominent on the 2014 image of Eyjafjallajökull. At first glance, there appears to be remarkable shrinkage of the ice caps by 2014, the situation for most of Iceland’s ice cover. However, the bright white areas in the 1986 image represent fresh snow cover, which is not present in the 2014 image. To monitor the actual changes in the extent of an ice cap, scientists measure changes in the position of the terminus of outlet glaciers. Landsat is one of several important remote sensing tools being used by glaciologists to map and monitor changes in the Earth’s ice cover over time. |
||||||||||||||||||||||||||||||||
| Icelandic Tiger | Earth As Art | fjords, islands | This stretch of Iceland's northern coast… | This stretch of Iceland's northern coast resembles a tiger's head complete with stripes of orange, black, and white. The tiger's mouth is the great Eyjafjorour, a deep fjord that juts into the mainland between steep mountains. The name means "island fjord," derived from the tiny, tear-shaped Hrisey Island near its mouth. The ice-free port city of Akureyri lies near the fjord's narrow tip, and is Iceland's second largest population center after the capital, Reykjavik. |
||||||||||||||||||||||||||||||||
| Icy Vortex | Earth As Art | ice | Appearing as if an artist imitating Jackson… | Appearing as if an artist imitating Jackson Pollock had randomly spurted ink onto the canvas, this image shows swirling ice in the Foxe Basin of northern Canada. Even though the image is from late July, there was still ice floating in the water this far north. |
||||||||||||||||||||||||||||||||
| Ida Rains on Eastern Pennsylvania | Image of the Week | flooding, hurricane, rain, rivers, sediment, storms, weather | @media (min-width: 576px) { .field--name-field-… | The remnants of Hurricane Ida dumped several inches of rain on eastern Pennsylvania. Landsat images show the Schuylkill River west of Philadelphia where muddied waters rose in several communities. The August 26th image shows typical river levels in the Phoenixville area:
On September 2nd, a USGS stream gauge in Philadelphia exceeded flood stage levels by over 5 feet. Phoenixville saw heavy flooding with water overtopping Highway 23, and the Pickering Creek Reservoir turned from blue to brown as sediment rushed in.
|
||||||||||||||||||||||||||||||||
| Idaho | Shaded Relief | Shaded Relief Images of specific areas (generally… | Shaded Relief Images of specific areas (generally by state) have been selected from the National Elevation Dataset. For original data details, see NED. |
|||||||||||||||||||||||||||||||||
| Idaho | State Mosaics | Idaho grows more potatoes than any other U.S.… | Idaho grows more potatoes than any other U.S. growing region, annually producing about 30 percent of U.S. fall production. Warm, sunny days, cool nights, and water from melting snow in nearby mountains make the perfect combination for growing them. |
|||||||||||||||||||||||||||||||||
| Iguazú Falls | Earthshots | airport, river, waterfalls | Within this scene is one of the largest… |
Within this scene is one of the largest waterfalls in the world. On the border between Brazil and Argentina on the Iguazú River, 275 falls collectively make up Iguazú Falls. “Devil’s Throat” is the tallest at 80 meters. Landsat’s 30-meter resolution doesn’t reveal the falls in great detail. But in the 2011 image, a blue-white line at the location of the falls points down toward the southeast. This line is the foamy water crashing over the Devil’s Throat portion of the falls. A runway is visible southwest of the falls. This is Cataratas Airport, which serves the city of Puerto Iguazú, Argentina, and provides access for tourists to visit the falls. Iguazú Falls was named one of the New 7 Wonders of Nature in 2011. |
Agriculture, Dams, Deforestation, Water | |||||||||||||||||||||||||||||||
| Iguazú National Park | Earthshots | rain forest, river | Iguazú National Park is located in Argentina… |
Iguazú National Park is located in Argentina on the border with Brazil and Paraguay. Its boundary is sharply defined as the bright green section on the right of the images. The Brazilian side of the park, north of the Iguazú River, is called Iguaçú National Park. The park is almost an island of southwestern Atlantic rain forest, one of the few remaining original areas of this type of tropical rain forest. The Atlantic rain forest is distinct from the Amazon and once stretched along most of Brazil’s Atlantic Coast and inland several hundred kilometers. In 1973, there were some cleared areas just north of the Iguazú River in Brazil, but they have since regrown. These images clearly demonstrate the effect of differing land use policies surrounding the park. Paraguay lies west of the Paraná River, which runs vertically through the center of these scenes. Paraguay has permitted complete development of the land. In 1973, the area seen in these images was vegetated, but by 2011, nearly all the land on the Paraguay side appears to be under human development, with a patchwork of cleared and agricultural areas. The deforestation in Paraguay begins with the telltale fishbone pattern. Roads built into the forest are the entryway into clearing the land for agriculture. On the Argentina side of the river, development is considerably more modest than in Paraguay. The bottom middle part of these images shows a different forest management practice. The oddly shaped patterns of deep green are forest plantations used for lumber and pulp. While intense transition from forest to agriculture can harm the land and environment, these plantations can reduce soil erosion, improve water quality, increase carbon sequestration, and provide habitat for many species. |
Agriculture, Dams, Deforestation, Water | |||||||||||||||||||||||||||||||
| Iguazú, South America | Earthshots | airport, hydropower, rain forest, river, waterfalls | On the border between Brazil, Paraguay, and… |
On the border between Brazil, Paraguay, and Argentina are some curious land use features. Paraguay lies west of the Paraná River, which runs north to south down the middle of the images. The Iguazú River flows toward the west and into the Paraná River. North of the Iguazú River is Brazil, and Argentina is to its south. At this location, we can see the effects of deforestation of the rain forest, one of the largest dams in the world, a spectacular set of waterfalls, and a sharp contrast between protected land and intense development. |
Agriculture, Dams, Deforestation, Water | |||||||||||||||||||||||||||||||
| IJsselmeer, Netherlands | Earthshots | artificial islands, dikes, lake, land creation, land reclamation, polders | For centuries, people living in what is now… |
For centuries, people living in what is now the Netherlands have used various strategies to control the water levels in this low-lying country. The alteration of this landscape continues as residents work to improve farmland and protect inhabited areas from flooding. Beginning in 1932, Dutch engineers created a series of dikes to drain water from an inlet of the North Sea. The reclaimed land increased the land area of the Netherlands that could be used for agriculture. These images illustrate the progress of the Netherlands' diking and draining of the IJsselmeer region. The IJsselmeer is a lake on the coast of the Netherlands. (This lake, or meer, is named after the IJssel River and is pronounced EYE-ssel-mare.) In the satellite images, water appears blue-black, and vegetation appears red. Highly reflective areas like pavement or bare soil appear light blue or blue-green. Amsterdam can be seen in the lower left of the images. Until 1932, this area was the Zuiderzee (pronounced ZIGH-dr-zee and meaning Southern Sea), simply a saltwater inlet of the North Sea. By 1968, the Dutch had transformed 1,979 km2 of the Zuiderzee into blocks of usable land, called polders. Here is how that typically happened:
The first of the five polders (Wieringermeer, in the northwest) was actually diked directly from the sea, not from the IJsselmeer. It was dry two years before the mouth of the Zuiderzee was closed off. |
Agriculture, Coasts, Water | |||||||||||||||||||||||||||||||
| Ilisu Dam | Earthshots | The Ilisu Dam is 440 feet high and a mile wide… |
The Ilisu Dam is 440 feet high and a mile wide. Generating 1,200 megawatts of electricity, it’s Turkey’s fourth largest dam in terms of power generation. The decline in water flow for the Tigris River can lower the water quality downstream, especially during a drought. Where the Tigris drains into the Persian Gulf in southern Iraq, the lower flow can cause saltwater intrusion from the Gulf. This hinders the recovery of the Mesopotamian Marshes. Declassified satellite imagery reveals a now-inundated village, Koctepe, just above the location of the Ilisu Dam. The Hexagon satellite image has a resolution of 2–4 feet, enough detail to see the small village by the Tigris River. |
Dams, Energy, Water | ||||||||||||||||||||||||||||||||
| Ilısu Dam, Turkey | Earthshots | The Tigris and Euphrates Rivers flow into the… |
The Tigris and Euphrates Rivers flow into the historical cradle of civilization. Dams built on these rivers in recent decades have altered the landscape with large reservoirs easily seen in Landsat imagery. Turkey has built 22 dams as part of its Southeastern Anatolia Project, as the country works toward energy independence. The country’s last major dam planned for the Tigris is also its largest. A reservoir began filling behind the Ilisu Dam in July 2019. Over its five decades, the Landsat program has provided a record of both natural and human-caused landscape change. |
Dams, Energy, Water | ||||||||||||||||||||||||||||||||
| Illinois | Shaded Relief | Shaded Relief Images of specific areas (generally… | Shaded Relief Images of specific areas (generally by state) have been selected from the National Elevation Dataset. For original data details, see NED. |
|||||||||||||||||||||||||||||||||
| Illinois | State Mosaics | Before Abraham Lincoln was elected President, he… | Before Abraham Lincoln was elected President, he served in the Illinois legislature and practiced law in Springfield. Lincoln is buried just outside Springfield at the Lincoln Tomb State Historic Site. |
|||||||||||||||||||||||||||||||||
| Illinois/Indiana, USA | Earthshots | cutoff, flooding, rain, rivers, weather | These three Landsat 5 images show several… |
These three Landsat 5 images show several rivers in southern Illinois and Indiana, USA, during normal and flooded conditions. Peak flooding was observed in this area on June 10 and 11, 2008. The clear Landsat scene from June 11, 2008, and the clear image of “normal” conditions from June 9, 2007, allow us to compare the scenes and see exactly what damage a flood of this magnitude can cause. Rainfall amounts ranging from about 2 inches to more than 10 inches fell in this area on June 6–7, 2008. Spring was wetter than normal, so the heavy rain easily saturated the ground. The rivers quickly rose to exceed flood stage. Satellite images can help authorities respond to disasters such as floods. The images can help local authorities see the amount of flooding and where there is damage to property. The extent of the flood can be mapped so that response teams can view where they are needed and respond quickly. |
Natural-Disasters, Water | |||||||||||||||||||||||||||||||
| Image of the Week - Downpour in British Columbia | Image of the Week | flooding, rain, rivers, sediment, weather | An atmospheric river swept through southern… | An atmospheric river swept through southern British Columbia on Canada's western edge, November 14, 2021. Parts of the province recorded nearly seven inches of rain in that 24 hour period. One week later, sediment carried by the Fraser River is visible in the Strait of Georgia. East of the strait near Abbotsford, the scene is even more dramatic. Landsat imagery shows more than 10 square miles of flooded farm ground. |
||||||||||||||||||||||||||||||||
| Image of the Week - Historic Lows at Lake Powell | Image of the Week | drought, lakes, reservoirs | Lake Powell on the border of Utah and Arizona… | Lake Powell on the border of Utah and Arizona supplies water to millions across the southwestern United States. Long-term dry conditions put the reservoir at a historic low in 2021. Landsat 8 imagery from 2017 shows the water's elevation at 3,628 feet. The reservoir on that day was at 60.3% of full capacity. 4 years later the level is 84 feet lower, with capacity down to 29.5%. Landsat will continue to monitor the reservoir from above. |
||||||||||||||||||||||||||||||||
| Impact | Earth As Art | craters | Tin Bider is an ancient and eroded meteor crater… | Tin Bider is an ancient and eroded meteor crater on the Tin Rhert Plateau in the Algerian Sahara. Tin Bider is nearly 6 kilometers (3.7 miles) in diameter and was caused by a meteorite impact in this region of northern Africa roughly 70 million years ago. The other streaks near the crater are unrelated to the impact event. These rock folds are geologic features older than the crater. |
||||||||||||||||||||||||||||||||
| Imperial Valley, California, USA | Earthshots | canal, irrigation, lake, river, saltwater, sea, water use | These images show the Imperial Valley, on the… |
These images show the Imperial Valley, on the border of California and Mexico. The international border is plain in the images because of the different intensity of vegetation, shown in bright green. These images also show the Salton Sea and the growing cities of El Centro, Calexico, and Mexicali. This valley, also known as the Salton Sink, the Salton Basin, and the Salton Trough, is actually an extension of the Gulf of California, cut off from the Gulf by the Colorado River’s delta fan. The valley was renamed Imperial by turn-of-the-century land investors. The area south of the U.S.-Mexico border is known as the Mexicali Valley. At the bottom of the sink lies the Salton Sea, the largest lake in California. It lacks an outlet to the ocean and lies 70 m below sea level. About 85% of the sea’s inflows come from agricultural runoff, and its waters are 37% saltier than the Pacific Ocean. |
Agriculture, Cities, Water | |||||||||||||||||||||||||||||||
| Impervious Surface | Earthshots | impervious surface, land cover maps, population, urban growth | NLCD images of western Las Vegas show that… |
NLCD images of western Las Vegas show that much more urban expansion took place here between 2001 and 2006 than over the next 5 years. The land cover classes that expand noticeably in these images are the developed classes. With these classes, NLCD can be used to track changes to impervious surface. Impervious surfaces include roads, buildings, and parking lots—surfaces that do not allow rainwater to soak into the ground. The extent and density of impervious surface can affect water quality and flooding severity in urban areas. In a forested area, for example, most rainfall soaks into the soils and is stored as groundwater, slowing the discharge into streams. Flooding in these areas is less significant. In urban areas, however, much more water runs off into streams quickly and increases the likelihood of severe flooding. Studying impervious surface change allows scientists to quantify the extent of developed land cover regionally and nationally. NLCD is widely used to evaluate effects on hydrological and ecological systems in many urban areas. Impervious surfaces are best measured with satellites. They cannot be easily or cost-effectively measured on the ground. |
Cities, Deserts, Water | |||||||||||||||||||||||||||||||
| Impervious Surface | Earthshots | impervious surface, streamflow, urban growth | Scientists studying the effects of urban… |
Scientists studying the effects of urban growth are concerned with surface imperviousness—the amount of land covered by human-made features such as asphalt, concrete, and rooftops. These surfaces are impervious to rainwater. On these surfaces, rainfall does not soak into the land; instead, it runs down the streets or across parking lots, often pooling up in low-lying areas, increasing the risk of local flooding. During heavy rainfall, areas of increased impervious surface can be more vulnerable to flash floods. The excess water flows directly to streams, often by way of storm water drains. This directly increases streamflow and reduces the amount of water that infiltrates into the ground. In these images, Pune itself is at the bottom right at the sharp bend of the Mula-Mutha River. Toward the top center of these images is Pimpri-Chinchwad. The pink, maroon, and lavender tones are the colors associated with impervious surfaces. In many areas, urban areas are expanding over what was once either agriculture or bare ground, visibly increasing impervious surface. Even at Landsat’s 30-m resolution, roads and structures can be seen to increase across the landscape. Some individual buildings can be seen, too—the bright rectangles to the north. Green rectangles are farm fields in the center of the images. Over time, many of them convert to built-up impervious surface. Scientists use hydrological models to quantify how streamflow changes in areas of increased urban growth. They can better understand how the entire watershed is changing due to urbanization. In the Mula-Mutha subwatershed where Pune is, average streamflow increased from 179.14 m3/s to 185.23 m3/s between 1980 and 2009. Landsat data can be used to map impervious surfaces and quantify the effect of the increased runoff it causes. Landsat can also be used with the European Space Agency’s Sentinel-2 satellites to get more frequent coverage of study areas. |
Cities | |||||||||||||||||||||||||||||||
| In Situ Mining | Earthshots | bitumen, boreal forest, oil, oil sands, well pads | To extract oil that is too deep for surface… |
To extract oil that is too deep for surface mining operations, in situ mining, or “in place” mining, is used. Mining companies use steam and gravity to bring the sticky oil to the surface. This method is used where the oil sand layer is deeper than 75 meters (246 feet). Two parallel L-shaped wells reach into the deep oil sand deposit. One injects steam through holes in the pipe. This warms the oil and lowers its viscosity. The oil then flows down to the well below where it’s pumped to the surface. This method is not as visible in the Landsat images as the surface mining is. Each well needs a “well pad,” a small area of boreal forest cleared. A growing number of small dots appear in a grid pattern over the time series images. A vertical line appears near the top of the 2009 image. This airport was built to fly in workers close to the mining sites. Again, an image from Europe's Copernicus Sentinel-2 satellite from 2022, shows the area in slightly finer detail at 20-meter resolution. The dots that represent well sites appear a little sharper in this view. |
Forests, Mining, Natural-Disasters | |||||||||||||||||||||||||||||||
| Indiana | Shaded Relief | Shaded Relief Images of specific areas (generally… | Shaded Relief Images of specific areas (generally by state) have been selected from the National Elevation Dataset. For original data details, see NED. |
|||||||||||||||||||||||||||||||||
| Indiana | State Mosaics | More major highways intersect in Indiana than in… | More major highways intersect in Indiana than in any other state, therefore, it is known as “The Crossroads of America.” Indiana also has more miles of Interstate Highway per square mile than any other state. |
|||||||||||||||||||||||||||||||||
| Indiana Flooding | Image of the Week | flooding, rain, rivers, storms | ||||||||||||||||||||||||||||||||||
| Industrial Evolution in New York | Image of the Week | industry, warehouses | The Staten Island Industrial Park in New York is… | The Staten Island Industrial Park in New York is now home to warehouse and distribution centers for companies like Amazon and IKEA, seen here in imagery from Europe's Copernicus Sentinel-2 satellite. But aerial imagery from 1995 shows large oil storage tanks in the same location. The observed changes in this industrial zone highlight an interesting evolution from an economy powered by fossil fuels, to one equally dependent on electronic commerce and retail distribution. By 2006, some of the tanks had been removed. The space transformed slowly in the years that followed with a 975,000 square foot warehouse nearing completion in 2017. Additional buildings were finished shortly after including an 850,000 square foot fulfillment center now used by the online retailer, Amazon. Imagery archived by the USGS Earth Resources Observation and Science Center is offered free of charge, and is used worldwide to track changes through time. |
||||||||||||||||||||||||||||||||
| Industry | Earthshots | evaporation, evaporation ponds, potash, salt, salt pan, salt ponds, saltwater, sea, sea level, water use | The Dead Sea has no outlet. The only way water… |
The Dead Sea has no outlet. The only way water exits the sea is by evaporation. When the water evaporates, it leaves behind dissolved minerals, making the water even saltier. Those minerals produce the basis for a valuable potash industry. Companies from both Israel and Jordan extract this raw material for fertilizer from the evaporation ponds in the southern basin. The industries that produce the potash pump water from the Dead Sea into these evaporation ponds. Potash is gathered by moving water from one evaporation pond to another. Current studies suggest that as Dead Sea water use continues, sea levels could decline to 100 meters below the 1960s level by 2050. It would then become too expensive to pump water into the evaporation ponds. Other uses of Dead Sea salt include
Normally, political boundaries are not visible from space. But in this series of Landsat images, we do see a political feature. The curved line in the southern basin is the border between Israel to the west and Jordan to the east. |
Water | |||||||||||||||||||||||||||||||
| Industry | Earthshots | delta, megacities, urban growth | The PRD was mostly rural before the 1978… |
The PRD was mostly rural before the 1978 reforms began. The major industries were farming and aquaculture. The major crops were rice, sugar cane, peanuts, soybeans, bananas, and oranges. Fish were raised in a huge system of artificial ponds. The region’s economic growth is now outpacing the rest of the country. The relatively small farming and fishing villages have become large metropolitan areas. The PRD is a major center for telecommunications, biomedicine, robotics, genomics, and manufacturing of electronics, household appliances, computer equipment, toys, garments, footwear, plastic products, and ceramics. The dark green areas in between cities seen in these images are the region’s dike-pond system. These artificial wetlands have been there since the Tang Dynasty, over a thousand years ago. Grass carp are grown for food in the ponds. Vegetables, sugar cane, and other plants are grown on the dikes. Mulberry trees are also grown on the dikes, and the leaves are used to feed silkworms. In this area south of Foshan, the dike-ponds are diminishing. The vast increase in manufacturing puts pollutants into the delta, reducing the amount of fish produced. Additionally, infrastructure is built on land that once had fertile soils and fish ponds. However, the dike-ponds are also extending toward the south and east, replacing farmland. Their extent now covers a wider range and is increasingly fragmented. |
Agriculture, Cities, Coasts | |||||||||||||||||||||||||||||||
| Infrared Views of Fire | Earthshots | burn severity, fire scars, infrared | In natural color satellite images of wildfires… |
In natural color satellite images of wildfires, smoke often obscures the view of the ground. Landsat uses several infrared wavelengths, or bands, of light. If some of those infrared wavelengths are used, then different details about the location of burned areas emerge. The combination of bands we have been looking at use two infrared wavelengths along with one visible band (green). This combination shows freshly burned areas as deep red and vegetation as green. Smoke from fire appears blue. The infrared bands help us see the burned areas clearly, but the smoke can still get in the way. The third image at the left uses Landsat’s thermal infrared band and a shortwave infrared band to cut through the smoke to see ground conditions. In this false color image, burned areas are red-orange. This view can help people see where fire might be approaching populated areas. |
Fires, Forests, Natural-Disasters | |||||||||||||||||||||||||||||||
| Infrastructure of Landsat Data with Matt Hansen | Video - Landsat | |||||||||||||||||||||||||||||||||||
| Ink Stain | Earth As Art | lagoons, mangrove, mudflats | Like blue ink bleeding onto parchment, the Khor… | Like blue ink bleeding onto parchment, the Khor Kalmat lagoon branches off the Arabian Sea and spills into the southern Pakistan landscape near the Makran Coast Range. Mudflats cover almost the entire lagoon, which fills with shallow water at high tides. The small areas of green are isolated pockets of mangrove forest. |
||||||||||||||||||||||||||||||||
| Inland Delta of the Niger River, Mali | Earthshots | floodplain, floods, lakes, marshes, river, sand dunes | On the edge of the Sahara Desert lies one of… |
On the edge of the Sahara Desert lies one of the world’s most productive wetlands. The Inland Delta of the Niger River in Mali is a vast expanse of lakes, channels, and marshes. The Niger River divides into countless channels and forms the largest wetland in Western Africa. The river and wetland form an important water resource for Mali, a landlocked and generally dry country. This delta floods seasonally from September to December, as rainfall from the river’s headwaters in the Guinea Highlands reaches the delta’s vast flat floodplain. The southern part of the delta is low-lying floodplain with expanses of wetland grasses and reeds. The northern part has sand ridges that emerge from the water during the flood season. The seasonal flooding supports fisheries, pasture, and rice farming. Over 1 million people depend on resources in the delta.
|
Water, Wetlands | |||||||||||||||||||||||||||||||
| Interpret the Images | Earthshots | clearcuts, forestry, logging, reforestation | A more up-close look in the Landsat images… |
A more up-close look in the Landsat images helps you to see the progression of clearcutting and regrowth. The colors in most of these images are a patchwork of tan, white, and various shades of green. First, notice that the landscape changes a lot during this time. How can you ensure that this series of close-up images is the same exact area? Identify features that do not change throughout the series, such as a river, as you click through the time series. Next, notice the difference between the shades of light green and dark green. How would these two areas look if you were standing on the ground? Dark green indicates taller trees and an older forest. Light green areas are only beginning to recover from past logging, so the young trees in these areas are not very tall yet. The tan areas are fresh clearcuts. Using the infrared wavelengths of light that Landsat can detect helps to more clearly see those cleared areas. Compare the amount of tan seen in these images throughout the time series. Can you tell how long it takes for these cleared areas to look as they did before the clearing took place? |
Forests | |||||||||||||||||||||||||||||||
| Introduction - MODIS v6 Data | Video - LP DAAC | |||||||||||||||||||||||||||||||||||
| Introduction to Remote Sensing | Earthshots | Remote sensing means observing something from… |
Remote sensing means observing something from a distance. Satellites observe the Earth from space and help scientists study large tracts of land and how that land changes over time. The sensors onboard the Landsat satellites use reflected light to detect electromagnetic energy on the Earth’s surface. The level of energy is represented by the electromagnetic spectrum, which is the range of energy that comes from the Sun. The light from the Sun that we can see is only a small part of the electromagnetic spectrum and includes the colors of the rainbow. Satellite sensors record this information in different portions of the electromagnetic spectrum, which is measured in wavelengths. Landsat satellite sensors detect both visible and infrared light. When satellite images are made, these “invisible” types of light are assigned visible colors to represent them so that our eyes can see the data. |
Agriculture, Aquaculture, Cities, Coasts, Dams, Deforestation, Deserts, Energy, Fires, Forests, Glaciers, Mining, Mountains, Natural-Disasters, Water, Wetlands, Wildlife | ||||||||||||||||||||||||||||||||
| Iowa | Shaded Relief | Shaded Relief Images of specific areas (generally… | Shaded Relief Images of specific areas (generally by state) have been selected from the National Elevation Dataset. For original data details, see NED. |
|||||||||||||||||||||||||||||||||
| Iowa | State Mosaics | Iowa gets its name from an Indian word meaning “… | Iowa gets its name from an Indian word meaning “land between two rivers.” It is the only state whose east and west borders are entirely formed by water: the Missouri and Mississippi Rivers. |
|||||||||||||||||||||||||||||||||
| Iowa Fields Flattened | Image of the Week | derecho, NDVI, storm, weather | The punishing derecho storm that struck the… | The punishing derecho storm that struck the Midwest in early August had an immediate impact on Iowa's farm fields. But it took weeks for the long term damage to appear in satellite imagery. Landsat 8 passed over central Iowa just one day after 100 mile per hour winds pummeled fields of corn and soybeans leaving thousands without power. The lighter shades of green in the natural color August 11th image signal flattened crops still green with life. Sixteen days later the lighter areas from August 11th appear brown and tan, suggesting more permanent crop damage. Landsat data can also be used to calculate a Normalized Difference Vegetation Index, or NDVI, which is an indicator of plant health. In the NDVI images, darker greens show healthier vegetation. A closer look at the fields north of Ames, Iowa shows a significant drop-off in NDVI between August 11th and August 27th. Iowa's State Climatologist estimated that the storm damaged 3.6 million acres of corn, and 2.5 million acres of soybeans in the state. |
||||||||||||||||||||||||||||||||
| Iraqi Emplacement | Earth As Art | land conversion | In an area north of the city of Al-Basrah, Iraq,… | In an area north of the city of Al-Basrah, Iraq, which borders Iran, a former wetland has been drained and walled off. Now littered with minefields and gun emplacements, it is a staging area for military exercises. |
||||||||||||||||||||||||||||||||
| Irma Churns Up Sediment in the Florida Keys | Image of the Week | hurricanes, sediment, storms, weather | Hurricane Irma crossed the Florida Keys the… | Hurricane Irma crossed the Florida Keys the morning of September 10, 2017, as a Category 4 hurricane with winds of 130 miles per hour. Besides damage done to structures on the islands, the storm also stirred the waters. A natural color Landsat image acquired four days after the storm contrasts with an image acquired in March. The murky green-blue color is near-surface sediment churned up by strong winds. Landsat’s green band penetrates the shallow water to reveal the extent of sediment. The distinct line south of the Keys where the sediment ends is a steep drop-off, the edge of the continental shelf on which the Keys sit. The dark color indicates deeper water compared to the shallower water of the shelf. In the close-up image from March, a wave pattern emerges near Marquesas Keys. These aren’t water waves but sand ripples seen just under the clear water. After the storm, those ripples are obscured by suspended sediment in the turbid water. Minor hurricanes may enhance biodiversity by clearing the reef of dead organisms. Major hurricanes like Irma, however, can damage the marine habitat. The Florida Keys National Marine Sanctuary is still assessing any damage that might have been done to marine habitats, and future Landsat acquisitions will be useful in monitoring the changes that occurred. |
||||||||||||||||||||||||||||||||
| Irrigated Fields | Earthshots | center pivots, irrigation, lakes, water use | The economic viability of this huge project… |
The economic viability of this huge project has been unclear. It’s impossible to say exactly how much the Toshka Project has cost so far—estimates of the project’s final cost range up to $70 billion USD. If more water were to be pumped from Lake Nasser to irrigate hundereds of thousands of hectares of farmland outside the Nile basin, the lake may spill into the Toshka lakes only when there is flooding rains upstream. That's what happened in late 2019. The animation below uses images from Landsat 8 and Sentinel-2 to show the eastern lake filling to capacity—and more—starting in early October. Will people find enough incentive to move to the area and develop it into a “New Nile Valley”? Landsat will continue to track the status of the Toshka region and its agricultural development.
|
Agriculture, Deserts, Water | |||||||||||||||||||||||||||||||
| Irrigation | Earthshots | irrigation | There has been irrigation along the Senegal… |
There has been irrigation along the Senegal River in the Richard Toll, Senegal, area since the 1940s. With little dissolved salt, the quality of water in the Senegal River is generally good for irrigation. However, proper drainage and cropping schedules are needed to keep levels of alkaline content from accumulating in the root zone. In the images, the many bright red fields are mostly sugarcane and rice, and virtually all of them are irrigated. The amount of irrigated land increased greatly in this time frame, and new irrigation canals are visible. The irrigated crops are able to grow in the dry season because they are not dependent on rainfall. On the Mauritania side of the river, growth in agriculture is limited by poor soil quality and lack of agricultural education. Most of the country's food is imported. Since almost half of Mauritania's population lives at or below the national poverty level, the imported food is not always affordable. In 2007, the people's distress was expressed by food riots. In the 2011–2012 growing season, the Mauritanian government began some new strategies to increase the yield and amount of crops grown. By training young farmers about agriculture, investing money into more irrigation, and introducing genetically modified crops that can survive in Mauritanian conditions, leaders of the country are hopeful that better times are to come for farming. |
Deserts | |||||||||||||||||||||||||||||||
| Irritated | Earth As Art | wadis | This natural landscape might appear more like a… | This natural landscape might appear more like a medical illustration of itchy nerve endings. In Western Sahara, Africa, an intense network of wadis drains toward the west, eventually reaching the Atlantic Ocean. These drainage courses are almost always dry in this remote part of the Sahara Desert. |
||||||||||||||||||||||||||||||||
| Isahaya Bay, Japan | Earthshots | algal blooms, dike, fishing, land creation, red tide, seas, seaweed, tidal flats | This series of images of southwestern Japan… |
This series of images of southwestern Japan shows how one change can have far-reaching consequences. The Ariake Sea is an important fishery and resource for cultured nori (seaweed). The controversial Isahaya Bay Reclamation Project has been blamed for recent reduced harvests of fish and nori in the sea. A dike across Isahaya Bay, which was built to create more farmland, has reduced the tidal current mixing of the sea. These weaker tidal currents have led to abrupt changes in the marine environment. The 7-kilometer sea wall (dike) was completed in April 1997, cutting off Isahaya Bay from the waters of the Ariake Sea. It separated thousands of hectares of tidal flats from the Ariake Sea and turned what was once Japan’s largest area of tidal lands into 1,500 hectares of farmland. In the Landsat series of images, the Ariake Sea is the large body of water, and Isahaya Bay lies to its west. The dike can be seen as the straight line in the 2003 and later images, separating dark blue from light blue colored water. Black or very dark blue indicates deep water, and light blue represents shallow water. Forested areas are green, and urban areas are pink. Cropland is distinguished by its rectangular pattern: green shapes are fields with crops, and pink shapes are fields with no crops growing at the time of the image. |
Agriculture, Coasts, Water | |||||||||||||||||||||||||||||||
| Ishinomaki - Before and After | Image of the Week | earthquakes, tsunamis | ||||||||||||||||||||||||||||||||||
| Island Building in the Netherlands | Image Comparison Sliders | artificial islands, dikes, islands, reclamation, sediment | ||||||||||||||||||||||||||||||||||
| Island Rebound | Earth As Art | ice, islands | During the last ice age, Akimiski Island in… | During the last ice age, Akimiski Island in Canada's James Bay lay beneath vast glaciers that pressed down with immense force. As the climate changed and the ice retreated, Akimiski began a gradual rebound. The island's slow but steady increase in elevation is recorded along its naturally terraced edges where the coastline seems etched with bathtub rings, the result of the rising landmass and wave action at previous sea levels. |
||||||||||||||||||||||||||||||||
| Island-Building in the South Pacific | Image of the Week | eruptions, islands, volcanoes | An undersea volcano between the two small islands… | An undersea volcano between the two small islands of Hunga Tonga (right) and Hunga Ha’apai (left) began erupting in early December 2014. After about a month of eruptive activity, a new landmass had formed, nearly joining the two islands.
|
||||||||||||||||||||||||||||||||
| Islands | Earthshots | declassified, islands, lakes, rivers, seas | The name Aral… |
The name Aral means Island. The sea did once have many islands. However, many of them stopped beings islands as the sea dried up. Two of the prominent islands were Vozrozhdeniya and Barsa-Kelmes. Throughout the series of images, they first become larger, then they become peninsulas. They are now fully connected with the mainland. Vozrozhdeniya Island became infamous as the location of the Soviet Union’s secret biological weapons program. In the 1950s, Vozrozhdeniya was a small, isolated island in the middle of the sea. Until the collapse of the Soviet Union in 1991, various pathogens were tested, modified, and possibly weaponized on this island. Vozrozhdeniya Island grew in size and joined the mainland around 2001. As the remote site became accessible, there was concern that the pathogens might have survived and spread to the mainland. In the early 2000s, experts from the United States helped Uzbekistan decontaminate the former island. The former island Barsa-Kelmes is a nature reserve, established in 1939. Its natural isolation gave it great protection. But in 1999, the island became accessible, possibly threatening its pristine nature. It is now a desolate plateau, more vegetated than the surrounding dried sea bottom. However, this vegetation degraded as the sea disappeared. For more information, see the book by Micklin and others, listed in the References section, pages 4 and 22. |
Agriculture, Dams, Water | |||||||||||||||||||||||||||||||
| Isle de Jean Charles, Louisiana | Image of the Week | aerial photos, islands, marshland, sea level rise | Is Louisiana falling into the sea, or is the sea… | Is Louisiana falling into the sea, or is the sea inundating Louisiana? It’s actually a bit of both. To the inhabitants of a tiny island on the bayou, an island getting tinier by the day, it hardly matters. They just know their home is gradually becoming uninhabitable. A USGS report estimates that Louisiana, which experiences more coastal wetland loss than all other states in the conterminous United States combined, lost 5,197 square kilometers (2,006 square miles) of land from 1932 to 2016. A combination of factors is causing this coastal land loss. Marshland, which historically served as protection against storms, has been carved up for oil and gas production activities. The marshland is then open to saltwater intrusion. The low elevation of the region makes it especially vulnerable to sea level rise. These factors have an immediate effect on the Biloxi-Chitimacha-Choctaw community on Isle de Jean Charles, about 75 miles south of New Orleans. The island has lost 98 percent of its landmass since the 1950s. Once 5 miles wide and filled with lush cypress groves and cow pastures, barely a half-square mile of the island remains above water. A variety of images created from data archived at the USGS EROS Center shows how the island and the surrounding delta have changed. Landsat’s 30-meter resolution shows the land loss to the wider delta region over time. Complementing those images are a high-resolution aerial photo from 1963 and a Sentinel-2A image, which shows much more open water in 2017. In the aerial image, open water is the darkest gray and black tones, but in the Sentinel-2A image, open water, represented by blue-gray tones, encroaches on the small island. |
||||||||||||||||||||||||||||||||
| Isle de Jean Charles, Louisiana, USA | Earthshots | bayou, canals, delta, island, marshland, saltwater, saltwater intrusion, sea level rise, sediment, subsidence | Is Louisiana falling into the sea, or is the… |
Is Louisiana falling into the sea, or is the sea inundating Louisiana? It’s actually a bit of both. And to the inhabitants of a tiny island on the bayou, an island getting tinier by the day, it hardly matters. They just know their home is gradually becoming uninhabitable. A USGS report estimates that Louisiana, which experiences more coastal wetland loss than all other states in the conterminous United States combined, lost 5,197 square kilometers (2,006 square miles) of land from 1932 to 2016. Places are actually being removed from maps—NOAA is deleting labels from its maps for bays, islands, streams, and other features that are now underwater. A combination of factors is causing this coastal land loss. Marshland, which historically served as protection against storms, has been carved up for oil and gas production activities. The marshland is then open to saltwater intrusion. The low elevation of the region makes it especially vulnerable to sea level rise. These factors have an immediate effect on the Biloxi-Chitimacha-Choctaw community on Isle de Jean Charles, about 75 miles south of New Orleans. The island has lost 98% of its landmass since the 1950s. Once 5 miles wide and filled with lush cypress groves and cow pastures, barely a half square mile of the island remains above water. The saltwater intrusion and loss of land have made it impossible for residents to continue the tradition of growing their own produce. They can no longer grow their own herbs for medicine. The increased cost of living from having to shop for food they once provided for themselves is a struggle. A variety of images from the EROS archive shows how the island, and the surrounding delta, has changed. A combination of different types of imagery is needed in this location to accurately track the changes over time. High resolution is needed to see the small island, but a frequent repeat cycle reveals the larger changes taking place across the delta. |
Coasts, Water, Wetlands | |||||||||||||||||||||||||||||||
| Isthmus | Earthshots | fjord, islands | The southern tip of Spitsbergen is called… |
The southern tip of Spitsbergen is called Sørkapp Land. Hornsund Fjord nearly divides Spitsbergen and Sørkapp Land into separate islands. Only an isthmus of ice separates the two. The narrowing isthmus could someday make Sørkapp Land a new island. In fact, new islands have formed in other locations on the Arctic coasts of Europe and Greenland. In places where the bedrock is below sea level, sea water inundates the space left by retreating glaciers. The isthmus between Spitsbergen and Sørkapp Land is rapidly thinning and recessing. In 1899–1900, the isthmus was 28 kilometers wide. According to one source, the isthmus was 6.2 kilometers wide as of 2013. Based on the 2019 Landsat image, and measuring the width of the isthmus using geospatial software, the isthmus has narrowed further to about 5 kilometers wide. This ice is grounded well below sea level, so when the ice melts, there will be a strait of open water between the two lands. The same source estimates that the glaciers on the isthmus will retreat enough to make Sørkapp Land an island by 2030–2035. The isthmus decreased from 12.3 kilometers in 1990 to 6.2 kilometers in 2013, with a rate of decrease of about 270 meters per year. This annual decrease is close to matching that 5-kilometer measurement for 2019; in fact, the decrease is slightly faster than the source’s estimate. With the launch of Landsat 9 expected in 2021, Landsat satellites will continue monitoring the progress of these glaciers to see whether Sørkapp Land does indeed become a new island in the Svalbard archipelago.
|
Glaciers | |||||||||||||||||||||||||||||||
| Itaipú Dam | Earthshots | hydropower, river, waterfalls | The world’s largest hydroelectric power plant… |
The world’s largest hydroelectric power plant is on the Paraná River between Paraguay and Brazil. The Itaipú Dam is capable of producing 14,000 megawatts of power. The reservoir behind the dam formed in 1982 and covers 1,350 square kilometers. The entire dam is nearly 8 kilometers long. The maximum discharge capacity of the spillway is 62,200 cubic meters per second, 40 times the mean discharge of Iguazú Falls. Just below the dam is the rapidly expanding city of Ciudad del Este. Its estimated population in 2015 was 317,525. |
Agriculture, Dams, Deforestation, Water | |||||||||||||||||||||||||||||||
| January Rain, Snow Refills California Reservoirs | Image of the Week | drought, lakes, reservoirs | A decade of drought in California has eased after… | A decade of drought in California has eased after the first month of 2017 thanks to heavy rains and snow, a fact that Landsat images are helping to confirm. |
||||||||||||||||||||||||||||||||
| Jau Park | Earth As Art | islands, rivers | Fed by multiple waterways, Brazil's Negro River… | Fed by multiple waterways, Brazil's Negro River is the Amazon River's largest tributary. The mosaic of partially-submerged islands visible in the channel disappears when rainy season downpours raise the water level. |
||||||||||||||||||||||||||||||||
| Joe Pool Lake | Earthshots | lakes, reservoirs, urban growth | Joe Pool Lake, southwest of Dallas, is not… |
Joe Pool Lake, southwest of Dallas, is not present in the 1974 image and shows up in the 1989 image. Impoundment of the lake began in 1986 and opened for fishing and recreation in 1989. |
Cities | |||||||||||||||||||||||||||||||
| Jökulsárlón Lagoon | Earthshots | ice, icebergs, lagoon, lake, proglacial lake, snow | Because of the global trend in retreating… |
Because of the global trend in retreating glaciers since the start of the 20th century, proglacial lake formation has increased. Proglacial lakes are water bodies at the edge of a glacier and form during glacial retreat. Jökulsárlón Lake is an example of this process. Also called Jökulsárlón Lagoon, this tidal inlet was excavated during the last glacial advance, which was about 26,500 years ago. Because of the glacial retreat, the lagoon is expanding at about 0.5 square kilometers per year. By 2014, the lagoon covered about 25.4 square kilometers (9.8 square miles), about the size of Block Island, off the coast of Rhode Island. Jökulsárlón Lagoon connects to the Atlantic Ocean by way of a 100-meter wide and 20-meter deep engineered channel. Because it is connected to the ocean, tides affect the lagoon level. Water flows in at high tides. Its daily tidal range is about 2–3 meters. During summer, meltwater from the glacier increases, bringing freshwater into the lagoon, but this freshwater does not entirely flush the seawater out. The bright specs in the Landsat images are icebergs in the lagoon that broke off the end of the glacier. Sailing among these icebergs is one of the most popular tourist attractions in Iceland. Because 10 percent of Earth’s land surface is covered by glaciers, monitoring changes to glaciers and proglacial lakes is important to predicting the impacts of glacial thinning and retreating. These studies help develop sustainable ways of living with anticipated changes. |
Glaciers, Water | |||||||||||||||||||||||||||||||
| Joplin, Missouri - One Year Later | Image of the Week | storms, tornadoes, weather | ||||||||||||||||||||||||||||||||||
| Jordan | Earth As Art | streambeds, wadis | Meandering wadis combine to form dense,… | Meandering wadis combine to form dense, branching networks across the stark, arid landscape of southeastern Jordan. The Arabic word "wadi" means a gulley or streambed that typically remains dry except after drenching, seasonal rains. |
||||||||||||||||||||||||||||||||
| Juniper Road Fire | Image of the Week | burn scars, smoke | ||||||||||||||||||||||||||||||||||
| Jurong | Earthshots | harbors, islands, land creation | The symbol of the new Singapore may be on the… |
The symbol of the new Singapore may be on the island’s west end, the industrial New Town of Jurong. In 1962, the government began clearing the jungle and building docks by digging into the shore and by extending new land out into the sea. In the 1973 image, you can see cleared and filled expanses still lying bare and bright. By 1990, you can see Jurong’s streets and plantings filling in as it spreads inland. There are obvious land extensions, and the harbor is now busy with ships. Much of Jurong’s shipping has been oil; by the 1990s, only the Gulf Coast and Rotterdam refined more. By the late 1960s, several plants were operating along the shore, and by 1973 you can see several more on the small islands offshore, squeezing out their forests and little fishing villages. By 1990, the islands are filled, and the oil companies have begun extending them. By 2000, the islands are gone, replaced by one large “chemical island” called Jurong Island, with its own new causeway to the mainland. Further development of Jurong Island is evident in the 2009 image. Altogether, the government planned to increase Singapore’s area by 25 percent between independence and “Year X.” Year X was commonly interpreted as 2030, but many developments have pushed ahead of schedule. It appears that this extraordinary nation’s future, like its newest land, is far from settled. |
Cities, Coasts | |||||||||||||||||||||||||||||||
| Kalapana | Earthshots | eruption, island, lava, lava flow, laze, volcano | The Pu‘u ‘Ō‘ō eruption took a destructive turn… |
The Pu‘u ‘Ō‘ō eruption took a destructive turn in March 1990. Breakouts from a lava tube spread lava into the Kalapana community. Images show the entire community, known for its historic sites and black sand beaches, being completely covered with lava. Bright spots in the 1989 and 1991 images are active lava flows. A church, store, and more than 100 homes were buried under 15–25 m of lava. The devastating event finally ended in late 1990 when a new lava tube diverted lava away from Kalapana and back into Hawai‘i Volcanoes National Park. |
Coasts, Natural-Disasters | |||||||||||||||||||||||||||||||
| Kalgoorlie, Western Australia | Earthshots | airport, gold, open pit, ore, tailings ponds | In a remote part of the Western Australia… |
In a remote part of the Western Australia outback lies one of the world’s largest holes in the ground. Known as the Super Pit, the Fimiston Open Pit is part of what is known as the Golden Mile, where gold has been mined continuously since 1893. The mine sits right next to Kalgoorlie-Boulder, a city of about 33,000 located almost 600 kilometers from Perth. The first gold rush here occurred around 1890. The easy-to-reach gold is gone, but small pieces and flakes remain. Work on the Super Pit began in 1989, and now at least 800,000 ounces of gold are dug out of the mine every year. According to the USGS Minerals Commodity Summaries (2018), Australia is the second largest gold producer in the world, after China. Getting at the gold requires removing large amounts of ore. Hence, the gaping hole in the ground next to Kalgoorlie. Sparse vegetation surrounds Kalgoorlie and the mine. Like much of Western Australia, the region surrounding Kalgoorlie and the Super Pit experiences hot summers and cool winters. The water bodies seen in the images south of Kalgoorlie and in the upper left are semi-dry salt lakes. On the eastern side of the Super Pit are the Fimiston Mill, where the ore is processed, waste dumps, and tailings ponds, which appear in the images as gray or white. |
Mining | |||||||||||||||||||||||||||||||
| Kamchatka Peninsula | Earth As Art | ice, snow | The eastern side of Russia's Kamchatka Peninsula… | The eastern side of Russia's Kamchatka Peninsula juts into the Pacific Ocean west of Alaska. In this winter image, a volcanic terrain is hidden under snow-covered peaks and valley glaciers feed blue ice into coastal waters. |
||||||||||||||||||||||||||||||||
| Kansas | Shaded Relief | Shaded Relief Images of specific areas (generally… | Shaded Relief Images of specific areas (generally by state) have been selected from the National Elevation Dataset. For original data details, see NED. |
|||||||||||||||||||||||||||||||||
| Kansas | State Mosaics | Located just southeast of Osborne, Kansas, is the… | Located just southeast of Osborne, Kansas, is the Geodetic Center of North America. The Geodetic Center is the initial point upon which all North American surveys, deeds, and maps are based. |
|||||||||||||||||||||||||||||||||
| Kara-Bogaz-Gol, Turkmenistan | Earthshots | lagoon, rivers, salt, saltwater, sea, sea level | The Kara-Bogaz-Gol (KBG) is a large, shallow… |
The Kara-Bogaz-Gol (KBG) is a large, shallow lagoon of the Caspian Sea. It normally covers about 18,000 square kilometers and is just a few meters deep. The Caspian Sea is the largest inland body of water in the world, often categorized as a large salt lake. It is salty because rivers (especially the Volga) flow into it, but none flow out. Water leaves only through evaporation, and the dissolved salts remain. The Caspian is below sea level, and the KBG is 2–3 meters lower, so water flows from the Caspian through a narrow strait into the KBG, where it evaporates. The KBG is far saltier than the Caspian, and is one of the saltiest bodies of water in the world. Its salinity is 300–350 parts per thousand, while the Caspian’s is about 13 parts per thousand. (The ocean’s salinity averages about 35 parts per thousand.) Since the KBG’s water flows in from the Caspian, the Caspian’s fluctuations affect the KBG. |
Dams, Water | |||||||||||||||||||||||||||||||
| Karman Vortices | Earth As Art | clouds, islands | Each of these swirling clouds is a result of a… | Each of these swirling clouds is a result of a meteorological phenomenon known as a Karman vortex. These vortices appeared over Alexander Selkirk Island in the southern Pacific Ocean. Rising precipitously from the surrounding waters, the island's highest point is nearly a mile (1.6 km) above sea level. As wind-driven clouds encounter this obstacle, they flow around it to form these large, spinning eddies. |
||||||||||||||||||||||||||||||||
| Kaskawulsh Glacier, Canada | Image of the Week | lakes, rivers, sediment | Like most glaciers worldwide, Kaskawulsh Glacier… | Like most glaciers worldwide, Kaskawulsh Glacier in the Kluane National Park and Reserve of southwestern Yukon Territory, Canada, has retreated over the past several decades. An article in the journal Nature Geoscience confirms that this glacier’s retreat caused a rare instance of “river piracy”—the diversion of the headwaters of one stream into another one. The end of Kaskawulsh Glacier lies at a drainage divide. Before spring 2016, the majority of the glacier’s meltwater flowed north by way of the Slims River into Kluane Lake, and from there into the Yukon River and to the Bering Sea. As the 2016 Landsat 8 image shows, the majority of the meltwater now flows toward the east into the Kaskawulsh River, which makes its way to the Alsek River and to the Pacific Ocean. The meltwater from the glacier previously had brought a large supply of sediment to Kluane Lake. With this sediment supply ending, the ecosystem of the lake could change. On the other hand, increased sediment and a higher volume of water now flowing into the Kaskawulsh River may increase its bank erosion. For both rivers, the sediment changes, varied timing of flows from the glacier, and amount of water in the channels could affect fish populations and habitats downstream. The researchers point out that this change is likely long-term, so downstream ecosystems could be permanently altered. Landsat can help study these changes to the habitats of the region. |
||||||||||||||||||||||||||||||||
| Katse Dam | Earthshots | hydropower, lakes, reservoirs, rivers | The first part of the LHWP was the … |
The first part of the LHWP was the Katse Dam. Construction started on the Katse Dam in 1991 on the Malibamats’o River, a tributary of the Orange (Senqu) River. The dam was completed in 1997 and is 710 meters long and 185 meters high. The deep lake formed by the dam can hold 2 billion cubic meters of water, but the winding and narrow reservoir has a surface area of only 35.8 square kilometers. This small surface area minimizes evaporation loss. The 1995 image, before the dam was completed, hints at the depth of the valleys that were later filled. This reservoir is the key to the electricity needs of Lesotho and the water needs of South Africa. A 45-kilometer long tunnel brings water from the Katse reservoir to the Muela hydropower station, which can generate 72 megawatts of electricity. Three turbines each generate 24 megawatts. An intake tower in the reservoir transfers water 82 kilometers from Lesotho to South Africa. |
Dams, Mountains, Water | |||||||||||||||||||||||||||||||
| Kazakhstan, North Aral Sea | Earthshots | declassified, fishing, lakes, rivers, saltwater, seas, water use | While the entire Aral Sea is shrinking… |
While the entire Aral Sea is shrinking dramatically, these images show that the northern portion of the sea, while clearly smaller than it was in 1964 and 1977, is not losing water at the same rate as the South Aral. The North and South Arals became separated sometime in the 1980s. The two had been joined by the Berg Strait. By the time of the 1987 image, this strait became more of a land bridge. In the 1990s, a dam was built to prevent North Aral water from flowing into the South Aral. It was rebuilt in 2005 and named the Kok-Aral Dam. It caused the North Aral water level to be stabilized with a lower level of salinity. Consequently, commercial fishing began to rebound. Throughout the 2000s, the North and South Arals continued to develop as separate water bodies, and the South Aral continues to experience more drastic changes than the North Aral.
|
Agriculture, Dams, Water | |||||||||||||||||||||||||||||||
| KBG Water Level | Earthshots | lagoon, salt, saltwater, sea | In 1980, the Soviets dammed the Caspian-KBG… |
In 1980, the Soviets dammed the Caspian-KBG strait. The Soviets intended that some water would remain in the KBG, enough to keep the salt industry operating. It was believed that even without inflow from the Caspian, the existing water might last up to 25 years. But by November 1983, the KBG had entirely dried up. In the spring of 1992 after the Soviet Union broke up, President Sapamurat Niyazov of Turkmenistan took a spade to the dam to symbolically begin its demolition. After the demolition of the dam, the KBG soon filled, and its level has remained stable. In these images, you can see the difference in color between the Caspian to the west and the KBG to the east. Pure water absorbs light from the sun, but the KBG water has suspended solids (including precipitated salt) that reflect more light. The KBG is also shallow, so the bottom is reflecting some light back through the water. Dry or shallowly covered salt beds appear white because they are highly reflective. Also notice the general absence in these images of bright red, which would represent vegetation. |
Dams, Water | |||||||||||||||||||||||||||||||
| Kentucky | Shaded Relief | Shaded Relief Images of specific areas (generally… | Shaded Relief Images of specific areas (generally by state) have been selected from the National Elevation Dataset. For original data details, see NED. |
|||||||||||||||||||||||||||||||||
| Kentucky | State Mosaics | Mammoth Cave, Kentucky is the world’s longest… | Mammoth Cave, Kentucky is the world’s longest cave system, with more than 400 miles explored. Tours of Mammoth Cave have been given since 1816. |
|||||||||||||||||||||||||||||||||
| Kilauea 2021 | Image of the Week | craters, eruption, lava, lava flows, lava lake, volcano | The volcanic activity of Kilauea continues on the… | The volcanic activity of Kilauea continues on the island of Hawaii. The latest eruption began within Halema'uma'u Crater on September 29. The previous eruption just ended in May 2021. Before that, major lava flows covered the eastern tip of Hawaii's Big Island in 2018. This latest eruption included vigorous fountaining up to 50-60m high. Landsat 8 infrared imagery reveals a lava lake inside the crater. At the USGS EROS Center, we study land change and produce land change data products used by researchers, resource managers, and policy makers across the nation and around the world. We also operate the Landsat satellite program with NASA, and maintain the largest civilian collection of images of the Earth’s land surface in existence, including tens of millions of satellite images. You can learn more about the USGS EROS and the Landsat Program at https://eros.usgs.gov |
||||||||||||||||||||||||||||||||
| Kīlauea, Hawaii, USA | Earthshots | crater, eruption, fissure, island, lava, lava flow, laze, volcano | In 2018, Hawaii was in the news as fresh lava… |
In 2018, Hawaii was in the news as fresh lava covered 13.7 square miles (35.5 km2) at the eastern end of the Big Island. Of course, lava flows in Hawaii are nothing new. Satellite imagery shows evidence of many lava flows from the past, appearing like dark curtains draped across the southern coast of the island. The lava flows on this part of the island are from Kīlauea, the youngest volcano on the Island of Hawai‘i. Almost all of Kīlauea’s surface is made up of rock that is less than 1,000 years old. It’s on the southeastern flank of Mauna Loa but has its own magma plumbing system, so it’s a separate volcano. This shield volcano is one of the world’s most active. |
Coasts, Natural-Disasters | |||||||||||||||||||||||||||||||
| Kilauea, Mauna Loa Volcanoes Shape the Face of Hawaii | Image of the Week | islands, lava, lava flows, national parks, volcanoes | Hawaii’s Volcanoes National Park reminds humanity… | Hawaii’s Volcanoes National Park reminds humanity that no matter how much it alters the face of the Earth to meet its needs, it has no control when nature decides to unleash its awesome, eruptive powers. Though the park celebrates its 100th anniversary on August 1, 2016, its main attractions—Kilauea and Mauna Loa volcanoes—have been adding to the land mass of Hawaii’s “Big Island” for at least 400,000 years. That expansion continues today as bright molten lava from Kilauea flows downslope across the coastal plain on its south flank, spilling over a cliff on its way to a steamy transformation to hard rock in the Pacific Ocean. The Operational Land Imager from Landsat 8, as well as NASA’s Advanced Spaceborne Thermal Emission and Reflection Radiometer (ASTER) and Moderate Resolution Imaging Spectroradiometer (MODIS) sensors, show that volcanic influence in several ways. MODIS captures the 1,700-mile stretch of the Hawaiian Islands that began to emerge from volcanic eruptions during the Quaternary Period beginning 2.588 million years ago. A mosaic of Landsat images from October 2015 and February 2016 reveals the extent of Kilauea’s and Mauna Loa’s presence on the big island of Hawaii, and ASTER zooms in even closer on the lava flows and tubes that channel descending lavas from the summit craters and fissure vents. Even now, in this year of centennial celebrations for both Hawaii Volcanoes National Park and the National Park Service, imagery from sensors such as these will continue to show change with time. Kilauea and Mauna Loa are two of the world’s most active volcanoes. They will be adding land mass to the “Big Island" for years to come. |
||||||||||||||||||||||||||||||||
| Kilimanjaro | Earth As Art | national parks | Portions of Kenya and Tanzania, Africa can be… | Portions of Kenya and Tanzania, Africa can be seen in this image. The peak of Kilimanjaro is on the right; the mountain is flanked by the plains of Amboseli National Park to the north and the rugged Arusha National Park to the south and west. |
||||||||||||||||||||||||||||||||
| Kingston Flood | Image of the Week | flooding, rivers | ||||||||||||||||||||||||||||||||||
| Knife River Delta, Canada | Earthshots | marsh, migration, prairie, tundra | These images show devegetated shoreline along… |
These images show devegetated shoreline along Hudson Bay in central Canada, eaten bare by growing numbers of snow geese. In the Landsat images, red signifies vegetation. Hudson Bay appears black in the upper-right of the images, and north of the Knife River Delta is a bright strip of land eaten bare by the geese. These Mid-Continent snow geese live in coastal marshes along the Gulf of Mexico in winter and along Hudson Bay in summer. They spend almost all spring and fall migrating back and forth. Their traditional winter diet is marsh hay cordgrass, saltgrass, bulrush, and other marsh plants. Snow geese are not only grazers but also grubbers, digging up even the underground parts of plants with their strong bills. In the spring, the snow geese fly north along well-defined paths through the prairies, stopping often to eat along the way. They linger on the prairies of the northern United States and southern Canada until about early May, then fly nonstop across the northern forests to coastal areas around Hudson Bay and farther north. Once at the nesting ground, they start breeding. The northern summer is just long enough for goslings to hatch and learn to fly. Female snow geese have strong homing habits, returning to the spot where they were raised and even using their previous nest sites. Snow geese form large colonies of a few hundred to over 100,000 birds. Nearby La Perouse Bay (marked on this map) has the best-known colony in the world, studied by scientists since 1968. Up in the tundra, summer is short and the soil is shallow and dry. Nesting snow geese seek out the lusher "oases" in this arctic "desert," narrow productive strips of a few hundred yards along the Bay and along some inland lakes. But even here food is sparse, since the geese leave just as the growing season is ending, with no time for the plants to recover before the next spring. So even in a good summer, the females rely on stored energy in their bodies to produce and incubate their eggs. To produce a large clutch of eggs, they need to arrive at Hudson Bay fat and healthy. So traditionally, the amount of food available during winter and spring acted as one of the limits on the snow goose population. European settlement brought good times for snow geese, as the Louisiana-Manitoba corridor became one long buffet line for them. By the mid-1900s degradation and draining of the Gulf Coast marshes pushed many snow geese inland, where they learned to feed on the stubble and seeds of wheat, corn, and especially rice fields. There were rice farmers in Texas who suddenly went from having no geese to flocks of thousands in the late 1940s. As Midwestern agriculture intensified, some birds stopped going to the coast, instead wintering as far north as Iowa. This southern "gravy train" improved the snow geese's winter survival rates and springtime weight gain. Fatter, more numerous females then produced more goslings. The young flying south for the first time found more food along the way. Flocks inevitably grew; in 25 years the Mid-Continent population increased from about 2 million to 5 million birds. The colony at La Perouse Bay grew from 2,000 nesting pairs in 1968 to 22,500 in 1990. |
Coasts, Wildlife | |||||||||||||||||||||||||||||||
| Koettlitz Glacier | Earth As Art | ice | Landsat 8 helps reveal the hidden complexities of… | Landsat 8 helps reveal the hidden complexities of the Antarctic landscape. In this image, ice takes on different levels of blue with exposed rock and dirt appearing in yellow tones. The dynamic Koettlitz Glacier flows between Brown Peninsula and the rugged mainland. |
||||||||||||||||||||||||||||||||
| Kok-Aral Dam | Earthshots | declassified, lakes, rivers, saltwater, seas | The Kok-Aral Dam was completed in 2005 to… |
The Kok-Aral Dam was completed in 2005 to control the water level of the North Aral Sea. This dam has prevented further decline of the North Aral Sea, and by 2011 it helped restore the water salinity level to the that of the 1960s (8 grams per liter). A dam can be seen as early as the 1998 image. It’s the straight angled lines on the southernmost part of the North Aral. This earthen dike was built in 1992 and later replaced by a concrete dam in 2005. At times, water from the North Aral is allowed to flow southward into the South Aral through the dam in the Berg Strait. |
Agriculture, Dams, Water | |||||||||||||||||||||||||||||||
| Konari, Iran | Earth As Art | rivers | The Mand River and the small town of Konari… | The Mand River and the small town of Konari nestle in the Zagros Mountains in western Iran. |
||||||||||||||||||||||||||||||||
| La Rioja, Argentina | Image of the Week | irrigation, population, reservoirs, urban growth | The city of La Rioja is located on the eastern… | The city of La Rioja is located on the eastern foothills of the Sierra de Velasco mountain range in northwestern Argentina. The Los Sauces Reservoir and Dam can also be seen to the west of the city.
|
||||||||||||||||||||||||||||||||
| LaCordillera Regrowth | Image of the Week | burn scars, smoke | ||||||||||||||||||||||||||||||||||
| Laguna Pastos Grandes, Bolivia | Image of the Week | infrared, lakes, saltwater | Laguna Pastos Grandes is a shallow salt lake… | Laguna Pastos Grandes is a shallow salt lake located in Bolivia’s Pastos Grandes volcanic caldera. Fed by intermittent rivers and springs, the lake contains high concentrations of lithium, potassium, and boron. These three images show how Landsat 8’s extended spectral capabilities can be used to highlight various surface features, often with vibrant results. |
||||||||||||||||||||||||||||||||
| Lake Amadeus | Earth As Art | burn scars, lakes | Like frantic brushstrokes, fire scars cover the… | Like frantic brushstrokes, fire scars cover the arid landscape near Lake Amadeus (upper right) in Australia's Northern Territory. Lake Amadeus is rich in salts that have been leached out of underlying sediments. When dry, its lake bed is transformed into a glistening sheet of white salt crystals. |
||||||||||||||||||||||||||||||||
| Lake Ayakkum | Image of the Week | deltas, lakes, water use | ||||||||||||||||||||||||||||||||||
| Lake Basaka, Ethiopia | Image of the Week | irrigation, lakes, water use | ||||||||||||||||||||||||||||||||||
| Lake Carnegie | Earth As Art | lakes, marshland | Ephemeral Lake Carnegie, in Western Australia,… | Ephemeral Lake Carnegie, in Western Australia, fills with water only during periods of significant rainfall. In dry years, it is reduced to a muddy marsh. |
||||||||||||||||||||||||||||||||
| Lake Chad, West Africa | Earthshots | islands, lake, rain, river | Lake Chad was once the sixth largest lake in… |
Lake Chad was once the sixth largest lake in the world, but prolonged drought and increased water use have shrunk the lake dramatically. It now spans less than a tenth of the area it covered in the 1960s. Back then, the lake covered about 25,000 square kilometers, an area the size of the U.S. state of Vermont. Now it’s smaller than Rhode Island. The fluctuations in lake water levels have stabilized in recent years, but it is still a dynamic environment. Social conflicts and insecurity in the region make it difficult to monitor water levels with ground-based measurements. Satellite imaging has therefore been crucial to monitoring the changes to the lake, especially with the infrared bands on Landsat sensors, which make it easier to distinguish water and vegetation. These Landsat images show the overall transition of Lake Chad from open water to wetland. The desert appears tan, wetlands are green, and open water is blue. The black and white 1963 image is from the film-based Argon reconnaissance satellite program, declassified in the 1990s. |
Water, Wetlands | |||||||||||||||||||||||||||||||
| Lake Chilwa, Malawi | Image of the Week | lakes | Lake Chilwa is a shallow, enclosed saline lake… | Lake Chilwa is a shallow, enclosed saline lake located along the East African Rift Valley in southern Malawi, near its border with Mozambique. Landsat data are extremely useful for scientists and authorities to monitor water resources and land cover changes over time. |
||||||||||||||||||||||||||||||||
| Lake Disappointment | Earth As Art | lakes, saltwater, sand dunes | Surrounded by sand dunes, Lake Disappointment is… | Surrounded by sand dunes, Lake Disappointment is an ephemeral salt lake in one of the most remote areas of Western Australia. An early explorer supposedly named the lake in 1897 after following a number of creeks that he thought would lead to a large lake; they did, but the lake's extremely salty water was not drinkable. |
||||||||||||||||||||||||||||||||
| Lake District | Earth As Art | lakes, mudflats, tides | A popular holiday destination, the Lake District… | A popular holiday destination, the Lake District in northwestern England is a region of picturesque mountains and long, narrow lakes. Most of the lakes lie in U-shaped valleys that were carved by glaciers during the last ice age. Morecambe Bay, below the Lake District, opens into the Irish Sea. This large expanse of intertidal sand and mudflats is notorious for its quicksand and tides that are said to move "as fast as a horse can run." |
||||||||||||||||||||||||||||||||
| Lake Etang Saumatre and Lake Lago Enriquillo | Image of the Week | flooding, lakes | ||||||||||||||||||||||||||||||||||
| Lake Eyre | Earth As Art | lakes, rain | Do you see a scary face looking back at you? The… | Do you see a scary face looking back at you? The hollow-appearing eyes, narrow nose, and slash of a mouth are inundated patches of shallow Lake Eyre (pronounced "air"). Deep in the desert country of northern South Australia, Lake Eyre is an ephemeral feature of this flat, parched landscape. When seasonal rains are abundant, water fills the lakebed to some degree. During the last 150 years, Lake Eyre has filled completely only three times. When brimming, it is Australia's largest lake. |
||||||||||||||||||||||||||||||||
| Lake Gowd-e-Zareh | Earthshots | irrigation, lake, river, salt flats, saltwater | Water from the Helmand River is used upstream… |
Water from the Helmand River is used upstream for agriculture. The river turns west and flows across the border into Iran and drains into the Lake Hamoun wetlands. Lake Gowd-e-Zareh, at the southern end of the Sistan basin, is the lowest level of the basin and only receives runoff when the river overflows, every 10 years on average. It has no outlet—water is lost only via evaporation, so it is a hypersaline lake. Temporary vegetation grows along the lake’s shore (shown as red in the 1998 and 2000 images) where the water from Lake Hamoun overspill is less salty. |
Deserts, Water, Wetlands | |||||||||||||||||||||||||||||||
| Lake Hamoun, Iran and Afghanistan | Earthshots | canal, drought, dust storms, irrigation, lake, reservoir, river, salt flats, saltwater, snow | The Sistan Basin lies on the Iran-Afghanistan… |
The Sistan Basin lies on the Iran-Afghanistan border. Melted snow from the Hindu Kush Mountains of Afghanistan nourishes this dry basin. The Helmand River carries the snowmelt across the Margo Desert and into the Sistan Basin, where the water pools into Lake Hamoun. Sometimes anyway. Lake Hamoun is seasonal, and water is generally only present during the spring melt season. Surrounded by hundreds of kilometers of arid plains, the Sistan Basin is in one of the driest regions of the world, so the three shallow lakes that make up Hamoun naturally expand and contract in the wet to dry seasons. These lakes and wetlands once supported great plant and animal diversity. But the combination of drought and water diversion for irrigation has caused Lake Hamoun to nearly disappear, along with the local bird and fish populations. |
Deserts, Water, Wetlands | |||||||||||||||||||||||||||||||
| Lake Havasu City and London Bridge | Image of the Week | aerial photos, bridges | London Bridge was indeed falling down. Set to be… | London Bridge was indeed falling down. Set to be torn apart and replaced in the 1960s, this bridge across the River Thames was purchased by businessman Robert McCulloch in April 1968 and shipped across the Atlantic to Lake Havasu City, Arizona, billed as the world’s largest antique. USGS aerial photos show the location in 1969, and in 1972, before and after the bridge’s relocation. Installed strictly as a tourist attraction for the growing city, it was assembled on desert sand with a channel dredged out below, converting a Lake Havasu peninsula into an island. Landsat images show a wider view of Lake Havasu City growth. London Bridge has stood for over 188 years on two continents, and remains this city’s most famous landmark. Historical aerial photos and Landsat images are freely available at USGS EarthExplorer. |
||||||||||||||||||||||||||||||||
| Lake Ketelmeer and the IJsseloog | Earthshots | artificial islands, lake, land creation, land reclamation | The narrow lake east of IJsselmeer is Lake… |
The narrow lake east of IJsselmeer is Lake Ketelmeer. The lake receives water from rivers that carry industrial pollutants from factories upstream. Those polluted sediments have settled to the bottom in a thick layer of contaminated sludge. To restore a normal aquatic environment, this material needs to be removed from the lakebed. In the middle of the lake, in the 2010 image, a circular feature appears. This artificial island is called the IJsseloog, a repository for contaminated material dredged from the bottom of the lake. Once the repository is full, it will be capped and turned into a nature reserve. |
Agriculture, Coasts, Water | |||||||||||||||||||||||||||||||
| Lake Lanier Hits 40-Year High Water Mark | Image Comparison Sliders | lakes, rain, reservoirs, rivers, water use | ||||||||||||||||||||||||||||||||||
| Lake Las Vegas | Earthshots | construction, golf courses, lakes, population, rivers, urban growth, water use | Between 1986 and 1992, a lake appeared east of… |
Between 1986 and 1992, a lake appeared east of the city, along Las Vegas Wash, a riparian area. This is Lake Las Vegas, a privately owned lake that is part of a commercial residential resort. You can see that unlike Lake Mead, it is fringed with land that has been cleared for building. This appears as a bright halo in the 1992 Landsat image. After 1992, golf courses and residential and resort buildings were built up along the shores of the southern portion of the lake. |
Cities, Deserts, Water | |||||||||||||||||||||||||||||||
| Lake Levels in Hispaniola Rise Dramatically | Image of the Week | flooding, lakes, rain, rivers | Landsat imagery shows a dramatic change in lakes… | Landsat imagery shows a dramatic change in lakes Azuéi and Enriquillo, inland saltwater lakes on the Caribbean island of Hispaniola that are known for their crocodiles and iguanas. |
||||||||||||||||||||||||||||||||
| Lake Levels Rise | Earthshots | algae blooms, flooding, floods, lakes, rivers | A general trend of above average precipitation… |
A general trend of above average precipitation in the region has caused Devils Lake to rise rapidly over the last few decades. If the lake reaches 1,458 feet (444.4 meters) above mean sea level, it will naturally overflow into the Sheyenne River, a tributary of the Red River. The North Dakota Geological Survey has determined that the lake has probably overflowed into the Sheyenne River only twice in the last 4,000 years. These Landsat images clearly show the lake’s dramatic change. In 1993, the lake water level was 1,422.6 feet (433.6 meters) above mean sea level. The lake reached an all-time high of 1,454.4 feet (443.3 meters) above mean sea level in June 2011. In 1993, the lake covered about 44,000 acres (17,800 hectares)—it has expanded to over 211,000 acres (85,400 hectares). Even though it is still a few feet from its overflow level, the lake’s rapid rise is a great concern for residents of the region. If the lake does reach its overflow level, natural flooding could cause considerable damage downstream. The loss of farmland caused by the rising water has already been devastating to local farmers. Another concern is algae blooms. The 2018 images show blue-green algae discoloring the water. In a severe algae bloom, the water can resemble spilled green paint or green pea soup. |
Dams, Water | |||||||||||||||||||||||||||||||
| Lake Mead | Earthshots | lakes, population, reservoirs, rivers, urban growth, water use | How is Las Vegas getting enough water for its… |
How is Las Vegas getting enough water for its expanding population? Most of it comes from Lake Mead on the Colorado River. The Colorado River provides water for Las Vegas, as well as Phoenix, Los Angeles, and San Diego. As the populations of all of these cities continue to grow, water demand also increases. However, less snowpack in the mountains in recent years has reduced the river’s flow and thus the amount of water stored in the reservoir. Landsat images starting in 1972 show the changing water level of the lake. U.S. Bureau of Reclamation records show its highest level was in July 1983, when it was 1,225 feet above sea level. In July 2022, Lake Mead’s water level fell to 1,041 feet. The level hasn’t been this low since the lake began filling in the 1930s. In December 2023, the lake was reported to be 34% full. The drop in lake level isn’t even as apparent as it might otherwise be because of the steep topography in the region. Lake Mead is inside a canyon environment, so the drastic reduction in lake level does not equate to as drastic of a reduction in surface area, even though the surface area reduction is quite noticeable. |
Cities, Deserts, Water | |||||||||||||||||||||||||||||||
| Lake Mead and the Megadrought | Image of the Week | drought, lakes, rivers | Drought over the past 20 years in the Colorado… | Drought over the past 20 years in the Colorado River Basin, and a growing demand for water, have brought Lake Mead to historically low levels. In 1972, the year Landsat 1 captured its first images, Lake Mead’s elevation was 1,155 above sea level. 50 years later, Landsat 9 shows its water level at 1,041, as low as it’s been since Hoover Dam was completed in the 1930s. The lake level reduction is even more extreme than shown by Landsat because of the steep topography. |
Dams, Natural-Disasters, Water | |||||||||||||||||||||||||||||||
| Lake Mead Reaches Historic Low | Image of the Week | drought, lakes, reservoirs, rivers, water use | The surface level of Lake Mead in Nevada and… | The surface level of Lake Mead in Nevada and Arizona has fallen to a historic low as 16 years of ongoing drought in the American Southwest continue to impact the Colorado River Basin. Landsat imagery captures the decline of the country’s largest reservoir. In a May 1984 Landsat 5 acquisition, Lake Mead is almost full. But 32 years later, in May 2016, Landsat 8 data show the reservoir when it was 37 percent full. The drop in lake level isn’t even as apparent as it might otherwise be because of the steep topography in the region, but the surface area reduction is still quite noticeable. Today, Lake Mead supplies water to 25 million people. Virtually all of nearby Las Vegas, NV, with its 2 million residents and 40 million tourists a year, gets its drinking water from the shrinking reservoir. Lake Mead also serves farms, tribes, and businesses in Arizona, California, Nevada, and northern Mexico. According to the U.S. Bureau of Reclamation, Lake Mead reached a historic low in May 2016 of 1,074 feet above sea level. It has not been this low since the reservoir began filling in the 1930s. |
||||||||||||||||||||||||||||||||
| Lake Mead Water Levels | Image of the Week | drought, lakes, reservoirs, rivers, water use | ||||||||||||||||||||||||||||||||||
| Lake Meredith's Return | Image of the Week | drought, lakes | Lake Meredith National Recreation Area takes its… | Lake Meredith National Recreation Area takes its name from the water body it surrounds in the Texas Panhandle. The Amarillo-area lake sees more than a million visitors a year. Visitor numbers were much smaller just a few years ago. More than a decade of drought shrank water levels at Lake Meredith until a rush of rain in 2017 brought a turnaround. These Landsat images highlight the lake’s return. Each image was captured in November and rendered to reflect natural color using bands 4, 3, and 2 of Landsat’s Operational Land Imager. The 2013 image shows the lake as a green spot on an otherwise drab landscape. The northeast tip of the lake runs up against a dam that separates it from the parched Canadian River. By 2018, the lake’s surface area more than doubled in size. Landsat imagery is a useful tool for monitoring and characterizing both natural and manmade change. Landsat imagery is available at no charge through tools like EarthExplorer, LandsatLook and GloVis. |
||||||||||||||||||||||||||||||||
| Lake Meredith’s Return | Image Comparison Sliders | lakes, reservoirs | ||||||||||||||||||||||||||||||||||
| Lake Naivasha, Kenya | Earthshots | floriculture, flowers, greenhouses, hyacinth, lakes, rivers, roses | How do those in northern winter climates get… |
How do those in northern winter climates get roses to their loved ones in February for Valentine’s Day? The answer is to import them from warmer climates. Kenya offers the perfect climate for flowers year-round. Its floriculture industry covers land near a shallow lake near the equator. Lake Naivasha is one of the few freshwater lakes in East Africa. Its depth varies from 2 to 8 meters, and the surface area as shown in the 2023 Landsat image is about 150 square km. Direct rainfall on the lake and three rivers feed freshwater to the lake. The Gilgil and Malewa are perennial rivers, and Karati is a seasonal river. The Malewa contributes up to 90% of the water to the lake. The lake has no surface outlet—it is referred to as an endorheic lake. In most endorheic lakes, salts are left behind when the lake water evaporates. That is, the salts are not washed out through an outlet to another outgoing river. Lake Naivasha, however, maintains its freshwater status because the lake water seeps into the ground, taking the salts with it. The wetland areas around the Lake Naivasha support not only the large flower industry but also fishing, tourism, and geothermal power. Hundreds of millions of dollars’ worth of cut flowers are exported from Kenya to Europe and other countries. As of 2018, Kenya has 38% of the European Union’s market for cut flowers. The region offers steady sunlight and days that vary very little in length. Lake Naivasha is not far from Nairobi, Kenya’s capital and largest city, about 90 km away. So transport is relatively easy. The Nairobi airport has a terminal dedicated to transporting flowers and vegetables. Still, the industry has had challenges. In recent years, workers have been laid off because of lower demand and higher costs. The increase in agriculture has put pressure on the water resources of the area, affecting the water quality of the lake. |
Agriculture, Cities, Water | |||||||||||||||||||||||||||||||
| Lake Oroumeih (Urmia), Iran | Image of the Week | drought, lakes, saltwater, water use | ||||||||||||||||||||||||||||||||||
| Lake Pleasant | Earthshots | canals, freeways, golf courses, lakes, reservoirs, rivers, urban growth, water use | As Phoenix grows, the need for water rises.… |
As Phoenix grows, the need for water rises. The Salt, Verde, and Gila Rivers bring water from Arizona’s mountains, but it’s not enough for millions of people. Groundwater is pumped to the surface, but this withdrawal lowers the water table, so it’s not the best answer. Phoenix looked elsewhere to supplement its water supply and established the Central Arizona Project (CAP). Completed in the early 1990s, this system of canals, pumps, and tunnels brings Colorado River water along 336 miles of canals to Phoenix and Tucson. Part of the CAP is an expansion of the Waddell Dam that forms Lake Pleasant on the Agua Fria River. The New Waddell Dam was completed in 1994, and it increased the size of Lake Pleasant, which is evident in these images. Construction of the new dam can be seen in the 1991 image. Lake Pleasant water is only partly from the Agua Fria River. The lake also receives water from the Colorado River, over 100 miles away. A canal, which can be seen in the 1991 image, pumps water uphill from the canal to the lake in winter. During summer, when electricity and water demand is high, water is released through a hydroelectric power plant. One drawback to this impressive engineering feat is that Arizona must share Colorado River water with Los Angeles and San Diego, California; Las Vegas, Nevada; and the irrigated fields of the Imperial Valley. Recent drought in the western United States has meant less water to go around for these large cities. Meanwhile, urban growth continues to expand north of Phoenix closer to Lake Pleasant. In the 2011 and 2023 images, this growth is evident, including construction of a new freeway (the bright curvy line). Can you find where the new golf courses were built? |
Cities, Deserts, Water | |||||||||||||||||||||||||||||||
| Lake Powell | Image Comparison Sliders | drought, lakes, reservoirs, rivers | ||||||||||||||||||||||||||||||||||
| Lake Powell and the Megadrought | Image of the Week | drought, lakes, reservoirs, rivers | Two decades of drought are contributing to low… | Two decades of drought are contributing to low water levels in reservoirs along the Colorado River, including Lake Powell. Lake Powell’s highest recorded water level was in 1983. In this 1984 Landsat 5 image, the lake’s elevation was 3,702 feet above sea level. Landsat 8 shows the lake near its historic low level. In April 2022, Lake Powell was 3,529 feet above sea level, its lowest level since the lake began filling behind the Glen Canyon Dam in the 1960s. |
Dams, Water | |||||||||||||||||||||||||||||||
| Lake Powell, Utah and Arizona, USA | Earthshots | drought, hydropower, lakes, marinas, reservoirs, rivers, water use | Glen Canyon Dam on the Colorado River was… |
Glen Canyon Dam on the Colorado River was completed in 1963. It created Lake Powell, which ebbs and flows depending on upstream precipitation. Lately, it’s been more ebb. Glen Canyon National Recreation Area encompasses Lake Powell and is visited by more than 2 million people per year. Since 2000, the Colorado River Basin has been in an extended drought. During the period 2000–2018, the inflow of water into Lake Powell was above average in only 4 years. As a result, Lake Powell was at less than half capacity in January 2019—and 28% full in June 2022. Droughts combined with a rising population means water sustainability will only become more of a challenge. In addition, hydropower capacity at Glen Canyon Dam could be reduced. Severe droughts are a regular part of the climate variability in this region; however, droughts are expected to become more severe in the future.
|
Dams, Water | |||||||||||||||||||||||||||||||
| Lake Thompson, South Dakota | Image of the Week | aerial photos, lakes | Many lakes in South Dakota’s Prairie Pothole… | Many lakes in South Dakota’s Prairie Pothole Region are expanding. Lake Thompson in eastern South Dakota is one that has displayed remarkable change in recent decades. An aerial image from 1952 shows it as a wetland, with a small area of open water. Landsat began observing the area with near-infrared imaging in 1972. By the mid-1980s, the low land filled with enough water to become South Dakota’s largest natural lake. There have been some fluctuations in lake levels since then, and some shoreline and shallow areas changed between dryland, marshland, and open water. Wildlife responds to the lake’s changes. Herons and egrets use the shallow water and mudflats on the lake’s fringes. Pelicans, gulls, terns, and ducks thrive in the open water. The dead trees that remained standing were perfect habitat for cormorants, eagles, and herons. Eventually, the dead trees collapsed, and the habitat changed again. Landsat data can be used to map these changes and help managers understand the interaction between lake levels and wildlife populations. |
||||||||||||||||||||||||||||||||
| Lake Thompson, South Dakota, USA | Earthshots | flooding, lakes, prairie potholes, rivers | Many lakes in eastern South Dakota have… |
Many lakes in eastern South Dakota have expanded during the Landsat record that began in 1972. Lake Thompson is one that has displayed remarkable change in recent decades. This part of South Dakota is in what is known as the Prairie Pothole Region (PPR). Numerous depressions in the land were left behind there after the most recent glacial retreat. These depressions are termed potholes and collect rainfall and snowmelt to form wetlands and ponds of varying size. A wet period in the 1980s and several years in the 1990s resulted in dramatic filling of Lake Thompson, located about 50 kilometers west of Brookings, SD, along with other nearby lakes and sloughs. Lake Thompson is now South Dakota’s largest natural lake. |
Agriculture, Water, Wildlife | |||||||||||||||||||||||||||||||
| Lake Turkana, Kenya and Ethiopia | Earthshots | delta, lakes, rivers | Lake Turkana, formerly Lake Rudolf, lies in… |
Lake Turkana, formerly Lake Rudolf, lies in the Rift Valley of East Africa. It is about 250 km long and 15–30 km wide, with an average depth of about 30 m. Lake Turkana is one of the largest desert lakes in the world, and it lies in a closed basin in northwestern Kenya and southwestern Ethiopia. These images show the delta of the Omo River, which provides more than 80% of the water to the lake. The lake has no outlet and lies in an arid area. Ethiopia is constructing a series of dams on the Omo River. The Gibe I and Gibe II dams are completed, and the Gibe III dam began filling its reservoir in 2015. Studies are ongoing to understand the interactions between regulated flows as a result of the dams and rainfall on the water levels of Lake Turkana. Scientists use many years’ worth of data to get a better understanding of the lake’s natural variability and how that variability might be affected by dams, irrigation, and rainfall. |
Dams, Water | |||||||||||||||||||||||||||||||
| Lake Urmia 2000-2013 | Image of the Week | water use | ||||||||||||||||||||||||||||||||||
| Lake Urmia, Iran | Earthshots | irrigation, lakes, rivers, saltwater, water use | Lake Urmia in Iran is another closed basin… |
Lake Urmia in Iran is another closed basin lake that has been shrinking. Continuous declines in water flowing into the lake have caused a general decline in its surface area since 1995. Water only enters Lake Urmia via rainfall and runoff from rivers flowing into it. As a closed basin lake, its water levels fluctuate with changes in rainfall. Once water reaches the lake, it only leaves via evaporation. When the water that flows into the lake is diverted for human uses, those dynamics are prone to big changes. The lake’s southern basin is shallower than its northern basin, so recent images show the water disappearing from the southern basin first. These Landsat images use the shortwave-infrared, near-infrared, and green wavelengths of light. Because water absorbs infrared light, water (dark blue to black) contrasts with the surrounding land areas. As the water becomes shallower, light is reflected off of the lakebed in shades of light blue. Lighter blue and bright areas immediately surrounding the lake are where the receding shoreline has exposed the lake bottom. Data from the USDA Foreign Agricultural Service shows a downward trend since the mid-1990s. However, a fresh pulse of water from rains during fall 2018 and spring 2019, along with seasonal snowmelt, increased lake levels. This increase isn’t only evident in the graph data. The 2019 Landsat image shows a rebound in water levels over 2018. The basin remained mostly filled as recently as 2019. The 2023 image shows that drought returned, bringing water levels down again. |
Agriculture, Deserts, Water, Wetlands | |||||||||||||||||||||||||||||||
| Lambert Glacier | Earth As Art | ice, ice sheet, icefall | The Lambert Glacier in Antarctica is the world's… | The Lambert Glacier in Antarctica is the world's largest glacier. The focal point of this image is an icefall that feeds into the glacier from the vast ice sheet covering the polar plateau. Ice flows like water, albeit much more slowly. Cracks can be seen in this icefall as it bends and twists on its slow-motion descent 1300 feet (400 meters) to the glacier below. |
||||||||||||||||||||||||||||||||
| Land Change | Earthshots | drilling, oil, oil platforms, well pads | Thousands of well pads are scattered across… |
Thousands of well pads are scattered across northwestern North Dakota. This series of images shows an example of a location with several of them. These rectangular shaped areas of land cover 4–7 acres each. The small bright shapes in the images are much smaller than agricultural fields. Cropland is larger blocks of land in varying shades of green or tan. The parcel of land dedicated to oil pumping is cleared for setting up drilling equipment. Once drilling is completed at a location, it can then pump oil. Each pad seen in the images is a well pad with either drilling or pumping in progress. In the entire Williston Basin, 12,990 hectares of land have been converted to well pads. The previous land cover of this area was almost entirely agriculture and prairie. |
Cities, Mining | |||||||||||||||||||||||||||||||
| Land Cover and Land Cover Change with Tom Loveland | Video - Landsat | |||||||||||||||||||||||||||||||||||
| Land Cover Maps | Earthshots | impervious surface, land cover maps, population, urban growth | The images displayed in this section show a… |
The images displayed in this section show a different way of looking at change over time. These images are part of the National Land Cover Database (NLCD), generated and distributed by the USGS EROS Center and a group of federal agencies called the Multi-Resolution Land Characteristics (MRLC) Consortium. NLCD portrays land cover change spatially as a comprehensive “wall-to-wall” 30-meter resolution database. Its national coverage supports many different applications: fire, urban development, insect damage, mining, best practices in land management, and more. NLCD is based on multiple dates of Landsat imagery captured across the growing season, which is combined with other ancillary data in models to finalize the products. The available editions of NLCD are from 2001, 2006, 2011, and 2016. The legend below shows which colors correspond to the different types of land cover. For example, red indicates impervious surface. This means developed, or built-up, land. Pink is less intensively developed urban areas, and darker red is more intensively developed. Urban land shows the most obvious change seen in these NLCD maps of Las Vegas. The dominant land cover surrounding Las Vegas is “shrub/scrub,” which is shown as tan. These areas are dominated by shrubs less than 5 meters tall.
|
Cities, Deserts, Water | |||||||||||||||||||||||||||||||
| Land Leveling | Earthshots | land leveling, urban growth | Shiyan, China, was a small village in the… |
Shiyan, China, was a small village in the mountains until the 1960s. That’s when a lot of industrial production was established there in its relatively safe mountainous regions. However, because of the mountainous terrain, Shiyan did not have enough land to offer for expansion. So the industry moved away in 2003. To prevent that from happening again, the city began planning to create new land for development in 2007. Shiyan is now a famous production base for automobiles. Dongfeng Motor is headquartered in Shiyan. Other major industries in Shiyan include pharmaceuticals, textiles, and chemicals. Shiyan is also one of the central tourist centers in the northwest of Hubei Province. To create this new land for building, they are leveling mountaintops and filling in valleys. Explosives level the hills, and fleets of trucks haul away the soil. This rock and soil is then used to fill in the valleys. This additional land that can be developed can ease pressure on land that is valuable for agriculture elsewhere. It creates land for cities to expand where they could not do so previously. Most of the new land is for warehouses and industry. A small amount is for housing. The bright spots in the images show the leveled and cleared land. These areas are then quickly replaced by industrial centers. |
Cities | |||||||||||||||||||||||||||||||
| Land of Terror | Earth As Art | erosion, sand dunes | No water. No vegetation. No oases. Known as the "… | No water. No vegetation. No oases. Known as the "Land of Terror," the Tanezrouft Basin in Algeria is one of the most desolate parts of the Sahara Desert. Sand dunes, which appear in yellow, streak down the left side of the image, and sandstone formations carved by relentless wind erosion make concentric loops, much like the grain seen in a piece of wood. |
||||||||||||||||||||||||||||||||
| Land Reclamation Along Florida's Coast | Image of the Week | aerial photos, islands, land conversion, urban growth | ||||||||||||||||||||||||||||||||||
| Landsat 7 World Mosaic 12/31/2000 | Image of the Week | |||||||||||||||||||||||||||||||||||
| Landsat 7 World Mosaic 12/31/2002 | Image of the Week | Landsat mosaics, mosaics | ||||||||||||||||||||||||||||||||||
| Landsat 8 Completes 5 Years of Operation | Video - Landsat | |||||||||||||||||||||||||||||||||||
| Landsat 8 Imagery Reveals Heavy Flooding in Sri Lanka | Image of the Week | flooding, landslides, near-infrared, rain, shortwave infrared, weather | On May 18, 2016, a Landsat 8 acquisition of flood… | On May 18, 2016, a Landsat 8 acquisition of flood-ravaged Sri Lanka produced impressive imagery of swollen waterways. A pattern of torrential rain that began May 15 in the island country just off the southern tip of India has caused massive landslides and flooding, the latter of which is evident when compared to a March 31, 2016, satellite image. Both of the images resulted from data acquired by the shortwave, near-infrared, and red bands (6,5,4) on Landsat 8’s Operational Land Imager. Officials in Sri Lanka’s national Disaster Management Center say the heaviest rains in a quarter century forced 200,000 people out of the low-lying parts of the country’s capital in Colombo, sent 400,000 fleeing to state-run relief camps, and covered entire villages in walls of mud. A history of clearing forests for agricultural use in Sri Lanka is a potential contributor to the destruction caused by the heavy rains and ensuing flooding. The International Charter on Space and Major Disasters, of which USGS and EROS are members, was activated May 17 to provide Sri Lanka’s government rapid access to Landsat and other satellite data for assessing the extent of damage and helping with disaster response. Future Landsat acquisitions will be part of this response. |
||||||||||||||||||||||||||||||||
| Landsat 8 Scenes Top 1 Million | Image of the Week | How many pictures have you taken with your… | How many pictures have you taken with your smartphone? Too many to count? However many it is, Landsat 8 probably has you beat. Landsat 8 acquires images at a rate of about 750 per day, and just a little over 4 years after launch in February 2013, the Earth-observing satellite on May 31, 2017, acquired its 1 millionth scene! Landsat 8 provides the highest quality data since the Landsat archive was established in July 1972 with the launch of Landsat 1. Landsat data support a vast range of applications in areas such as global change research, agriculture, forestry, geology, land cover mapping, resource management, water, and coastal studies. This Landsat 8 scene is located northwest of the Sea of Okhotsk, Russia, and was acquired on May 31, 2017. It is one of the first almost cloud-free acquisitions after the one millionth scene was made available for download. All Landsat data are distributed at no charge from EarthExplorer, GloVis NEXT, and the LandsatLook Viewer. Follow the Landsat Program on Twitter @USGSLandsat or Facebook @NASA.Landsat. |
|||||||||||||||||||||||||||||||||
| Landsat 8 Shows Burn Extent, Active Fire at Fort McMurray | Image of the Week | burn scars, burn severity, near-infrared, shortwave infrared | Eleven days after a wildfire first sparked south… | Eleven days after a wildfire first sparked south of Fort McMurray in northern Alberta, Landsat 8’s Operational Land Imager (OLI) captured imagery of one of the most destructive infernos in Canadian history. The fire has burned an area approaching 600,000 acres. The May 12, 2016, false-color image relies on shortwave infrared, near infrared, and red light (OLI bands 7-5-4) to show hazy blue smoke, bright orange active burning spots, and a reddish-brown burn scar that surrounds Fort McMurray as it extends east and south toward the Saskatchewan border. It is a stark contrast from the pre-fire image acquired by Landsat 8 on October 17, 2015. Alberta officials report that nearly 10 percent of Fort McMurray was destroyed by the fire, which started May 1 south of the city. Hot weather, dry vegetation, and strong winds spread the fire quickly. The cause has yet to be determined. So far, over 2,400 structures have been destroyed in and around Fort McMurray. At least another 500 were damaged in the city, and many of the structures still standing suffered smoke damage. Staff from the U.S. Geological Survey are assisting the Provincial Operations Centre in Edmonton, Alberta, Canada, by providing Landsat imagery that shows the fire’s progress, and post-fire burn severity assessments that are expected to provide information of value during post-fire mitigation activities. |
||||||||||||||||||||||||||||||||
| Landsat 8 Swath Animation | Video - Landsat | |||||||||||||||||||||||||||||||||||
| Landsat 9 First Images | Image of the Week | algal blooms, lakes | Landsat 9 launched into space on September 27th,… | Landsat 9 launched into space on September 27th, 2021. The "first light" images arrived on October 31st. On that day the satellite captured: algal blooms in Lake Erie, the glaciers of the Himalayas, bush fires in Australia's Eucalypt Woodlands, coastal communities on the Florida panhandle, and deserts, mountains and mesas across the Navajo Nation. Imagery from Landsat 9 will maintain and extend the Landsat program's nearly 50 year record of Earth surface change. The new data stream will be available to the public in early 2022.
|
||||||||||||||||||||||||||||||||
| Landsat and Our Tilted Planet | Image of the Week | clouds, equinox, seasons, solstice | We wouldn't have seasons here on Earth if not for… | We wouldn't have seasons here on Earth if not for the planet's 23.5 degree axial tilt. Axial tilt is also known as obliquity. Earth's obliquity and its relationship with the sun give us two solstice points and two equinox points. As we orbit through each solstice and equinox, the amount and angle of daylight change. A 12-month sequence of Landsat imagery shows how much each month can differ, especially away from the equator. In extreme northern latitudes, sunlight during the winter solstice is so limited that daytime Landsat imagery is not available, while Antarctica receives long hours of daylight in the extreme southern latitudes. This multi-path swath of Landsat imagery in the Western Hemisphere shows the big picture. It contains only cloudy Landsat images, which are brighter and help show the change from north to south as the seasonal angle of the sun changes. |
Water | |||||||||||||||||||||||||||||||
| Landsat Archive Hits Nine Million Scenes | Image of the Week | soybeans | The Landsat Archive is the world’s longest… | The Landsat Archive is the world’s longest continuously-collected record of the Earth’s surface. In mid-September, it notched another milestone by adding its nine millionth scene. This particular image from north-central Paraguay helps tell the kind of story that only a long historical record like Landsat can. The rectangular tracks of brown and tan that dapple the landscape between the states of Boquerón and Upper Paraguay signal deforestation. Land is cleared through controlled burns to make way for crops like soybeans, or to make room for livestock. The nine millionth scene even shows an active fire. One Landsat-based study found that some 44,000 square kilometers of forest were lost between 1987 and 2012. This animation shows the dramatic decline in forested land. The Landsat Archive continues to grow. This animation shows the growth in Landsat scene coverage since the launch of the first orbiter in 1972. The launch of Landsat 9 in 2021 will maintain the continuity of this one-of-a-kind scientific resource.
|
||||||||||||||||||||||||||||||||
| Landsat Chronicles Deforestation in Colombia | Image of the Week | land conversion, logging | Deforestation has long been a fact of life in the… | Deforestation has long been a fact of life in the Amazon, Andean, and Caribbean regions of Colombia, South America, something that Landsat satellite data have thoroughly chronicled through the years. |
||||||||||||||||||||||||||||||||
| Landsat Collections: Introduction | Video - Landsat | |||||||||||||||||||||||||||||||||||
| Landsat Collections: RMSE | Video - Landsat | |||||||||||||||||||||||||||||||||||
| Landsat Collections: Tiers | Video - Landsat | |||||||||||||||||||||||||||||||||||
| Landsat Confirms Spatial Extent of Wind Tower Sediment Plumes | Image of the Week | sediment, wind towers, wind turbines | Earth observation satellites help researchers… | Earth observation satellites help researchers confirm the presence of large plumes containing suspended sediments extending from hundreds of wind towers in the coastal waters of the North Sea southeast of England. |
||||||||||||||||||||||||||||||||
| Landsat Data Illustrate Ancient Sites | Image of the Week | archaeology | ||||||||||||||||||||||||||||||||||
| Landsat Data in the Cloud | Video - Find Data | |||||||||||||||||||||||||||||||||||
| Landsat Data Offers Relief to West African Farmers | Video - EROS | |||||||||||||||||||||||||||||||||||
| Landsat Detects Eruptions at Ethiopian Volcano | Image of the Week | craters, fissures, lava, lava lakes, shortwave infarred, volcanoes | Landsat 8’s shortwave infrared (SWIR) band is… | Landsat 8’s shortwave infrared (SWIR) band is useful in viewing recent eruptions at Erta Ale volcano in northern Ethiopia near the Eritrea border. The volcano’s name means “smoking mountain,” and its southernmost vent is referred to as “the gateway to hell.” Both names acknowledge its long-term volcanic activity since the early 1900s, and the persistent filling and draining of lava lakes within its main crater rim. The lava lakes have been filled most recently since the 1960s. Like other shield volcanoes, Erta Ale has gentle slopes and a wide base of about 25 miles in diameter. Shield volcanoes do not erupt explosively. Instead, the basaltic lava is very fluid and erupts like fountains in the lava lakes and along fissures, flowing like streams down the sides. Darker streaks in these recently acquired Landsat images are some of the previously erupted, cooled, and solidified lava flows. The elliptical summit crater contains several smaller pit craters, and the current lava lake is in one of these. The red spot in the January 10 image is a SWIR signal associated with the location of the most recent lava lake. The February 11 image, however, shows out-gassing of that lava lake and other hot spots on the southeastern slope of the volcano. According to the Global Volcanism Program, new fissures opened on January 21. Landsat’s SWIR signal infers increased temperatures where new lava is either at very shallow depths below the surface or gurgling to the surface. |
||||||||||||||||||||||||||||||||
| Landsat Helps Battle Pine Beetle Hordes | Image of the Week | insect infestation | At the size of a grain of rice, the mountain pine… | At the size of a grain of rice, the mountain pine beetle’s subtle assault on America’s forests isn’t always obvious to the naked eye. Yet over time, their armies of thousands can ravage entire mountainsides. That’s why the continuous monitoring abilities of Landsat satellites have become so important in fighting the insect hordes. The U.S. Geological Survey’s (USGS) decision in 2008 to make what is now 44 years of archived satellite data free for distribution gave rise to time-series imagery that has become a powerful tool in revealing forest change. Landsat’s no-cost access gives forest managers an important and economical asset in discerning where outbreaks are happening as they occur. That knowledge in turn enables them to make more informed decisions on thinning tree stands affected by beetles, thus minimizing the potential fire threat they pose. The value of continuous monitoring is readily apparent in these images. In August 1992, Landsat 5 focused on a swath of the Uinta Mountains just east of Salt Lake City, Utah. The shades of dark green indicate areas of healthier undisturbed forest. Almost exactly 18 years later, Landsat 5 found something much different—dark red stains readily visible throughout the image that tell a story of widespread pine beetle destruction. Because they only measure field plots once a decade, Forest Service crews may have a harder time grasping the enormity of the assault. With Landsat’s continuous monitoring, the size and timing of infestations become much clearer. |
||||||||||||||||||||||||||||||||
| Landsat Image Mosaic of Antarctica (LIMA) | Image of the Week | ice sheets, sea level rise | ||||||||||||||||||||||||||||||||||
| Landsat Imagery Tracks Record Flooding in Minot, N.D. | Image of the Week | flooding, rain, rivers, weather | ||||||||||||||||||||||||||||||||||
| Landsat Monitors 1,800-Year-Old Redwoods | Image of the Week | logging, national parks, redwoods | Redwood National and State Parks in northern… | Redwood National and State Parks in northern California are the embodiment of America’s ongoing challenge to balance the country’s economic interests against preserving its natural wilderness, protecting some forested lands while allowing for resource extraction elsewhere. When gold was discovered in 1849, hundreds of thousands of people poured into California, and redwoods were logged extensively to meet the demand for lumber and other resources. Today only 4 percent of the old-growth forest and its 1,800-year-old trees remain, primarily along the coast. To stem that ongoing loss, Interior Secretary Stewart Udall successfully pushed to establish Redwood National Park in October 1968. These Landsat images show logging’s influence around the dark green protected forests. Many of the small pink spots in the lower left corner and across the right side of the 1984 scene are logging sites revealed through Landsat 5’s Thematic Mapper sensor. In the 2016 Landsat 8 image, logging seems to have lessened overall, particularly as areas on the right side of the scene experience regrowth. Today the majestic trees in Redwood Parks—some soaring as high as 30-story skyscrapers—are under the protection of the National Park Service (NPS), which celebrated its centennial in August 2016. The NPS’s mandate is to help preserve the future of the trees. Landsat’s continuous monitoring will help ensure it. |
||||||||||||||||||||||||||||||||
| Landsat Monitors Gypsy Moth Damage | Image of the Week | insect infestation | Massive defoliation caused by a severe outbreak… | Massive defoliation caused by a severe outbreak of the European gypsy moth caterpillar during the spring and summer of 2016 across southern New England and the Mid-Atlantic was easily captured by the Landsat 8 Operational Land Imager sensor from 438 miles in space. |
||||||||||||||||||||||||||||||||
| Landsat Monitors Mining at Center of North America, Near Town of Center | Image of the Week | coal | Landsat satellites help verify a central tenet of… | Landsat satellites help verify a central tenet of industrial growth across the planet—the changing use of land to increase its economic output—and Center, North Dakota, is no exception. In January 2017, a geographer at the University of Buffalo in New York calculated that the town of Center is the geographic center of North America. The connection between the town’s name and its location is coincidental; Center was named for its central position in North Dakota’s Oliver County. What Landsat sensors confirm is another name the area goes by—Coal Country. Mining has been part of Center’s history for more than a century. In August 1984, the Landsat 5 image shows significant surface mining of lignite coal just to the southeast of town, during a summer when drought had browned the countryside. Thirty-two years later, the mining activity moved to the southwest of Center. An additional mining operation also began near the Milton R. Young Power Plant just southwest of Nelson Lake. At the power plant, lignite is used to heat water and create steam to drive electricity-producing turbines. The North Dakota Geological Survey estimates that western North Dakota contains about 1.3 trillion tons of lignite, and that 25 billion tons are recoverable—enough to last more than 800 years at the current production rate of 30 million tons per year. Once surface mines like those near Center end operations, coal mining companies are required by North Dakota law to reclaim the land, a requirement that Landsat and other science satellites can help verify in the decades to come. |
||||||||||||||||||||||||||||||||
| Landsat Mosaic of the Galapagos | Image of the Week | islands, lava flows, volcanoes | The Galapagos Islands, isolated in the eastern… | The Galapagos Islands, isolated in the eastern Pacific Ocean, lie about 1,000 km off the coast of Ecuador. This Landsat 8 mosaic combines four images from March of 2015. The islands were formed by volcanoes, some of them still active. Volcanic craters and lava flows dominate the islands along with dense green vegetation. The Galapagos became a place of scientific significance when Charles Darwin visited 183 years ago this September and October. Darwin himself landed on and explored four of the islands. His exploration of the islands and careful observations led to a revolution in scientific theory about the origin of living beings. Darwin didn’t have satellite imagery, but Landsat continues the scientific tradition of collecting valuable data about the Earth. |
||||||||||||||||||||||||||||||||
| Landsat Played Role in Confirming 1986 Chernobyl Disaster | Image of the Week | infrared, lakes | When the Chernobyl Nuclear Power Plant exploded… | When the Chernobyl Nuclear Power Plant exploded 30 years ago, on April 26, 1986, Landsat 5 was the first civilian satellite to confirm the disaster near Pripyat, Ukraine, in the agricultural heartland of the Soviet Union. |
||||||||||||||||||||||||||||||||
| Landsat Records Aftermath of Historic World Trade Center Attack | Image of the Week | 9/11, smoke | Landsat’s role in monitoring land use and land… | Landsat’s role in monitoring land use and land cover changes on Earth gives it a spectacular view of the planet’s most historic events. Such was the case with the September 11, 2001, attacks on New York City’s World Trade Center. |
||||||||||||||||||||||||||||||||
| Landsat Reveals Industrial Growth in Powder River Basin | Image of the Week | coal, land conversion, open pits | The expanding coal fields in Wyoming’s Powder… | The expanding coal fields in Wyoming’s Powder River Basin serve as prime examples of Landsat’s ability to monitor land cover change related to industrial growth across the American landscape. In imagery acquired more than three decades apart, Landsat time-series data illustrate what USGS scientists call a central reality of industrial growth in this country—changing the use of land to increase its economic output. Agriculture remained the main occupation in the basin into the 1970s, until the coal boom took off. The largest U.S. coal mine, the North Antelope Rochelle Mine south of Gillette, WY, opened late in 1983. The influence of mining is readily apparent in these Landsat images. In 1984, the Landsat 5 scene is largely devoid of open-pit mining signatures. But 32 years later, in 2016, Landsat 8 captures how the Black Thunder Mine and the North Antelope Rochelle Complex have expanded over the last few decades. In 2014, the two mines produced 22 percent of the nation’s coal supply. USGS officials estimate that mines in the Powder River Basin generally have less than 20 years of economically recoverable coal remaining. Once they end operations, coal mining companies are required by law to reclaim the land, a requirement that Landsat can help verify in the decades to come. |
||||||||||||||||||||||||||||||||
| Landsat Reveals Post-Fire Problems | Image of the Week | burn scars, burn severity, near-infrared, shortwave infrared | Sometimes the destructive nature of wildland… | Sometimes the destructive nature of wildland fires lies beyond the flames. It reveals itself in what is left behind—scorched mountainsides with no trees to stop rain-driven mudslides or dangerous debris flows. When such potential exists, the Shortwave Infrared (SWIR) bands on the sensors aboard the Landsat satellites help to identify those possibilities quickly. The SWIR bands measure diminished moisture content in soil and vegetation. When SWIR band 7 is paired with Landsat’s Near-Infrared (NIR) band 5, which is highly sensitive to growing vegetation, the two produce vivid, accurate images of burn scars. That information is useful to post-fire responders who must act quickly to stabilize burn areas and address potential risks to people, property, and communities nearby. Landsat 8 helped map destruction caused by the Cougar Creek fire 75 miles northeast of Portland, Oregon, in mid-August 2015. At left is a pre-fire image of Mount Adams in Washington. Snow appears cyan on its peak. In the middle is a post-fire image where the previous green vegetation south and east of the mountain is now charred and appears in shades of red. The burn severity map at right was produced with Landsat’s infrared imaging, including a SWIR band that is found on few other satellites. Within the fire perimeter, dark green is non-burned, light blue is low burn severity, yellow is moderate severity, and red is high. |
||||||||||||||||||||||||||||||||
| Landsat Reveals Scar of ‘Good Burn’ at Guadalupe Mountains | Image of the Week | burn scars, fire scars, national parks, near-infrared, shortwave infrared | Wildfires in wilderness areas like Guadalupe… | Wildfires in wilderness areas like Guadalupe Mountains National Park in west Texas are always a danger, but they can produce what land managers call a “good burn,” too. The Coyote Fire that scorched parts of Guadalupe Mountains from May 7, 2016, until June 17 is a prime example of that. In this 100th anniversary year of the National Park Service, new grass growing on charred ground at Guadalupe Mountains National Park is an important reminder that sometimes fire can be a good thing. |
||||||||||||||||||||||||||||||||
| Landsat Reveals Water Use Dynamics in the San Joaquin Valley | Image of the Week | evapotranspiration, irrigation, water use | California’s San Joaquin Valley is one of the… | California’s San Joaquin Valley is one of the world’s most productive agricultural regions. Much of that productivity depends on the availability of water for irrigation. Recent prolonged droughts in California have underscored the importance of accurately monitoring changes and trends in water use in order to make well-informed water management decisions. Scientists with the USGS Earth Resources Observation and Science (EROS) Center used Landsat images to quantify water use in the San Joaquin Valley over a 30-year period. A first step was to determine evapotranspiration (ET), which is water transpired by plants into the atmosphere as well as water that evaporates from the surrounding soil. ET can be used as a measure of water usage across a landscape. The scientists employed a computer model that incorporates Landsat imagery, including the Landsat 8 thermal band, along with climate data to estimate ET for every Landsat scene of the Valley from 1984 to 2014. The team then integrated the ET results with precipitation and runoff data to create maps that reveal historical trends in water use and availability on irrigated basins in the Valley over the 30-year time period. Detailed enough to show individual fields, the maps depict water use (in millimeters) for a given day or an entire growing season, and, when combined with crop data, can also reveal which crops are using the most, or least, water. The two maps above show seasonal water use in the San Joaquin Valley in 1990 (left) and 2014 (right). Color coding indicates how irrigation patterns changed over time. Notice, for example, that water use intensified in many places (increase in blue areas) and some irrigated lands (green in 1990) transitioned out of agricultural production (reddish brown) by 2014. Landsat data are free and easily accessible at http://earthexplorer.usgs.gov/. This research approach can be replicated to produce similar water use maps for other locations across the United States. These maps can help farmers, water management agencies, and rural development planners balance irrigation practices and crop choices with precious water resources. |
||||||||||||||||||||||||||||||||
| Landsat Shows Spread of Soberanes Fire | Image of the Week | burn scars, near-infrared, shortwave infrared, smoke | A wildfire near Soberanes Creek along the Pacific… | A wildfire near Soberanes Creek along the Pacific coast of California started July 22, 2016, and spread to over 86,000 acres one month later. California Department of Forest and Fire Protection officials say the blaze began after an illegal campfire was abandoned. By mid-August, it had destroyed 57 homes and was threatening 410 more structures in an area hugging the coast northwest of Big Sur. Landsat images from July 13, July 29, and August 14 show the dramatic progression as active fire burns orange in the latter two scenes, and smoke appears as a blue haze. Landsat 8’s Operational Land Imager sensor using shortwave infrared, near infrared, and red spectral bands reveals the growing red burn scar from a fire that was only 60 percent contained by mid-August. The Soberanes Fire is one of the largest blazes in California’s 2016 fire season, with more than 4,100 firefighters battling it at various times. |
||||||||||||||||||||||||||||||||
| Landsat Views Massive Solar Energy Farms | Image of the Week | heliostats, land conversion, solar, solar panels | Solar energy is booming worldwide, and these… | Solar energy is booming worldwide, and these Landsat 8 images show three large solar energy farms. The scale of the images is the same for size comparison. The first image shows an area on the California-Nevada border in the United States, and displays two different approaches to solar energy. To the west of Ivanpah Dry Lake (the bright swath down the middle of the image) is the Ivanpah Solar Electric Generating System. Over 170,000 mirrors, called heliostats, each the size of garage doors, rotate to follow the sun. They reflect sunlight to three 460-foot-tall towers. The sunlight heats water in the towers to make steam, which drives turbines to generate electricity. The darker shapes to the northeast represent a different solar energy method. This project uses 3.4 million thin-film photovoltaic solar panels that track the sun from east to west each day. No water is needed as the panels generate electricity directly from sunlight. The second image shows a new solar power plant in Morocco. The first phase of the Noor Ouarzazate Solar Complex, seen in the southern section in the image, uses curved mirrors to focus the sun’s energy to heat synthetic oil inside pipelines. Excess heat is stored in molten salt that continues to generate electricity even after sundown. The northern section is a later phase that will use a central tower as at Ivanpah. The third image shows the world’s largest solar power plant in China, the world’s leading producer of solar power. The Longyangxia Dam Solar Park covers 10 square miles and comprises 4 million photovoltaic solar panels. China’s solar power sector continues to grow as an even larger solar park is planned for the Ningxia region in northern China. These images support Landsat’s mission of monitoring industrial growth and contributing to studies on how solar projects affect land use. |
||||||||||||||||||||||||||||||||
| Landsat Views of Africa's Largest Hydro Dam | Image of the Week | Africa, dam, EROS, Ethiopia, GERD, Image of the Week, Landsat, Nile, reservoir | The Grand Ethiopian Renaissance Dam is set to… | The Grand Ethiopian Renaissance Dam is set to become the largest hydroelectric power plant in Africa. Located near the Sudan border in Ethiopia, the promising and controversial project impacts communities up and down the Blue Nile. Landsat sensors capture the region in false color infrared, emphasizing the reservoir’s boundary. In 2023, the fourth and final phase of reservoir filling was completed, with its water level settling 125 meters above the Blue Nile's original elevation. Landsat captured imagery in 2022 after the phase 3 fill, as well as phase 2 in 2021, and phase 1 in 2020. Landsat imagery from 2019 shows the area before the official filling process had begun. The final elevation of the reservoir has created approximately 70 islands, with strong tourism potential according to local officials. |
Dams, Energy, Water | |||||||||||||||||||||||||||||||
| Landsat, ASTER Work Together on Russian Wildfires | Image of the Week | burn scars, near-infrared, smoke | Remotely sensed imagery of wildfires burning in… | Remotely sensed imagery of wildfires burning in the Siberia region of Russia shows the complementary possibilities of Landsat 8 and NASA’s ASTER sensor aboard its Terra satellite. Lightning triggered dozens of forest fires in remote Siberia in late June 2016, burning as much as 7,400 acres, according to Russia’s TASS news agency. Imagery acquired from Terra ASTER on June 29 shows smoke billowing from a small and a large fire, as well as some older burn scars. A day later, when Landsat 8 passed overhead, there was almost no smoke coming from the smaller fire, and a more pronounced scar. Vegetation appears red in the false-color imagery because near infrared (NIR) spectral bands used by both sensors are sensitive to vegetation greenness and were placed in the red position of Red-Green-Blue (RGB) composite images. Burn scars appear a dark brown to black with this band combination. Though the Terra satellite images the entire Earth every 1 to 2 days, its ASTER instrument with its three separate telescopes only collects data when it is remotely programmed to do so over requested areas of land. That makes it valuable for monitoring disasters. Because Terra’s orbit is similar to that of Landsats 7 and 8—though timed differently—they prove quite complementary when it comes to identifying the impacts of wildfire, flooding, and other events. Though there is little population in the wildfire area, Russia’s Roscosmos State Corporation for Space Activities asked the International Charter “Space and Major Disasters,” of which USGS and EROS are members, for assistance. That request was granted July 2, giving Russia rapid access to satellite data for assessing the extent of damage and helping with disaster response. |
||||||||||||||||||||||||||||||||
| Landsat: 50 Years Observing a Changing Earth | StoryMaps | |||||||||||||||||||||||||||||||||||
| Landsat's 10 Millionth Scene | Image of the Week | evaporation, irrigation, river, saltwater, sea | Landsat 7 had the honor of acquiring the… | Landsat 7 had the honor of acquiring the satellite program's 10 millionth scene in November 2021. The scene captures changes to the Dead Sea, located in Southwest Asia. The Dead Sea is mainly fed by the Jordan River, which enters from the north. However, the water level of the Dead Sea has been falling due to irrigation projects and water use upstream. The Dead Sea has no outlet, so the only way water exits is by evaporation. When the water evaporates, it leaves behind dissolved minerals, making the water even saltier. This series of images of the Dead Sea reveals one of Landsat's biggest strengths--its nearly 50-year record of continuous data. Landsats 8 and 9 together will acquire around 1,500 satellite scenes per day, a pace higher than at any other time in Landsat's history. Read more about the Dead Sea on the USGS Earthshots website. All 10 million+ Landsat scenes are available for free download at the USGS EarthExplorer site. |
||||||||||||||||||||||||||||||||
| Landsat's Calibration and Validation | Video - Landsat | |||||||||||||||||||||||||||||||||||
| Landsat's View of a Siberian Wildfire | Image Comparison Sliders | burn scars, infrared | ||||||||||||||||||||||||||||||||||
| Landsat’s Accuracy | Earthshots | calibration | The Sharq El Owainat airport is visible on the… |
The Sharq El Owainat airport is visible on the right side of these images. The runway appears in the 1997 image. Landsat’s accuracy is key to other systems as well. Satellite sensors launched by other countries, cubesats launched by private companies, and sensors on NASA Earth-observing satellites benefit from the accurate Landsat calibration. Calibration work may seem esoteric, but it makes the science application work possible. The work that solves problems couldn’t be done without the accuracy of the data. Landsat images are simply pretty pictures—until we calibrate them; then they become accurate datasets. |
Agriculture, Deserts | |||||||||||||||||||||||||||||||
| Landsat’s Return Beam Vidicon | Earthshots | film, ice, resolution, sensors, snow | A sensor on the early Landsats had a name… |
A sensor on the early Landsats had a name worthy of some Star Trek gadget. Originally Landsat’s primary sensor, the Return Beam Vidicon (RBV) flew on the first three Landsats. A sample RBV image shows the northwestern coast of Madagascar. The black-and-white image from 1981 has higher resolution than the Multispectral Scanner (MSS) on board the early Landsats. So what happened to these RBV images, and are they useful today?
What’s a Vidicon? A vidicon is a television camera tube that formed an image by focusing light onto a photoconductive faceplate. An electron beam scanned the faceplate, detecting light intensity for each scan line. The beam then bounced back by an electrically charged area. The resulting picture was made up of about 5,000 separate scan lines (compared to 525 for a traditional television picture). |
Glaciers, Mountains | |||||||||||||||||||||||||||||||
| Landsat’s View of the Boston Marathon | Image of the Week | suburbs, urban areas | The 122nd Boston Marathon, the oldest annual… | The 122nd Boston Marathon, the oldest annual marathon in the world, takes place on April 16, 2018. This Landsat 8 image shows the April landscape of eastern Massachusetts, before vegetation has greened up. The yellow line indicates the point-to-point route that the marathon follows. The large urban area of Boston is on the right. Bright spots are other neighborhoods, towns, and cities. About 30,000 runners will begin the 26.2-mile race in Hopkinton, Massachusetts. The route takes them eastward through eight towns and cities, through suburban Boston, and finally to downtown Boston and the finish line near Old South Church on Boylston Street. |
||||||||||||||||||||||||||||||||
| LandsatLook 2.0 | Video - Find Data | |||||||||||||||||||||||||||||||||||
| Landscape change in Argentina | Image of the Week | irrigation, water use, weather | These Landsat images show portions of the Cordoba… | These Landsat images show portions of the Cordoba and San Luis provinces in central Argentina. The urban area to the right of image center is Villa Dolores. To the north and east of the urban area, the Embalse Allende (“Vineyard Dam”) can be seen in the two images. |
||||||||||||||||||||||||||||||||
| Landscapes of West Africa with Gray Tappan | Video - EROS | |||||||||||||||||||||||||||||||||||
| Landslide near Oso, Washington | Image of the Week | flooding, landslides, rain, rivers, weather | On March 22, 2014, a massive landslide occurred… | On March 22, 2014, a massive landslide occurred in the Cascade Mountains near Oso, Washington. Triggered by heavy rains, the slide covered the North Fork of the Stillaguamish River and destroyed numerous homes. After a week of intensive search and rescue efforts, at least 20 deaths had been reported and many others were still reported missing. The muddy debris also created a dam that blocked the river, causing concerns for flooding and flash flooding as the water filled behind and moved around the dam. These images were acquired by Landsat 8 on January 18, 2014, and again on March 23, 2014. Along with the landslide, the barrier lake caused by the blocked river channel can also be seen in the later image. Landsat imagery will be useful (along with other datasets) as the efforts to recover, reclaim, and restore this area are implemented. |
||||||||||||||||||||||||||||||||
| Landslide Spreads 6 Miles Across Glacier Bay National Park | Image of the Week | landslides, national parks | On June 28, 2016, a 4,000-foot-high mountainside… | On June 28, 2016, a 4,000-foot-high mountainside in Glacier Bay National Park and Preserve collapsed, sending rocky debris equivalent to 60 million mid-size SUVs tumbling onto nearby Lamplugh Glacier. |
||||||||||||||||||||||||||||||||
| Large Wildfire Consumes Boreal Forest in Eastern Russia | Image of the Week | boreal forest, shortwave infrared, tundra | A massive wildfire on the Kamchatka Peninsula in… | A massive wildfire on the Kamchatka Peninsula in far eastern Russia has consumed nearly 600,000 acres of boreal forest and tundra since late May 2016. Shortwave infrared bands on Landsat 7 used in combination with the visible red band revealed a large, brown burn scar on June 10, 2016, compared to 11 months earlier—on July 18, 2015—when Landsat 8 captured an image showing healthy, growing forest vegetation. Fires appear orange in the 2016 image, and smoke from the fires is light blue. The Siberian Times reported that smoke from the Russian wildfire was “producing exceptional sunsets” in the western United States and Canada. The newspaper attributed the Kamchatka fire and others this spring in eastern Russia in part to an unusually warm and dry winter, and faster than normal snowmelt. The Kamchatka Peninsula occupies an area of roughly 100,000 square miles, with the Pacific Ocean to the east of the peninsula and the Sea of Okhotsk to the west. Most of the fire has been on the western side of the peninsula, north of the Kharyryuzova River. |
||||||||||||||||||||||||||||||||
| Las Conchas, New Mexico Fires | Image of the Week | burn scars | ||||||||||||||||||||||||||||||||||
| Las Vegas, Nevada, USA | Earthshots | airport, construction, golf courses, highways, impervious surface, lakes, land cover maps, population, rivers, suburb, urban growth, water use | Las Vegas, Nevada, is one of the fastest… |
Las Vegas, Nevada, is one of the fastest growing metropolitan areas in the United States. Las Vegas grew from a population of 1,375,765 in 2000 to 1,951,269 in 2010, a 41.8% increase, third highest in the country for that decade. These images show the rapid growth of the city. The tip of Lake Mead is visible east of the city (dark area), where Hoover Dam impounds the Colorado River. We have created an animation to make it easier to visualize the progression of the changes in Las Vegas. Click the subsection “Change Animation” to view that short video. Population growth of the Las Vegas Metropolitan Area
|
Cities, Deserts, Water | |||||||||||||||||||||||||||||||
| Launch! Landsat Data Continuity Mission | Image of the Week | |||||||||||||||||||||||||||||||||||
| Lava Field | Earth As Art | lava, volcanoes | The Haruj Volcanic Field in central Libya was… | The Haruj Volcanic Field in central Libya was created from basaltic lava flows that erupted over time from multiple volcanoes. The volcanic craters and lava flows are evidence of a previous active eruption period. Many of the bright spots within the darker colored basalt flows are depressions covered with silt and fine sand. The lava field measures about 185 kilometers (115 miles) across. |
||||||||||||||||||||||||||||||||
| Lava Flows on the Galapagos | Image of the Week | islands, lava, volcano | The tallest volcano on the Galapagos Islands… | The tallest volcano on the Galapagos Islands began erupting on January 6. The eruption sent lava flows down the mountainside and ash skyward. Like the Hawaiian Islands, the Galapagos are volcanic islands formed over an active hotspot. Wolf Volcano last erupted in May and June of 2015. Landsat 8 captured the lava flow from the steep-sloped shield volcano on January 13, 2022. |
||||||||||||||||||||||||||||||||
| Lawrenceville and Vincennes | Earthshots | flooding, rain, rivers, weather | In this area at near Lawrenceville, Illinois,… |
In this area at near Lawrenceville, Illinois, and Vincennes, Indiana, some fields are green, some are maroon, and others are pink. Why are these fields different colors? In this band combination, bright green is healthy vegetation, so the crops are growing well in those fields. Some fields have a faint green color; crops are growing in those fields, but they are younger than the crops in the bright green fields. The pink and maroon fields are bare soil, probably planted but there is no growth yet. The bright pink fields have slightly less moisture in the soil. In the post-flood image, some of these fields near the river that were flooded are dark pink, indicating they still contain moisture. |
Natural-Disasters, Water | |||||||||||||||||||||||||||||||
| LCMAP: Revolutionizing Remote Sensing | Video - EROS | |||||||||||||||||||||||||||||||||||
| LDCM Already Helping Assess Burn Severity | Image of the Week | burn scars, burn severity | ||||||||||||||||||||||||||||||||||
| Lee Soaks Gulf Coast Area | Image of the Week | flooding, rain, storms, weather | ||||||||||||||||||||||||||||||||||
| Lena Delta | Earth As Art | deltas, rivers | The Lena River, some 2,800 miles (4,500km) long,… | The Lena River, some 2,800 miles (4,500km) long, is one of the largest rivers in the world. The Lena Delta Reserve is the most extensive protected wilderness area in Russia. It is an important refuge and breeding grounds for many species of Siberian wildlife. |
||||||||||||||||||||||||||||||||
| Lena Delta | Image of the Week | deltas, rivers | ||||||||||||||||||||||||||||||||||
| Leslie Street Spit and Tommy Thompson Park | Image of the Week | harbors, land conversion | ||||||||||||||||||||||||||||||||||
| Lesotho | Earthshots | drought, hydropower, lakes, reservoirs, rivers | South Africa needed water. Lesotho needed… |
South Africa needed water. Lesotho needed electricity. One huge project aims to solve both problems. Lesotho is a small mountainous country completely surrounded by South Africa. A little smaller than the U.S. state of Maryland, Lesotho’s most important natural resource is clean water, dubbed “white gold.” Lesotho’s highlands receive about 1,200 millimeters of rainfall annually and are the main headwaters for the Orange (Senqu) River system. Most of that water leaves Lesotho, flowing east to west across South Africa, where the river empties into the Atlantic Ocean. Measured by per capita gross domestic product (GDP), Lesotho is a relatively poor country, falling in the bottom 20 percent of countries. South Africa is one of the wealthier countries in Africa but has been experiencing water shortages. Its industrial heartland includes the large city of Johannesburg, over 300 kilometers to the north and outside of the Landsat scenes displayed here. Recurring drought and increasing demand for water have put additional pressure on water resources there. Two dams have been completed on tributaries of the Orange (Senqu) River as part of the Lesotho Highlands Water Project (LHWP), which harnesses Lesotho’s water and exports it to South Africa. Before this project, Lesotho was dependent upon South Africa for electricity. Lesotho can now generate electricity from the dams. Additionally, hundreds of kilometers of roads were built or upgraded in Lesotho’s mountainous landscape, cutting down on travel time, in some cases by days. Not all of the reviews of this project have been positive. Some studies have reported there may not have been enough foresight of the stress on water resources that drought and climate change could be causing. Furthermore, reduced river flows could affect communities that rely on the river for livelihoods, and some say this impact was not well understood before the project began. Besides these possible environmental consequences, many communities claim that they did not receive promised compensation for relocation. |
Dams, Mountains, Water | |||||||||||||||||||||||||||||||
| Letters to the North Pole | Image of the Week | sea ice | Unlike the South Pole, the geographic North Pole… | Unlike the South Pole, the geographic North Pole does not lie on a land mass. The Earth’s northern axis of rotation is in the Arctic Ocean, covered by shifting sea ice. Landsat does not image the North Pole, which makes it an imperfect investigative tool for the detection of Santa’s workshop. It does, however, collect imagery over North Pole, Alaska, a small town south of Fairbanks that receives thousands of letters to Santa each year. This Landsat 8 image shows Santa’s continental outpost in November, the latest month in the year that sunlit imagery is collected there. The shorter days of December don’t offer enough sunlight to collect usable data at northern latitudes. Letters to Kris Kringle don’t always land in North Pole, Alaska. Many are processed 400 miles south. The Anchorage, Alaska post office also receives letters to Santa, and letters from Santa are stamped there for delivery to children in the Lower 48 states. Some Christmas letter-writers bypass the North Pole altogether in favor of Santa Claus, Indiana, seen here in a Landsat 5 image from Christmas Day 1998. That city is home to the Santa Claus Museum and Village, Christmas Lake, and a campground named “Lake Rudolph.” Ironically, Santa Claus also has a summertime theme park, with areas for Christmas, Halloween, Thanksgiving and Fourth of July. The park is visible in this high-resolution orthoimage from February 2013. |
||||||||||||||||||||||||||||||||
| LGSOWG - Invitation to Rapid City | Video - Landsat | |||||||||||||||||||||||||||||||||||
| Liaodong Bay, China | Image of the Week | deltas, land conversion, marshland, rivers, sediment | These Landsat images show the land use changes of… | These Landsat images show the land use changes of the Liaodong Bay area in northeastern China. The Shuangtaizi River and the Daliao River carry large amounts of sediment from the loess plains and agricultural soil erosion upstream. The salt marshes on the river delta have been affected by an expanding aquaculture industry, visible as the dark geometrical shapes that have clearly expanded in the 2015 image. Also visible is the expanding city of Yingkou and ports extending into Liaodong Bay. |
||||||||||||||||||||||||||||||||
| Life along the Nile | Earth As Art | rivers | It is easy to see from this image why people have… | It is easy to see from this image why people have been drawn to the Nile River in Egypt for thousands of years. Green farmland marks a distinct boundary between the Nile floodplain and the surrounding harsh desert. |
||||||||||||||||||||||||||||||||
| Limestone Mining | Earthshots | canals, hydrology, lakes, levees, limestone quarries, national park, population, rivers | The Everglades sit on top of a bedrock of… |
The Everglades sit on top of a bedrock of limestone. Limestone quarries, the dark rectangular shapes just west of the urban areas, provide about half of the rock used in Florida’s construction. In this part of Florida, groundwater is very near the surface. So as the rock is mined, the quarry pits fill with water. These lakes range from 30 to 50 feet deep and cover a total of about 4,900 acres. Because of these artificial lakes, the region earned the name “The Lake Belt.” These rectangular water bodies expand and change shape over time in the image series. Near the top center to the left of the highway, some of the areas that started out as mines turned into developed, with that desirable waterfront incorporated into the residential areas. The prominent diagonal line running from the upper left to the lower right is the Miami Canal, which flows from Lake Okeechobee and into the Miami River near the airport. The river then flows through downtown Miami and into Biscayne Bay. On the far left of these images is a vertical line that marks the boundary of the Francis S. Taylor Wildlife Management Area. Between that and the limestone pits is the Pennsuco Wetlands, part of the east coast buffer project, designed to act as a zone of protection between the Everglades and the urban centers further east. Water can be captured, stored, and released when it benefits both the urban communities and the ecosystem. Higher water levels in the Everglades then have less chance to impact the populated areas. |
Agriculture, Cities, Mining, Water, Wetlands | |||||||||||||||||||||||||||||||
| Lisan Peninsula | Earthshots | evaporation, evaporation ponds, salt, salt pan, salt ponds, saltwater, sea, water use | The prominent land feature that separates the… |
The prominent land feature that separates the northern and southern basins is the Lisan Peninsula. (Lisan means “tongue” in Arabic.) The geologic name for this structure is diapir, a mass of low density material that has pushed upward. On March 22, 2000, the northern part of a salt pan on the Lisan Peninsula collapsed 2 months after it was completed. The February 15, 2000, image shows water in this pan, but in the October 28, 2000, and later images, the water is drained out. About 56 million cubic meters of brine went back into the Dead Sea when the dike collapsed. As the Dead Sea level declines, the land that becomes exposed is unstable. Future land feature changes similar to the salt pan collapse on the Lisan Peninsula may accompany the decreased water levels and exposure of additional unstable land. |
Water | |||||||||||||||||||||||||||||||
| Lithium Mining in Salar de Atacama, Chile | Image of the Week | evaporation ponds, lithium, salt flats, water use | The Salar de Atacama in Chile is a large, dry… | The Salar de Atacama in Chile is a large, dry salt flat surrounded by mountain ranges and is one of the driest places on Earth. Parts of the Atacama Desert have gone without rain for as long as people have been keeping track, but water rich in dissolved salts lies beneath this flat surface. The Salar is particularly rich in lithium salts. |
||||||||||||||||||||||||||||||||
| Logging in Oregon, USA | Earthshots | clearcuts, forestry, logging, reforestation | Every year, it takes one tree, 16 inches in… |
Every year, it takes one tree, 16 inches in trunk diameter and 100 feet tall, to meet every American’s need for paper, packaging, and lumber products. If that tree was harvested in Oregon, it was logged using strict environmental protections. In Oregon, the goal is sustainable forestry. The logging industry there works to meet current societal needs for forestry products while ensuring that future generations will be able to enjoy the same benefits from abundant forest resources that we do today. Much of Oregon has been heavily logged in the past, but in western Oregon, where these Landsat images are focused, nearly 1 million acres of intact, old growth forests remain. And almost all land in Oregon that is logged is reforested. One reason for the goal of sustainable forestry in Oregon is the Northwest Forest Plan, adopted in 1994, which resulted in a decline in forest harvesting on federal lands. After the plan was implemented, harvesting rates became longer to accommodate regrowth, and more partial cuts were used instead of clearcuts. The plan also works to protect old growth forest while maintaining sustainable logging. A multi-image time-series from Landsat can create “regrowth trajectories.” The 30-m resolution from Landsat is enough detail to see the harvest rotation cycle. Douglas fir in western Oregon can regrow to a closed canopy stage in 15–20 years, so the time frame of the Landsat record can show just over one harvest rotation cycle. Even from one year to the next, there is change. For example, look closely at the recent images. Can you find new cleared areas in the green forest land? |
Forests | |||||||||||||||||||||||||||||||
| Lomas de Aparicio | Earthshots | migration, monarch butterflies | These close-up images show a portion of the… |
These close-up images show a portion of the reserve. The red spots in the global forest map indicate forest loss. The area in the center of the image is in a location called Lomas de Aparicio, which is within the core zone of the reserve. The forest loss here has been identified as large-scale logging activity by Vidal and others (2013) and by Google Earth imagery from 2004 and 2013. All of these images clearly demonstrate that the forest was heavily impacted between 2004 and 2013. It is unlikely monarchs will form overwintering colonies at the Lomas de Aparicio site in future years. If they do, they will face much greater environmental risks during their overwintering stay. Even though the monarchs use only a small portion of this oyamel forest habitat, they depend on the entire dense forest structure. The forest canopy acts as a blanket and keeps them warmer and captures moisture that they need for their survival. A fragmented forest will not do this. |
Forests, Wildlife | |||||||||||||||||||||||||||||||
| Looking to Fill the Voids? NASADEM is Here! | Video - LP DAAC | |||||||||||||||||||||||||||||||||||
| Losing Forest Fast | Earthshots | island, spiny thicket | Looking at a more specific region within these… |
Looking at a more specific region within these images makes it clear that that the Spiny Thicket seems to be disappearing fast. Since 1990, this ecoregion has had the highest deforestation rate in the country. Agriculture in this region is done by slash-and-burn. The fields are cleared by burning, then planted. The forest is also used for charcoal production. Most households use charcoal to cook their daily meals. Even though this is less destructive than slash-and-burn, charcoal production causes the degradation of vast areas of the Spiny Thicket. Even when the Spiny Thicket regenerates, it does so as cactus scrub. Landsat is uniquely suited to monitoring these types of land changes over large areas. Forests once covered Madagascar, but forest cover has been reduced to less than one-fourth of the island’s original extent. Information gathered by Landsat can help improve management of remaining resources. |
Agriculture, Deforestation, Forests | |||||||||||||||||||||||||||||||
| Louisiana | Shaded Relief | Shaded Relief Images of specific areas (generally… | Shaded Relief Images of specific areas (generally by state) have been selected from the National Elevation Dataset. For original data details, see NED. |
|||||||||||||||||||||||||||||||||
| Louisiana | State Mosaics | Louisiana is the only state with a large… | Louisiana is the only state with a large population of Cajuns, descendants of the Acadians who were driven out of Canada in the 1700s because they would not pledge allegiance to the King of England. |
|||||||||||||||||||||||||||||||||
| LP DAAC Prospectus 2017-2019 | Video - LP DAAC | |||||||||||||||||||||||||||||||||||
| LP DAAC Prospectus: 2019 - 2021 | Video - LP DAAC | |||||||||||||||||||||||||||||||||||
| Luminescence | Earth As Art | rivers, swamps | A mesmerizing plume creates a paradox of light… | A mesmerizing plume creates a paradox of light and dark, brilliant and murky. The dark water of the Suwannee River flows from the Okefenokee Swamp in southern Georgia to the Gulf of Mexico in Florida. The river’s inky color comes from decaying vegetation at the river’s swampy source. |
||||||||||||||||||||||||||||||||
| Lurking Madness | Earth As Art | This Landsat image looks like a bold watercolor.… | This Landsat image looks like a bold watercolor. Yellow dances across the darkness with muted violet underneath. With a kind of science-fiction flair, this scene shows a portion of the Qattara Depression in Egypt. |
|||||||||||||||||||||||||||||||||
| Lusi Mud Volcano, Indonesia | Image of the Week | eruptions, mud, mud volcanoes, volcanoes | The largest mud volcano in the world is located… | The largest mud volcano in the world is located in Porong, Sidoarjo in Indonesia, where it is locally called the Lusi Mud Volcano. Mud volcanoes are created when hot mud (rather than lava) erupts from a vent on the Earth’s surface. This type of eruption typically includes a mixture of steam and gas, groundwater, and mud-based slurry. Lusi first erupted in May 2006, and is expected to continue erupting for decades. So far, enough mud has erupted to cover nearly 27,000 football fields in a meter of mud. These two Landsat images were acquired by Landsat 7 on April 28, 2006 (left) and June 24, 2015 (right). The round feature in the center of the right-hand image shows the current extent of the mudflow. This second image also shows a series of levee structures that were built in 2008 to surround and contain the ongoing mudflows. The Landsat sensors include numerous spectral bands that can be used in various combinations, allowing users to accentuate and study specific features on the Earth’s surface. These two images used a combination of shortwave and near-infrared wavelengths to highlight the mudflow area, in contrast to the surrounding urban and agricultural areas. |
||||||||||||||||||||||||||||||||
| MacDonnell Ranges | Earth As Art | The MacDonnell Ranges are a band of mountains… | The MacDonnell Ranges are a band of mountains spanning Australia's arid interior. Only a portion of the Ranges can be seen in this image. |
|||||||||||||||||||||||||||||||||
| Mackenzie Meets Beaufort | Earth As Art | ice, rivers, sediment, snow | In far northern Canada, pulses of freshwater flow… | In far northern Canada, pulses of freshwater flow down rivers after inland ice and snow melts. These pulses, known as a freshet, carry huge amounts of sediment. The sediment seen in this image flowed into the Beaufort Sea from the Mackenzie River, the longest northward-flowing river in North America. |
||||||||||||||||||||||||||||||||
| Mackenzie River Valley Fire Scars | Image of the Week | boreal forest, burn scars, rivers | ||||||||||||||||||||||||||||||||||
| Madagascar | Earthshots | island, spiny thicket | Madagascar, the world’s fourth largest island… |
Madagascar, the world’s fourth largest island, is located off the southeastern coast of Africa in the Indian Ocean. Because it is isolated from neighboring continents, almost all of its plant and animal species are found nowhere else on Earth. In southwestern Madagascar, plants have adapted to a dry desert-like climate. These unique plants are so peculiar they cannot be classified into common classes like desert or forest. Many species there have small leaves and spines and can retain water very well—characteristics of succulents that are typical in deserts. They also have tall trunks, appearing more like trees. So the vegetation in this region often is named Madagascar Spiny Thicket. This ecoregion, which extends across southern and southwestern Madagascar, has a long dry season. Most of the rain falls from October to April, but rainfall amounts can be erratic. The plants’ unusual adaptations allow them to survive the long dry periods. But this ecoregion is experiencing rapid deforestation, which is evident in this Landsat series. |
Agriculture, Deforestation, Forests | |||||||||||||||||||||||||||||||
| Maine | Shaded Relief | Shaded Relief Images of specific areas (generally… | Shaded Relief Images of specific areas (generally by state) have been selected from the National Elevation Dataset. For original data details, see NED. |
|||||||||||||||||||||||||||||||||
| Maine | State Mosaics | The West Quoddy Head Lighthouse in Lubec, Maine… | The West Quoddy Head Lighthouse in Lubec, Maine is the easternmost point in the 48 conterminous states. The first structure was built in 1808 by order of President Thomas Jefferson. The current brick lighthouse was built in 1858. |
|||||||||||||||||||||||||||||||||
| Malaspina Glacier | Earth As Art | ice | The tongue of the Malaspina Glacier, the largest… | The tongue of the Malaspina Glacier, the largest glacier in Alaska, fills most of this image. The Malaspina lies west of Yakutat Bay and covers 1,500 sq mi (3,880 sq km). |
||||||||||||||||||||||||||||||||
| Mamoré River, Bolivia | Earthshots | cutoffs, erosion, floodplains, lakes, oxbow lakes, rivers, sediment | In the Amazon basin, some rivers run wild.… |
In the Amazon basin, some rivers run wild. With no dams or levees to control them, they are free to meander—some more than others. For example, the Rio Mamoré, which flows north across Bolivia, is one such wanderer. It flows from the Andes Mountains and across the Bolivian lowlands into Brazil. Watching this river meander in Landsat images over the past few decades shows us how much a river can meander under natural conditions. The Mamoré has a large sediment load, so it meanders more than most. These meandering river dynamics are important for maintaining a healthy habitat. The floodplains here depend on the river migration to maintain the wetland habitats. The growing city of Trinidad, with a population of over 100,000, can be seen in the upper right of these images, just east of the river. |
Water | |||||||||||||||||||||||||||||||
| Manama | Earthshots | airport, artificial islands, islands, land creation, land reclamation, population, port, urban growth | Bahrain’s capital is Manama, a city with an… |
Bahrain’s capital is Manama, a city with an estimated population of 1,480,000 in 2017, up 1,567% from 88,785 in 1971. Expansion into the desert and onto artificial islands is evident in this series of Landsat images. The amount of vegetation (green) clearly increases in the past few decades. The added vegetation is mostly agricultural or in heavily landscaped areas. Near the bottom of the image, the addition of a golf course is seen in 2001, which is expanded by 2015. To the left of that is a road that has been lined with vegetation by 2015. The Bahrain International Airport, with its 3,418-meter runway, is prominent in the upper right corner of the image. Other notable industry in Manama is the addition and expansion of the Arab Shipbuilding and Repair Yard, which has 15 ship repair berths, and Khalifa bin Salman Port, which opened in 2009 as a major regional distribution center. Both the shipyard and port are on reclaimed land east of Manama. |
Cities, Coasts, Deserts | |||||||||||||||||||||||||||||||
| Mangrove Benefits | Earthshots | alluvial, carbon, delta, flooding, floodplain, mangrove, salt water | Mangroves are sturdy species. They can recover… |
Mangroves are sturdy species. They can recover from storm disturbances relatively quickly. They can tolerate salt water, saturated soil, high wind, and storms. But they are a threatened ecosystem because of overexploitation of its resources. Mangrove forests appear bright green in the Landsat images. Their degradation is evident in the reduction of the green color throughout the series. One island remains bright green amid the deforestation. That’s the Meinmahla Kyun Wildlife Sanctuary, which was established in 1986. Mangroves offer a multitude of benefits, both for the environment and for people. As guardians of the shoreline, mangroves reduce the impacts from storms and tsunamis. Their dense and partially submerged root system protects inland areas from erosion and flooding. Food security is closely linked to a healthy mangrove ecosystem. A mangrove delta is a nursing ground for aquatic species, which provide food for local communities. Besides providing fuel wood and building material for people, mangroves also purify the water. Mangrove ecosystems have a global benefit, too. Worldwide, mangroves sequester an estimated 22.8 to 25.5 million metric tons of carbon each year. A mangrove region as extensive as the Ayeyarwady Delta is well worth monitoring. |
Coasts, Deforestation, Forests | |||||||||||||||||||||||||||||||
| Manila, Philippines | Image of the Week | population, rivers, urban growth, water use | ||||||||||||||||||||||||||||||||||
| Mapanuepe Lake | Earthshots | ash, caldera, eruption, lahar, lakes, mud, mudflows, pyroclastic flows, rivers, runoff, sediment, volcanoes, weather | The lahars produced by Pinatubo’s eruption… |
The lahars produced by Pinatubo’s eruption blocked the flow of the Mapanuepe River and created a new lake, named Mapanuepe Lake. The formation of the lake flooded the small towns of Aglao, Buhawen, and Pili. Breakout lahars continued to be a threat in the years after the lake formed, but artificial channels help to stabilize the lake’s water level. In the series of images that accompany this section, Pinatubo’s summit crater is in the upper right corner. In the 1989 image, the maroon colors indicated moisture in the soils southwest of Pinatubo’s summit. After the eruption, the bright gray or pink colors streaming from the summit are sediment-laden lahars in the Marella River, which flows into the Santo Tomas River Valley. The lahars effectively widened this river plain, and the sediment persists, indicated by the shades of pink. The brighter mottled white and gray in the upper left of the image after the eruption gradually returned to forested green tones. Mapanuepe Lake is the dark shape in the lower right. Southeast of the lake is the copper and gold Dizon Mines. Cleared land for the mining activity appears in pink shades in the midst of the green forested areas. The small dark shape is water at the bottom of the mine’s main open pit. Again, a few ASTER images in this series help fill in some gaps where Landsat imagery was cloudy. The complementary imagery of the changes over time to these valleys help scientists understand more fully the trajectories of the changes. |
Mountains, Natural-Disasters | |||||||||||||||||||||||||||||||
| Mapping Biodiverse Highlands with Satellite Imagery and Advanced Elevation Data | Image of the Week | A team from the USGS Earth Resources Observation… | A team from the USGS Earth Resources Observation and Science (EROS) Center produced a detailed land use/land cover map using Landsat satellite and 30-meter elevation data from the Shuttle Radar Topography Mission (SRTM) of the highlands along the Senegal-Guinea border. The Dindefelo Nature Reserve was created to protect the high biodiversity of this area, including chimpanzee habitat, which is closely correlated with topography. The map helps scientists visualize the resources within the reserve and the mounting human pressure on the natural landscapes that surround it. The Landsat 8 image (left) of the study area coupled with the SRTM 30-meter data (center) provides a specialized view of the topography. The land cover map (right) shows the diverse habitats, including the locations of gallery forests. These narrow ribbons of dense trees follow watercourses and are indicated as purple shades on the land cover map. Gallery forests provide critical refuge for many species of plants and animals during the long, hot dry season. The maps are being used in a proposal by the Jane Goodall Institute to Senegal and Guinea to extend the Dindefelo Nature Reserve south into the Guinea highlands. Mapping these biodiverse highlands is one example that demonstrates the advantage of the more accurate elevation data from SRTM. For more information, see the USGS Top Story. |
|||||||||||||||||||||||||||||||||
| Mapping Permafrost in Alaska | Image of the Week | permafrost | Near-surface permafrost in Alaska is in danger of… | Near-surface permafrost in Alaska is in danger of degrading with projected warmer conditions. Detailed information is needed to adequately monitor permafrost, but previous modeling of permafrost properties has typically been done at coarse resolution. A new study, led by the USGS Earth Resources Observation and Science (EROS) Center, developed the first medium-resolution (30-m) map of near-surface (within 1 m) permafrost for all of mainland Alaska. Researchers used models to project permafrost degradation in the future based on various climate scenarios described in the Intergovernmental Panel on Climate Change (IPCC). Projections indicate that climate impacts (excluding fire impacts) will cause a decrease in near-surface permafrost of 16 to 24 percent by the end of the 21st century. Predictions of permafrost degradation were most pronounced for central Alaska, where permafrost temperatures typically hover around the melting point of 0°C. The colors on this map indicate the probability that there is near-surface permafrost currently. Red and orange shades are areas with a low probability of permafrost, and blue shades are areas with a high probability of permafrost. When comparing the current map to future scenarios, the expectation of degraded permafrost is evident. The mapping of permafrost distribution across Alaska is important for land-use planning, environmental assessments, and predicting future vegetation and carbon stocks. For more information, see the research article in Remote Sensing of Environment. |
||||||||||||||||||||||||||||||||
| Mar Chiquita Change Over Time | Image of the Week | drought, lakes, rivers | ||||||||||||||||||||||||||||||||||
| March 21, 2013-First Image from LDCM! | Image of the Week | burn scars, golf courses, infrared | ||||||||||||||||||||||||||||||||||
| Marree Man Geoglyph in Australia Does Reappearing Act | Image of the Week | geoglyphs | In June 1998, a pilot discovered a strange sight… | In June 1998, a pilot discovered a strange sight in the Australian outback that wasn’t there before—a huge outline of what appeared to be an Aboriginal man throwing either a boomerang or a stick. It turned out to be a geoglyph, which is a design on the ground typically made of natural elements and best viewed from above. This geoglyph was distinctive and large enough to be clearly visible in Landsat images.
|
||||||||||||||||||||||||||||||||
| Maryland | Shaded Relief | Shaded Relief Images of specific areas (generally… | Shaded Relief Images of specific areas (generally by state) have been selected from the National Elevation Dataset. For original data details, see NED. |
|||||||||||||||||||||||||||||||||
| Maryland | State Mosaics | Forests cover approximately 2.6 million acres, or… | Forests cover approximately 2.6 million acres, or 41 percent, of Maryland’s land surface. Oak and hickory are the dominant hardwood or deciduous forest types, and loblolly pine is the most prevalent softwood. |
|||||||||||||||||||||||||||||||||
| Massachusetts | Shaded Relief | Shaded Relief Images of specific areas (generally… | Shaded Relief Images of specific areas (generally by state) have been selected from the National Elevation Dataset. For original data details, see NED. |
|||||||||||||||||||||||||||||||||
| Massachusetts | State Mosaics | Plymouth Rock is the legendary stepping stone of… | Plymouth Rock is the legendary stepping stone of the Pilgrims’ arrival in what is now Massachusetts. It sits on the shore of Plymouth Harbor at Pilgrim Memorial State Park and is actually no bigger than a coffee table. |
|||||||||||||||||||||||||||||||||
| Massive Berg Adrift in Antarctica | Image of the Week | ice shelves, icebergs, rifts | Thanks to their polar orbits, Landsat satellites… | Thanks to their polar orbits, Landsat satellites collect images more frequently in Arctic and Antarctic regions. The data they collect is especially useful in monitoring changes to ice shelves like this one in Antarctica. A 315 billion-ton iceberg known as D28 has inched seaward since a western rift emerged in the Amery Ice Shelf in the early 2000s. In September of 2019, D28 finally broke free. The freed iceberg has a surface area of more than 600 square miles, roughly comparable to the size of the Hawaiian island of Oahu. It’s the largest iceberg to calve from the ice shelf since the 1960s. |
||||||||||||||||||||||||||||||||
| Maui, Hawaii, USA | Earthshots | Maui, the second largest Hawaiian island, is… |
Maui, the second largest Hawaiian island, is made up of two dormant volcanoes, West Maui Mountain and Haleakala. Between those peaks lies Maui’s central plains, which for decades were dominated by sugar cane fields. The sugar industry in Hawaii dates to 1835 with the establishment of sugar plantations. Sugar cane was a major crop and economic contributor for Hawaii through the 20th century. When the island’s last large cane mill closed in 2016, 41,000 acres of cane fields began changing to nonnative grasses, which are susceptible to fire. Landsat is tracking this shift—through the sporadic cloud cover in the tropical paradise—from the bright green shapes that dominated the central plain of the island to the grasses that took over. Dry grasses appear as a brown swath, but the grass greens up in winter, as seen in the January 2022 image. The green grasses are a different shade and pattern than when the land supported sugar cane. |
Agriculture, Fires | ||||||||||||||||||||||||||||||||
| Mayn River | Earth As Art | rivers, snow | The Mayn River, seen here with what is thought to… | The Mayn River, seen here with what is thought to be a portion of the Anadyr River, flows through the far northeastern corner of Siberia. |
||||||||||||||||||||||||||||||||
| Meandering Mississippi | Earth As Art | lakes, rivers | Small, blocky shapes of towns, fields, and… | Small, blocky shapes of towns, fields, and pastures surround the graceful swirls and whorls of the Mississippi River. Countless oxbow lakes and cutoffs accompany the meandering river south of Memphis, Tennessee, on the border between Arkansas and Mississippi, USA. The "mighty Mississippi" is the largest river system in North America. |
||||||||||||||||||||||||||||||||
| Measuring Water Use with Landsat | Image of the Week | evapotranspiration, irrigation, rivers, water use | As drought conditions continue in the western… | As drought conditions continue in the western United States, there is more demand for water for irrigation purposes. Increasing population also increases water demand. |
||||||||||||||||||||||||||||||||
| Mediterranean Sea | Earth As Art | The Mediterranean Sea physically separates--but… | The Mediterranean Sea physically separates--but in other ways unites--southern Europe, the Middle East, and northern Africa. |
|||||||||||||||||||||||||||||||||
| Meighen Island | Earth As Art | fjords, islands, snow | A veil of blowing snow nearly obscures Meighen… | A veil of blowing snow nearly obscures Meighen Island (left) off the northern coast of Canada. Across the Sverdrup Channel lies the much larger Axel Heiberg Island, where glaciers (blue) huddle among mountain peaks (yellow) and flow into deep fjords. No evidence of human occupation has ever been found on Meighen Island. |
||||||||||||||||||||||||||||||||
| Mélange | Earthshots | calving, ice, icebergs, mélange, moraine, terminus, tidewater glacier | Landsat images show chunks of ice floating on… |
Landsat images show chunks of ice floating on the surface of the water as Columbia Glacier retreats. These icebergs have broken off, or calved, from the front edge of the glacier. This conglomerate of floating ice and chunks of icebergs is known as an ice mélange, which can slow the rate that glaciers slip into the sea. The ice mélange looks less defined in the images than the glacier itself, which usually has some smooth-looking longitudinal lines. The mélange appears more mottled, and in some images there is very little of it at all (like in 2006). So don’t confuse ice mélange with the end of the glacier. Columbia’s terminal moraine is still evident long after the end of the glacier retreated far upstream and serves as a marker for the maximum advance of the glacier. A terminal moraine is the accumulated mass of sediment, rocks, and debris that the glacier deposits at the terminus. The moraine at this historical terminus prevents the mélange from drifting beyond it. View an animation showing more Landsat images of Columbia Glacier. |
Glaciers, Water | |||||||||||||||||||||||||||||||
| Melted Colors | Earth As Art | burn scars, sand dunes | This enhanced image of Western Australia… | This enhanced image of Western Australia resembles a mixture of crayons that melted in the sun. The yellow sand dunes of the Great Sandy Desert cover the upper right portion of the image. Red splotches indicate burned areas from grass and forest fires, and the colors in the rest of the image depict different types of surface geology. |
||||||||||||||||||||||||||||||||
| Melting in Greenland | Image Comparison Sliders | ice, ice sheet | ||||||||||||||||||||||||||||||||||
| Melting in Greenland | Image of the Week | ice, ice sheets | In a recent Image of the Week video, we watched… | In a recent Image of the Week video, we watched as a glacier disappeared in Iceland. Rapid change is occurring across the Arctic. At the end of July, satellite imagery captured a major melting event in Greenland. The northern reaches of the Greenland Ice Sheet typically stay below the freezing point year-round. In summer, some melting near the coast is not unusual, but the extent of melting this summer was rare. According to the National Snow and Ice Data Center, the daily surface melt extent on the ice sheet on July 30 was almost 1 million square km. Some of that appears as blue ponds in the 2019 image from Landsat 8. A Landsat 5 image from 1987 shows much less melt water in the same location. This year’s melting was the result of a short-term temperature anomaly over Greenland. In the Arctic, temperatures are rising twice as fast as the global average, making these northern ice sheets even more vulnerable. |
||||||||||||||||||||||||||||||||
| Memorial Stadium, University of Nebraska Cornhuskers | Image of the Week | stadium | ||||||||||||||||||||||||||||||||||
| Memphis Flooding Change Pair | Image of the Week | flooding, rivers | ||||||||||||||||||||||||||||||||||
| Mendocino Complex Fire Scorches Northern California | Image of the Week | burn scars, near-infrared, shortwave infrared, smoke | Landsat 8 captured satellite views of California’… | Landsat 8 captured satellite views of California’s largest wildfire on record in the summer of 2018. The Mendocino Complex fire in northern California is a combination of two fires: the Ranch Fire and the River Fire. Both fires started July 27, and hot, dry, windy conditions caused them to spread rapidly. Landsat 8 imaged the area the day before the fires broke out. By August 11, over 328,000 acres were burned. The burn scar seen in the July 26 image is from the Pawnee Fire that burned in late June. Another Landsat 8 image captured several hotspots and thick smoke on August 4. This image shows the eastern edge of the Ranch Fire where a pyrocumulus cloud formed. These towering clouds of hot air and smoke form when a fire burns hot enough to generate a strong updraft. Landsat’s 30-meter resolution allows detailed mapping of burn extent and severity with its shortwave infrared and near-infrared bands. As of August 13, the Mendocino Complex fires have burned nearly 350,000 acres. The USGS EROS Center supports LANDFIRE and MTBS, projects that monitor fire activities. |
||||||||||||||||||||||||||||||||
| Mesabi Range, Minnesota, USA | Earthshots | aerial photos, iron ore, lakes, open pit, pit lakes, tailings ponds | The boom times of iron ore mining in northern… |
The boom times of iron ore mining in northern Minnesota are long gone, but mining operations continue and are even expanding, as seen in these Landsat images. The Mesabi Range, which stretches 80–100 miles from Grand Rapids to Babbitt, contributed about 60% of the total iron ore output in the United States throughout most of the 20th century. The soft ore was close to the surface, and it could be scooped from open-pit mines and shipped by rail to Lake Superior and eventually to steel mills. Iron ore production peaked in the 1940s when more than 600,000 tons were shipped during World War II. Production remained high in the postwar years and then declined. The high-grade ore was soon nearly depleted. Mining activity on the Mesabi Range now involves digging out lower grade ore for processing. The iron ore open-pit mines on the Range are among the biggest in the world. But the footprints of the mines’ tailings ponds are even bigger. Both are readily visible in these Landsat images. |
Mining | |||||||||||||||||||||||||||||||
| Mesopotamian Marshes, Iraq | Earthshots | canals, irrigation, marshes, oil, rivers, water use | Fifty years of observing the Earth means… |
Fifty years of observing the Earth means Landsat has witnessed many land surface changes. A few of those changes are shocking in their sheer scale and swiftness. A vast wetland in southern Iraq has been decimated in recent decades by a variety of factors—all documented by the consistent and objective data from Landsat satellites. Imagery from Landsat’s first few weeks of operation in summer 1972 shows the Mesopotamian Marshes at nearly their maximum extent. Over time, Landsat shows the marshes diminish, dry up, and then partially recover. The Mesopotamian Marshes are divided into three areas: Al Hammar, Central, and Al Hawizeh.
|
Water, Wetlands | |||||||||||||||||||||||||||||||
| Mesquite Mine, California | Image of the Week | gold | ||||||||||||||||||||||||||||||||||
| Mexico and Central America | Earth As Art | Mexico and Central America together form the… | Mexico and Central America together form the southern half of the North American continent. From the rugged deserts of the Baja Peninsula to the steamy rain forests of Panama, the region is a land of great contrasts. |
|||||||||||||||||||||||||||||||||
| Mexico’s Biosphere | Earth As Art | mangrove, rivers, sediment | Much of this image consists of the Reserva de la… | Much of this image consists of the Reserva de la Biosfera Pantanos de Centla, a biosphere reserve in southern Mexico that protects wetlands in the area. The water bodies, mangroves, and forests are a sanctuary for a great variety of wildlife. Sediment carried away by the Grijalva River appears as a sweeping light blue brushstroke flowing into the Gulf of Mexico at the top of the image. |
||||||||||||||||||||||||||||||||
| Mezen Mixing | Earth As Art | estuaries, rivers, sediment | In northern Russia, the freshwater of the Mezen… | In northern Russia, the freshwater of the Mezen River meets the saltwater of the Arctic Ocean. The funnel-shaped estuary has a strong tidal current that mixes sediment in the water rather than building up a delta. In this colorful composition, the increasing brightness marks an increase in water turbidity. |
||||||||||||||||||||||||||||||||
| Michigan | Shaded Relief | Shaded Relief Images of specific areas (generally… | Shaded Relief Images of specific areas (generally by state) have been selected from the National Elevation Dataset. For original data details, see NED. |
|||||||||||||||||||||||||||||||||
| Michigan | State Mosaics | The Mackinac Bridge is one of the longest… | The Mackinac Bridge is one of the longest suspension bridges in the world. It connects the upper and lower peninsulas of Michigan and spans five miles over the Straits of Mackinac, where Lake Michigan and Lake Huron meet. |
|||||||||||||||||||||||||||||||||
| Mille Lacs Lake, Minnesota, USA | Earthshots | fishing, ice, ice fishing, ice road, lakes | What looks from above like a temporary… |
What looks from above like a temporary geoglyph on the ice or a series of abstract Etch A Sketch doodles are ice roads on Mille Lacs Lake in central Minnesota. The ice roads provide a way for ice fishers to get to their ice shacks on the frozen lake. Some roads extend for a few miles. Even though Landsat is famous for its 50-year record of global land change, its observations can show us how temporary villages and ice roads change over time on a large frozen lake. The winter of 2023-24 was uncommonly warm in Minnesota and brought lower than average snowfall. And the Landsat imagery shows it. The 2024 images show a stark difference to the other images.
|
Water | |||||||||||||||||||||||||||||||
| Mine Tailings | Earthshots | copper, tailings | To conserve water and minimize environmental… |
To conserve water and minimize environmental impacts, Escondida created a tailings impoundment that has expanded along with its mining operations. The tailings material is left over after the majority of the valuable metals have been removed from the ore. This copper-bearing waste is poured into the impoundment area as a liquid (dark region at the bottom of the 2011 and later images); it dries to the lighter-toned spoil seen in the images. The spoil is held behind a retaining dam, just more than 1 kilometer long, visible in the 2011 and later images as a straight line on the northwest corner of the pond. |
Deserts, Mining | |||||||||||||||||||||||||||||||
| Mining | Earthshots | copper, open pit, ore, tailings, waste | As part of the mining, huge amounts of… |
As part of the mining, huge amounts of material are dug up and removed. The ore is crushed within the pit, and conveyors bring the ore to the mill. New pits open up as the time series of Landsat images progresses. Landsat shows not only the expansion of the mining pits but also the extent of the material piled up alongside the pits. The shifting shape of gray and blue on the right is the Talabre tailings impoundment. The Talabre is a natural depression, and the tailings, the materials left over after the ore is extracted, are dumped into several basins. The basins are separated with dikes, and the impoundment is bordered by dams, all made with dry tailings. An underground mining operation is now underway. Testing indicates that 2.3 billion tons of copper ore lie below the open pit. Underground mining began operations in 2019. |
Mining | |||||||||||||||||||||||||||||||
| Mining Expansion in Western Australia | Image of the Week | coal, land conversion | ||||||||||||||||||||||||||||||||||
| Mining Operations | Earthshots | bitumen, boreal forest, oil, oil sands, open pits, overburden, tailings ponds | Getting oil from oil sands is fairly straight-… |
Getting oil from oil sands is fairly straight-forward. But that doesn’t mean it’s easy. In the Athabasca region near Fort McMurray, the oil sands are less than 75 meters (246 feet) from the surface, close enough for surface mining. Surface mining techniques require the forest to be cleared. The soil and rock above the oil sand (overburden in mining jargon) is then removed. This creates the maroon or gray irregularly shaped open pit mines seen in the Landsat images. The open pits are created in a series of benches, or steps, that are 12–15 meters (39–49 feet) high. Huge hydraulic power shovels dig the oil sand and drop it into trucks that have a capacity of up to 363 metric tons (400 tons). The trucks haul the oil sand to a facility that separates the oil and sand. The oil sand mixes with hot water to form a slurry. In this slurry, the sand settles to the bottom, clay and water sit in the middle, and the bitumen floats on the top. The bitumen is skimmed off the surface and the rest gets pumped to tailings ponds, also visible as the large blue shapes in Landsat images, often outlined in tan. The August 24, 2022, image is from Europe's Copernicus Sentinel-2 satellite. The resolution of the bands used in this image is 20 meters, compared to Landsat’s 30 meters. |
Forests, Mining, Natural-Disasters | |||||||||||||||||||||||||||||||
| Mining Operations | Earthshots | coal, groundwater, mountaintop removal, overburden, reclamation, valleys | Appalachian coal lies underground in thin… |
Appalachian coal lies underground in thin seams, too thin for underground mine shafts. The only way to extract the coal profitably is with surface mining. Surface mining involves the removal of soil and rock (overburden in mining terminology) with explosives and heavy machinery to get at the coal. As much as 200–300 meters of overburden is removed. The removed material, also called mine spoils, is used to reconstruct the area after mining operations are done. The removed material takes up more volume and cannot simply be replaced (try digging a hole in your backyard and filling it back in and you’ll discover how this works). The “excess spoils” must be dumped elsewhere. In Appalachian mountaintop mining, the excess is deposited into valleys. These valley fills are usually located next to—often downstream from—surface mines, burying headwater streams completely. The groundwater and surface waters from the mine often flow through these valley fills before discharging into streams. Disturbed land is pink in these close-up images of a large mine about 20 miles southwest of Charleston, West Virginia. The natural color image from Sentinel-2 shows more detail in the same area. Active mining is bright in this Sentinel-2 image, and lighter green shades show some reclaimed land. |
Mining, Mountains | |||||||||||||||||||||||||||||||
| Minnesota | Shaded Relief | Shaded Relief Images of specific areas (generally… | Shaded Relief Images of specific areas (generally by state) have been selected from the National Elevation Dataset. For original data details, see NED. |
|||||||||||||||||||||||||||||||||
| Minnesota | State Mosaics | Minnesota has more shoreline than California,… | Minnesota has more shoreline than California, Florida, and Hawaii combined. It is sometimes called the “Land of 10,000 Lakes,” but it actually has 12,000 lakes, three-fourths of which are four hectares (10 acres) or more in size. |
|||||||||||||||||||||||||||||||||
| Minnesota Lakes with Leif Olmanson | Video - Landsat | |||||||||||||||||||||||||||||||||||
| Mirani Dam | Image of the Week | flooding, hydropower, irrigation, reservoirs, rivers, water use | ||||||||||||||||||||||||||||||||||
| Missing Mangroves | Earthshots | mangrove | Scientists have been tracking the distribution… |
Scientists have been tracking the distribution of the mangrove forests in the Ayeyarwady Delta using satellite observations dating back to the 1970s. The change map shows when and where mangrove loss occurred. Green indicates current mangrove forest as of 2005. However, red dominates the map, which means that much of the mangrove loss occurred during the 1990s.
|
Coasts, Deforestation, Forests | |||||||||||||||||||||||||||||||
| Mississippi | Shaded Relief | Shaded Relief Images of specific areas (generally… | Shaded Relief Images of specific areas (generally by state) have been selected from the National Elevation Dataset. For original data details, see NED. |
|||||||||||||||||||||||||||||||||
| Mississippi | State Mosaics | Hernando DeSoto, a Spanish explorer, discovered… | Hernando DeSoto, a Spanish explorer, discovered the Mississippi River in 1540. It is the largest river in the United States and is the country’s chief waterway. Its nickname is “Old Man River.” |
|||||||||||||||||||||||||||||||||
| Mississippi River Delta | Earth As Art | deltas, marshes, rivers, sediment | Turbid waters spill out into the Gulf of… | Turbid waters spill out into the Gulf of Mexico where their suspended sediment is deposited to form the Mississippi River Delta. Like the webbing on a duck's foot, marshes and mudflats prevail between the shipping channels that have been cut into the delta. |
||||||||||||||||||||||||||||||||
| Mississippi River Flooding Subsiding | Image of the Week | flooding, rain, rivers | ||||||||||||||||||||||||||||||||||
| Mississippi River Flooding: 2019 vs. 2020 | Image Comparison Sliders | flooding, rivers | ||||||||||||||||||||||||||||||||||
| Mississippi River Floods Deep South | Image of the Week | flooding, rain, rivers, storms, weather | Late winter storms March 10–12, 2016, drenched… | Late winter storms March 10–12, 2016, drenched areas of Louisiana, eastern Texas, Mississippi, and Arkansas with up to 20 inches of rain, causing significant damage and evacuations. Louisiana officials say the resulting flooding there is among the most widespread for any non-hurricane event ever seen. These images acquired by Landsat 8 clearly capture the scope of that historical inundation. Though earlier storms in January had already pushed the Lower Mississippi River toward the top of its banks, the meandering waterway appears largely contained in the image on the left, acquired March 4, 2016. Sixteen days later, however, the satellite’s sensors reveal something much more dramatic. |
||||||||||||||||||||||||||||||||
| Mississippi River Level Dropping | Image of the Week | drought, lakes, rivers | ||||||||||||||||||||||||||||||||||
| Missouri | Shaded Relief | Shaded Relief Images of specific areas (generally… | Shaded Relief Images of specific areas (generally by state) have been selected from the National Elevation Dataset. For original data details, see NED. |
|||||||||||||||||||||||||||||||||
| Missouri | State Mosaics | The largest earthquake ever recorded in the… | The largest earthquake ever recorded in the continental United States occurred near New Madrid, Missouri, in 1812. The quake shook more than one million square miles and was felt as far as 1,000 miles away. |
|||||||||||||||||||||||||||||||||
| Missouri River flooding near Hamburg, Iowa | Image of the Week | flooding, rain, rivers, weather | ||||||||||||||||||||||||||||||||||
| Missouri River near Omaha, NE - one year after flooding | Image of the Week | flooding, rain, reservoirs, rivers, weather | ||||||||||||||||||||||||||||||||||
| MODIS Land Surface Temperature - 1 | Video - LP DAAC | |||||||||||||||||||||||||||||||||||
| MODIS Land Surface Temperature - 2 | Video - LP DAAC | |||||||||||||||||||||||||||||||||||
| MODIS Land Surface Temperature - 3 | Video - LP DAAC | |||||||||||||||||||||||||||||||||||
| MODIS Surface Reflectance - 1 | Video - LP DAAC | |||||||||||||||||||||||||||||||||||
| MODIS Surface Reflectance - 2 | Video - LP DAAC | |||||||||||||||||||||||||||||||||||
| MODIS Surface Reflectance - 3 | Video - LP DAAC | |||||||||||||||||||||||||||||||||||
| MODIS Thermal Anomalies and Fire - 1 | Video - LP DAAC | |||||||||||||||||||||||||||||||||||
| MODIS Thermal Anomalies and Fire - 2 | Video - LP DAAC | |||||||||||||||||||||||||||||||||||
| MODIS Thermal Anomalies and Fire - 3 | Video - LP DAAC | |||||||||||||||||||||||||||||||||||
| MODIS Vegetation Indices - 1 | Video - LP DAAC | |||||||||||||||||||||||||||||||||||
| MODIS Vegetation Indices - 2 | Video - LP DAAC | |||||||||||||||||||||||||||||||||||
| MODIS Vegetation Indices - 3 | Video - LP DAAC | |||||||||||||||||||||||||||||||||||
| Mohale Dam | Earthshots | hydropower, lakes, reservoirs, rivers | Unlike the Katse Dam, the … |
Unlike the Katse Dam, the Mohale Dam does not generate power. Instead, it was built as a backup reserve to the Katse Dam and reservoir. The dam was built on the Senqunyane River, another tributary of the Senqu/Orange River. The Mohale reservoir began filling by the time of the 2003 image. The Mohale Dam is 145 meters high and 620 meters long. It is the highest concrete-faced rock-filled dam in Africa. A large basalt hill inside the basin had to be crushed to build the rock wall. The dam then formed the 21.2-square-kilometer Mohale reservoir. A 32-kilometer tunnel brings water from the Mohale reservoir to the Katse reservoir. Before these two dams were constructed, Lesotho had to depend on South Africa. The country has now attained self-sufficiency in electric power generation. Future phases of the LHWP include construction of more dams, tunnels, and hydropower stations. |
Dams, Water | |||||||||||||||||||||||||||||||
| Monarch Butterflies, Mexico | Earthshots | migration, milkweed, monarch butterflies, NDVI, oyamel | The patches of red in these false-color… |
The patches of red in these false-color Landsat images are the forests where monarch butterflies spend the winter. Starting in late summer and fall, monarchs in the United States and Canada migrate south to Mexico. Some travel up to 3,000 miles. The delicate insects are capable of flying 50–100 miles a day. Cold weather drives the monarchs to head south to hibernate for the winter. They head for the only habitat suitable for their hibernation, oyamel fir (Abies religiosa) forests. These forests grow in only small areas of mountain tops in central Mexico, about 3,000 m above sea level. The monarchs usually cover whole trees as they keep each other warm. The short needles of the oyamel fir allow the butterflies to cluster together better than they could on flat-needled cedars or long-needled pines. The oyamel forests provide a microclimate for the butterflies. Temperatures stay above freezing. If the temperatures were lower, the monarchs would have to use their fat reserves. The humidity provided by the forest also keeps them from drying out. The monarchs stay in Mexico from about November to March. In the spring, they fly back north. On the way, they lay eggs on milkweed. These eggs hatch into caterpillars, who devour the milkweed leaves, then metamorphose into monarchs. These monarchs live about 5 weeks or so. What’s especially amazing about the monarch migration is that not all monarchs take part in the journey. And unlike birds and whales, the monarchs that do complete the migration only make one round trip. The great-grandchildren of the overwintering monarchs migrate south the next fall, somehow landing at the same trees as their ancestors. Without the use of maps or satellite imagery! |
Forests, Wildlife | |||||||||||||||||||||||||||||||
| Monarch Value | Earthshots | migration, milkweed, monarch butterflies | The good news about the monarchs is that they… |
The good news about the monarchs is that they are a beloved bug. Kids in classrooms nationwide capture the caterpillars and watch them transform into a chrysalis and eventually a monarch, learning all about life cycles along the way. Increases in the area occupied at the overwintering sites are encouraging, but researchers continue to keep an eye on breeding habitats—milkweed restoration from Texas to Minnesota is key. A recent study indicates that people would be willing to donate or buy nectar plants and milkweed to help preserve the monarchs’ habitat in their non-wintering locations. The willingness of Americans to buy nectar plants and milkweed could potentially be a multimillion dollar industry. Diffendorfer and others (2014) estimated that Americans are collectively willing to pay $933 million for nectar plants and $473 million for milkweed. That seems like a good start for the monarchs on their long journeys. |
Forests, Wildlife | |||||||||||||||||||||||||||||||
| Monitoring Canada's Forest | Video - Landsat | |||||||||||||||||||||||||||||||||||
| Monitoring Crop Land with Martha Anderson | Video - Landsat | |||||||||||||||||||||||||||||||||||
| Monitoring Deforestation in the Amazon | Image of the Week | oil palm, rain forest | Large areas within the Amazon rain forest have… | Large areas within the Amazon rain forest have undergone large-scale deforestation over the past few decades, and Landsat has helped record this widespread land change. However, in locations such as the Peruvian Amazon, the majority of deforestation is caused in recent years by small-scale agriculture, according to reports by the Monitoring of the Andean Amazon Project. The Amazon rain forest is lush green in these images about 25 miles northwest of Pucallpa along the Aguaytia River. Deforested land is light green or pink. Two large-scale oil palm plantations, which began development in 2012, dominate the 2016 Landsat image. But also noticeable are pink areas scattered throughout this image. These small- to medium-scale cleared spots are also likely oil palm fields and land cleared for cattle grazing. Landsat data provide enough detail to detect deforestation and tell whether it’s large- or small-scale agriculture, road construction, or pasture land. Monitoring where deforestation is occurring nearly as it happens can help control protected natural areas. |
||||||||||||||||||||||||||||||||
| Monitoring Polar Ice Caps | Video - Landsat | |||||||||||||||||||||||||||||||||||
| Monitoring the Everglades | Image of the Week | land conversion, mangroves, urban growth, water use | ||||||||||||||||||||||||||||||||||
| Monomoy Island(s) | Earthshots | barrier islands, erosion, islands, sediment, storm surge, storms, tide, weather | Monomoy is the southernmost barrier island in… |
Monomoy is the southernmost barrier island in this system. It once consisted of North Monomoy Island and South Monomoy Island. Storms, high winds, tide, and surf endlessly change the island. The Landsat imagery shows South Beach Island migrating southward to join Monomoy, which is now considered one island. All of Monomoy Island (North and South) are designated as Monomoy National Wildlife Refuge. In the years since European settlers began making coastline maps, the changes to all of these islands and beaches have been observed in fairly predictable patterns. The dilemma now, with an increasing population, is to monitor how storms, flooding, and shoreline erosion affect property and both human and wildlife populations. Play this animation to see the change in this area from 1984 to 2018. |
Coasts, Water | |||||||||||||||||||||||||||||||
| Montana | Shaded Relief | Shaded Relief Images of specific areas (generally… | Shaded Relief Images of specific areas (generally by state) have been selected from the National Elevation Dataset. For original data details, see NED. |
|||||||||||||||||||||||||||||||||
| Montana | State Mosaics | With a total area of 147,040 square miles,… | With a total area of 147,040 square miles, Montana is the fourth largest state in the country. But it has the forty-fourth largest population. Montana has an average population density of seven people per square mile. |
|||||||||||||||||||||||||||||||||
| Monthly MODIS Land Surface Temperature | Video - LP DAAC | |||||||||||||||||||||||||||||||||||
| Moody Carvings | Earth As Art | craters, rivers, volcanoes | These orange shades and ragged shapes give an… | These orange shades and ragged shapes give an impression of moodiness. The jagged scars are extensive valleys carved by water flowing from the Andes Mountains in northern Chile. The crater in the lower right is the volcano Cerro Guachiscota. |
||||||||||||||||||||||||||||||||
| Moon Craters in Arizona? | Image of the Week | aerial photos, craters | Before landing on the surface of the moon in 1969… | Before landing on the surface of the moon in 1969, astronauts Neil Armstrong and Buzz Aldrin needed a training ground that matched their destination’s cratered surface. In the U.S., that turned out to be northern Arizona. Starting in 1967, the U.S. Geological Survey used hundreds of pounds dynamite to blast holes into the surface of ancient lava fields south of Sunset Crater, near Flagstaff. The first Cinder Lake crater field was designed to mimic the Sea of Tranquility, the lunar surface on which the astronauts would land. The craters in this 1968 image have eroded in the decades since then, but their outlines are still visible in 2017. A second crater field was created in July of 1968. Its 380 craters have also lost contours to time, but the pockmarks are still apparent in aerial shots of the area, which is now used by off-road vehicles. Apollo astronauts would continue to train in the Flagstaff area for years after the first moon landing. |
||||||||||||||||||||||||||||||||
| Mopti | Earthshots | floodplain, floods, river | The busy port city Mopti is located at the… |
The busy port city Mopti is located at the confluence of the Niger and Bani Rivers. It is a crossroads of trade between the north and south. Farming in this region relies on rainfed cereal crops. This makes farmers vulnerable to weather-related risks. They experience only one good harvest out of every three rainy seasons. To help residents plan for high or low water flood seasons, scientists are working on a greater understanding of the hydrology of the delta. The Niger and Bani Rivers determine the flood extent each year. The water level in Akka, toward the northern part of the delta, can be reliably predicted from the combined flow of these rivers. Flood forecasts will become increasingly important as the population grows and as pressure on water resources increases. Water level measurements and satellite images help predict the onset of seasonal floods and help achieve food security. An early warning system will help predict drought and monitor food security. Data from both on the ground and satellites help manage water resources. |
Water, Wetlands | |||||||||||||||||||||||||||||||
| More about This Flood | Earthshots | flooding, rain, rivers, weather | The flooding that happened in summer 2008 in… |
The flooding that happened in summer 2008 in Indiana and Illinois started late in 2007 with above normal snowfall. This extra snow saturated the ground as it melted in spring 2008. The above normal rainfall in the spring only made the situation worse. (Many U.S. Geological Survey streamgages in the region already showed stream levels at higher than average streamflow.) The heavy rainfall event on June 6–7, while by itself might not have caused catastrophic flooding, combined with the saturated conditions from the previous winter snows to cause this flood. On June 6, 2008, a nearly stationary (unmoving) weather front was draped across south-central Indiana, and moisture from the Gulf of Mexico streamed north to fuel thunderstorm development. Nearly continuous thunderstorms over a 12–16 hour interval dumped significant amounts of rain on the region. This rain flowed into the already high rivers and streams, which rose quickly. In the precipitation map on the left, the colors indicate the amount of rainfall for the first half of June 2008. The colorful area from eastern Illinois and into central Indiana reflects the heavy rain that occurred there at that time.
|
Natural-Disasters, Water | |||||||||||||||||||||||||||||||
| More Breaking News in Antarctica | Image Comparison Sliders | ice, ice shelf, icebergs, rifts | ||||||||||||||||||||||||||||||||||
| More Details | Earthshots | Inner City, Olympics, stadium, urban growth | Within the Inner City, the moats and walls of… |
Within the Inner City, the moats and walls of the Forbidden City (Imperial Palace Museum) are prominent, with Wu Gate at the southern end. Also within the Inner City are six lakes, including Zhong Hai Lake just west of the Forbidden City. In the Outer City three parks are visible, of which the middle is the Temple of Heaven. These are the red areas (darker than the agricultural vegetation outside of the city). In the out zoom, Kunming Hu Lake is visible on the northwest edge of the city. The historically significant Summer Palace is on the shore of this lake. In the north-central part of the 2013 image, a few bright spots appear that aren't in the other images. This is the Olympic complex that was built for the 2008 Summer Olympic Games, and includes the Olympic stadium, which came to be known as the Bird's Nest. An image from 1967 was acquired by the U.S. Gambit high-resolution space reconnaissance program. Part of a large collection of imagery declassified in the 1990s, the Gambit image shows fine detail, 2-4-foot resolution, of the Inner City area. |
Cities | |||||||||||||||||||||||||||||||
| More Information | Earthshots | The surface of the Earth is always changing.… |
The surface of the Earth is always changing. Some changes like earthquakes, volcanoes, floods, and landslides happen quickly and other changes, such as most erosional processes, happen slowly over time. It’s often hard to see these changes from ground level. A much broader view is needed, and multiple views that provide a record of change over time are especially helpful. Earthshots shows you how satellite data are used to track these changes. The Landsat series of Earth-observing satellites has acquired data for monitoring the planet’s landmasses since 1972. The vast archive containing millions of Landsat scenes is managed at the U.S. Geological Survey (USGS) Earth Resources Observation and Science (EROS) Center in Sioux Falls, SD. The images displayed in Earthshots are examples of Landsat data that help scientists worldwide understand more about how both people and nature are changing the landscape. Each Earthshots page features a different location from around the world and explains the changes that the satellite images reveal. For example, the Mount St. Helens page shows what the mountain looked like before and after the 1980 eruption. Furthermore, it shows recent images that demonstrate how the forest is recovering. The images at the left are three of the Landsat images from that page. |
Agriculture, Aquaculture, Cities, Coasts, Dams, Deforestation, Deserts, Energy, Fires, Forests, Glaciers, Mining, Mountains, Natural-Disasters, Water, Wetlands, Wildlife | ||||||||||||||||||||||||||||||||
| More Selkirk Cloudscapes | Earthshots | clouds, islands, Karman vortex street | Since its launch in 1999, Landsat 7 has not… |
Since its launch in 1999, Landsat 7 has not again seen such nice vortices over Selkirk Island. A single vortex formed on March 25, 2000, from a similar southerly wind, but then the pattern broke up. That morning the clouds were too unstable, as shown by the turbulent convection cells in the northeast. In its first year of acquiring images, the whole island was never visible to Landsat 7. Even on a clear day like November 18, 1999, the island's heat and elevation heave up damp marine air into the cold, until it reaches its dew point and condenses into a kind of permanent parasol of clouds. This sometimes trails downwind a short distance on windy days, as on February 22, 2000. On November 10, 2008, the island looked a bit more like an icebreaker ship plowing through ice pack; no vortex street this time, but the effect the tall mountain island has on the clouds is clearly demonstrated. The February 14, 2009, image almost displays a vortex, but it didn’t quite form completely. |
Coasts, Water | |||||||||||||||||||||||||||||||
| Mount Carmel Fire | Image Comparison Sliders | burn scars | ||||||||||||||||||||||||||||||||||
| Mount Elgon | Earth As Art | calderas, volcanoes | Clouds encircle the lofty rim of Africa's Mount… | Clouds encircle the lofty rim of Africa's Mount Elgon, a huge, long-extinct volcano on the border between Uganda and Kenya. The solitary volcano has one of the world's largest intact calderas, a cauldron-like central depression. The caldera is about 6.5 kilometers (4 miles) across and formed following an eruption, when the emptied magma chamber collapsed under the weight of volcanic rock above it. |
||||||||||||||||||||||||||||||||
| Mount Kilimanjaro, Tanzania | Earthshots | ice, snow, volcanoes | These images show the famous “snows of… |
These images show the famous “snows of Kilimanjaro” in 1976, 2000, 2010, 2013, and 2019. Mount Kilimanjaro, almost 20,000 feet above sea level, is the highest peak in Africa. Though only about 200 miles from the equator, it has been capped by glaciers and snow for 11,000 years. This white cap shrinks and grows almost daily, but over the last century or more, its overall trend has been a steady decline. These images show durable, hard-ice glaciers, as well as the ephemeral snow on and around them. Scientists have focused on the glaciers, trying to understand why they are shrinking, how long they may last, and what they can teach us about the atmosphere today and the Earth long ago. In these false-color images, vegetation appears green, drylands a brownish tan, and glaciers and snow cyan. |
Glaciers, Mountains | |||||||||||||||||||||||||||||||
| Mount Nyiragongo Eruption Activity Captured by Terra ASTER | Video - LP DAAC | |||||||||||||||||||||||||||||||||||
| Mount Pinatubo, Philippines | Earthshots | ash, caldera, eruption, lahar, lakes, mud, mudflows, pyroclastic flows, rain, rivers, runoff, sediment, typhoon, urban growth, volcanoes, weather | Mount Pinatubo had likely been dormant for… |
Mount Pinatubo had likely been dormant for hundreds of years. There had been no historical records of volcanic eruptions. Local residents in this part of the Philippines hardly believed Pinatubo was a volcano, so it was difficult to convince them to evacuate once it began showing signs of an eruption throughout the spring of 1991. When it did erupt explosively on June 15, 1991, it was one of the largest volcanic eruptions of the 20th century. The ash cloud rose 40 kilometers high, and volcanic ash blanketed the region. Making the disaster worse was the arrival of Typhoon Yunya, which hit on the same day. The heavy rains from the storm sent flows of mud and volcanic debris rushing down the mountainside in all directions. Rice and sugarcane fields were smothered. Rooftops collapsed from the weight of ash saturated with rain. Nearly all bridges within 29 kilometers of the mountain were destroyed. Today, the mountain is relatively quiet, and about 300 meters shorter than it was before the eruption. Landsat’s historical record reveals the changes and regrowth as it happens, something that can’t be witnessed from the ground. Furthermore, images from the Advanced Spaceborne Thermal Emission and Reflection Radiometer (ASTER) sensor on NASA’s Terra satellite add more information about the changes to the mountain and surrounding region. Data from these satellites can help us analyze a larger area in a much shorter amount of time than ground surveys, providing valuable information for local decision making.
|
Mountains, Natural-Disasters | |||||||||||||||||||||||||||||||
| Mount Pinatubo, Philippines, Erupted 26 Years Ago | Image of the Week | eruption, lahars, volcanoes | Mount Pinatubo had likely been dormant for… | Mount Pinatubo had likely been dormant for hundreds of years. Local residents on the northern island of Luzon within the Philippines hardly believed Pinatubo was a volcano, making it difficult to convince them to evacuate once it began showing signs of an eruption throughout the spring of 1991. When it did erupt explosively on June 15, 1991, it was one of the largest volcanic eruptions of the 20th century. Today the mountain is relatively quiet, and about 300 meters shorter than it was before the eruption. This Landsat image pair shows the mountain several months after the eruption and more recently in 2017. The additional green near the summit indicates forest regrowth, but scars from fast-moving floods of volcanic ash and water are visible as pink stretches streaming away from the mountain. Called lahars, these floods affected more people than the eruption itself. Twenty-six years after the eruption, lahar hazards continue. Landsat helps scientists monitor changes caused by these hazards, and how the changes to the land affect the population. Landsat can show these changes in a way that can’t be witnessed from the ground. Landsat data also allow scientists to analyze a larger area in a much shorter amount of time than ground surveys, providing valuable information for local decision making. |
||||||||||||||||||||||||||||||||
| Mount Rushmore | Earthshots | insect infestation, mountain pine beetle, ponderosa pine | Another set of close-up images shows the area… |
Another set of close-up images shows the area around Mount Rushmore National Memorial. The same pattern is apparent here—a decrease in green forest cover surrounding this popular tourist attraction. Landsat is well suited to studying tree mortality over large areas. The Landsat record covers a long time period. Its infrared wavelengths help make forest disturbance events easier to detect. In most regions of the United States, Landsat provides several clear images per year, which can be useful for tracking the spread of the infestation. Best of all, Landsat data is freely available. Monitoring a large-scale epidemic like this one is aided by the comprehensive coverage of Landsat imagery. Because field plots are expensive to implement over large areas, Landsat provides forest managers an affordable way to pinpoint where to break up stands of infested trees to try to minimize the spread and reduce fire risk. The dense historical record that Landsat provides is also important because in some areas, other disturbances such as fire can obscure evidence of past disturbances. For example, the upper right of the 2002 image shows a maroon burn scar from a recent wildfire. Landsat enables scientists to better study the historical interaction between pine beetles and other types of disturbances which occur in complex landscapes. |
Forests, Mountains, Wildlife | |||||||||||||||||||||||||||||||
| Mount Sakurajima Volcano Erupts | Image of the Week | ash, eruption, islands, thermal, volcanoes | ||||||||||||||||||||||||||||||||||
| Mount St. Helens | Earthshots | ash, eruption, lakes, logging, mudslides, rivers, volcanoes | These images show the area around Mount St.… |
These images show the area around Mount St. Helens, in southwestern Washington, before and after its eruption of May 18, 1980. In these false-color images, forest appears as bright red interspersed with patches of logging. Snow appears white, and ash is gray. The cities of Vancouver, Washington, and Portland, Oregon, are visible in the southwest of the zoomed-out images, north and south of the Columbia River, respectively. |
Forests, Mountains, Natural-Disasters | |||||||||||||||||||||||||||||||
| Mount St. Helens | Image of the Week | ash, eruption, volcanoes | ||||||||||||||||||||||||||||||||||
| Mount Taranaki | Earth As Art | national parks, snow | A nearly perfect circle of forest delineates the… | A nearly perfect circle of forest delineates the boundary of Egmont National Park in New Zealand. Snow-capped Mount Taranaki marks the center of the park, which is surrounded by green farmland. |
||||||||||||||||||||||||||||||||
| Mountaintop Mining, West Virginia, USA | Earthshots | coal, groundwater, hydrology, mountaintop removal, overburden, reclamation, valleys | Mountaintop coal mining is a major cause of… |
Mountaintop coal mining is a major cause of land cover changes in the central Appalachian Mountains of the eastern United States. The landscape disturbance mountaintop mining causes is different from others (such as forestry, urbanization, or agriculture) in that it can extend deeply into the ground, disturbing even the bedrock. Landsat imagery from the 1970s has catalogued the changes. These false color images show the natural landscape of the area: forested mountains are bright green, and numerous streams and valleys give the land a wrinkled appearance. Mining areas are pink, and reclaimed mining land is usually light green. The reason for the large-scale change caused by this type of mining is that one ton of coal is extracted for every 16 tons of terrain displaced. In the mountainous Appalachian landscape, the displaced material ends up in river valleys. More than just the look of the landscape changes—the drainage network itself is altered. First mined in the 19th century, low-sulfur Appalachian coal can be extracted relatively cost-effectively by the mountaintop removal process. This method allows almost all of the coal in a seam to be removed. Understanding the hydrologic changes brought on by this mining practice is key to the future of the communities in the region. |
Mining, Mountains | |||||||||||||||||||||||||||||||
| Moving a Town | Earthshots | copper, open pit, ore, population, tailings, waste | The town of Chuquicamata was established as a… |
The town of Chuquicamata was established as a mining camp when mining operations opened. After much mining and open pit expansion, the town ended up being too close to the mining operations. Dust from the mine and gases from the nearby smelting plant caused the mining company to relocate the entire town. Besides the health and safety concerns, the company was running out of convenient places to pile up mine waste. To extract 1 kilogram of copper, 100 kilograms of rock has to be removed from the ground. That waste material has to go somewhere. So now, the site of the former town is beginning to be buried in mine waste. Most of the town has not yet been buried and stands as a ghost town. Residents were moved to Calama, a city about 15 kilometers away. Codelco, the government company that owns the mine, built over 5,000 homes—one for each family. Residents began moving in 2004, and by September 2007, Chuquicamata was officially abandoned. The Landsat images show the location of the former town and the piles of mine waste encroaching on its north side. An image from Europe's Copernicus Sentinel-2 satellite zooms in closer with finer resolution to show the location of the town in more detail. |
Mining | |||||||||||||||||||||||||||||||
| Mt. Ararat | Earthshots | ice, resolution, sensors, snow | Despite its problems, RBV data has been used… |
Despite its problems, RBV data has been used in land change studies. RBV data was used in a recent scientific study of glaciers in Turkey. Scientists used RBV images from 1980 (along with dozens of other Landsat images and high-resolution commercial satellite images) to document the areal extent of all glaciers in that country. The researchers noted that RBV’s higher resolution was an excellent source for glacier studies. The glacier covering the top of Mount Ararat is Turkey’s largest glacier. Based on data from the RBV and more recent Landsat sensors, the glacier area of Ararat diminished from 8.9 square kilometers in 1977 to 5.6 square kilometers in 2008, according to the study. Most loss took place on the southern, western, and eastern sides of the mountain. Even though RBV had an impressive spatial resolution, the near-infrared and shortwave infrared imaging capability on current Landsats defines the extent of ice more clearly than RBV could. The depth of the Landsat archive across the history of Landsat sensors made this study possible. It’s important to continue to monitor these glaciers and gauge the effects of these changes, and RBV turned out to be an excellent source where data did not already exist.
|
Glaciers, Mountains | |||||||||||||||||||||||||||||||
| Mt. Etna | Earth As Art | lava, lava flows, smoke, volcanoes | Located on the Italian island of Sicily, Mt. Etna… | Located on the Italian island of Sicily, Mt. Etna is one of the world's most active volcanoes. In this image of the volcano in 2001, a plume of steam and smoke rising from the crater drifts over some of the many dark lava flows that cover its slopes. |
||||||||||||||||||||||||||||||||
| Mt. Redoubt, Alaska Ash Plume | Image of the Week | ash, lahars, volcanoes | ||||||||||||||||||||||||||||||||||
| Mudslide Cuts Through Big Sur Burn Scar | Image of the Week | burn scar, highway, landslides, mudslides, rain, weather | A mudslide near the 2020 Dolan Fire's ignition… | A mudslide near the 2020 Dolan Fire's ignition point chopped through a chunk of California's scenic State Highway 1 in late January. The Dolan Fire began near Big Sur on August 18th, 2020. It scarred nearly 125,000 acres before being fully contained in December. The damage is clear in false color Landsat 8 imagery from August and October. The scar is still visible in a Sentinel-2 image from January. Sixteen inches of rain soaked the northern edge of the fire scar late that month, sending a rush of debris from Rat Creek across the Pacific Coast Highway, and carrying more than 100 feet of roadway into the sea. Switching to natural color puts the damage into clearer focus. An even more significant event took place four years earlier just 24 miles to the south. The Mud Creek landslide dumped 6 million cubic yards of debris, burying a quarter mile of State Highway 1. |
||||||||||||||||||||||||||||||||
| Mulanje Massif | Earth As Art | erosion, lakes, rock | In southern Malawi, the erosion-resistant rock of… | In southern Malawi, the erosion-resistant rock of Mulanje Massif, a large mountain mass, rises dramatically above the landscape near Lake Chilwa, a shallow, saline lake. The upper slopes of the massif are protected forest. The deep green color south of the massif is tea and macadamia farms. |
||||||||||||||||||||||||||||||||
| Multiple Storms along the Vietnam Coastline | Image of the Week | flooding, rain, rivers, sediment, storms, typhoons, weather | In July 2014, rains from Typhoon Rammasun… | In July 2014, rains from Typhoon Rammasun triggered heavy flooding as it made landfall in northern Vietnam. Only two months later, Typhoon Kalmaegi made landfall along the same section of coast. While the rainfall was not as strong as it was from Rammasun, rivers were still swollen from the previous storm. |
||||||||||||||||||||||||||||||||
| Mundra Port | Image of the Week | ports, shipping | ||||||||||||||||||||||||||||||||||
| Muskingum Mines, Ohio, USA | Earthshots | coal, reclamation, strip mining | These images show shifting strip mines in… |
These images show shifting strip mines in eastern Ohio, from 1973 to 2022. In these images, the mines appear as bright spots against the green forest background in the southern part of the images. The Muskingum mines were started in the 1950s in Muskingum County, Ohio, and are now operated by the American Electric Power Company. The bed of coal being mined, known as the Meigs Creek coal, is about 60 inches thick, of intermediate grade, and is part of the Monongahela geologic group, deposited about 300 million years ago. At that time, central Ohio was covered by a shallow inland sea, with a floor of limestone and sandstone. Then, to the east, the Appalachian Mountains slowly pushed upward. Streams flowed off the mountains into this inland sea, dropping sediment and creating deltas along the coast in what is now eastern Ohio. Swamps grew on these deltas, and conditions were just right for the dying plants to form layers of peat. Over the years this peat was buried by more sediment (the sandstone and shale we now see covering the coal), transforming the peat into coal through heat and pressure. |
Forests, Mining | |||||||||||||||||||||||||||||||
| Mustang Complex Fire | Image of the Week | burn scars | ||||||||||||||||||||||||||||||||||
| Myrtle Beach, SC Fire | Image of the Week | burn scars | ||||||||||||||||||||||||||||||||||
| Namaqualand | Earth As Art | national parks | Namaqualand in South Africa is known as the "gem… | Namaqualand in South Africa is known as the "gem of the Northern Cape." Portions of this area were turned into a national park in 1999, to preserve the abundant wildlife and brilliant wildflowers native to the area. |
||||||||||||||||||||||||||||||||
| Namib Desert | Earth As Art | sand dunes | Namib-Naukluft National Park is an ecological… | Namib-Naukluft National Park is an ecological preserve in Namibia's vast Namib Desert. Coastal winds create the tallest sand dunes in the world here, with some dunes reaching 980 feet (300 meters) in height. |
||||||||||||||||||||||||||||||||
| Nanhui New City | Earthshots | aritificial islands, bridge, megacity, population, shipping ports, urban growth | Southeast of Shanghai is an area of major land… |
Southeast of Shanghai is an area of major land change where a planned city is being built. Nanhui New City covers about 74 square kilometers and is intended to provide space for 800,000 people. It was formerly called Lingang New City and was renamed in April 2012. The main feature of the new city is a circular artificial lake, visible in this series of images starting in 2004. Dishui Lake is 2.5 kilometers across and includes three artificial islands. The concentric structure of the city resembles a compass rose. The streets radiate out from the center. Waterways extend all over the city to support its theme of “waterside living.” Off the coast is Yangshan Deep-Water Port, one of the largest shipping ports in the world. The huge port opened in 2005 and can handle the world’s largest container vessels. More than half of Yangshan Port was built on reclaimed land. The port connects to Nanhui New City by the Donghai Bridge. Construction of the bridge is visible in the 2004 image. It opened to general traffic in 2005. The 32.5-kilometer-long bridge carries six lanes of traffic and is one of the longest bridges in the world. |
Cities, Coasts | |||||||||||||||||||||||||||||||
| Natural Holes | Earthshots | karst, lakes, limestone, sinkholes | As rain falls through the sky it absorbs… |
As rain falls through the sky it absorbs carbon dioxide, making it slightly acidic. All stone is subject to this acid, but limestone dissolves especially rapidly, and its cracked, fractured structure lets the water seep down through it. Over many years, elaborate networks of tunnels and caves form underground, often with a honeycomb of vertical “pipes” that drain the area underground, rather than through ordinary streams and rivers draining laterally to the ocean. Karstic areas have few streams. Other features of a karstic landscape are artesian springs, underground rivers, natural bridges, caves, quicksand, and especially sinkholes. A sinkhole forms when the roof of an underground cave collapses and the rock and soil above it drop down to fill the void. Sinkholes occasionally make the news by swallowing buildings, roads, and trucks. Since water often lies just below the ground in Florida, these sinkholes often fill with water. This is why these Landsat images show so many lakes; Florida has over 7,000 lakes larger than 10 acres and many more smaller than that. Sometimes part of a lake floor will collapse—a sinkhole under a sinkhole—and the lake will drain down into the aquifer, like pulling the plug in a bathtub. You can see some good examples of karstic lakes in these images. They often have a round shape, steep sides, and no streams leading in or out. Disney World and Epcot are labeled in these images. Epcot, located southeast of Disney World, is missing in the 1973 image and partly completed in 1986. The expansion of Epcot can be seen throughout the rest of the series of images, along with the growth of residential areas southwest of Orlando. |
Cities, Mining | |||||||||||||||||||||||||||||||
| Nature’s Patterns | Earth As Art | mangrove, mudflats, rivers, sediment | The biologically complex conditions of mangroves… | The biologically complex conditions of mangroves are shown in dark green along the fingers of the Ord River in Australia. Yellow, orange, and blue represent the impressive flow patterns of sediment and nutrients in this tropical estuary. The bright spot at the lower left is an area of mudflats, which is home to saltwater crocodiles. |
||||||||||||||||||||||||||||||||
| Navigating the New LP DAAC Website: Searching for Data | Video - LP DAAC | |||||||||||||||||||||||||||||||||||
| NDVI | Earthshots | migration, monarch butterflies, NDVI, oyamel | Subtle changes in vegetation are sometimes… |
Subtle changes in vegetation are sometimes difficult for us to see when just looking at the imagery. The Normalized Difference Vegetation Index (NDVI) uses the difference in Landsat’s red and near-infrared reflectivity to assess vegetation health. The graph below shows how NDVI significantly decreases in two areas of disturbed vegetation (red symbols) relative to undisturbed sites (green symbols) within the oyamel forest. The site locations are shown on high-resolution imagery in the second figure. The NDVI data can help determine if a given area is suitable to monarch overwintering.
NDVI analysis done by Birgit Peterson, scientist with ASRC Federal InuTeq, contractor to the USGS EROS Center. |
Forests, Wildlife | |||||||||||||||||||||||||||||||
| Near Lake Mead | Earthshots | golf courses, highways, impervious surface, lakes, land cover maps, population, urban growth, water use | These close-up NLCD images show the water… |
These close-up NLCD images show the water level changes to western Lake Mead. The water classification (blue) changes to barren ground (gray) as the lake shrinks from 2001 to 2011. Golf courses show up as developed land. Even though they have vegetation (as indicated in the Landsat images as bright green), here they show up as developed, open space. This faded pink color is also used to indicate lawn grasses in large-lot single-family housing units, parks, and other vegetation planted for aesthetics. The dark red is urban areas, and in the lower center of image is Boulder City, NV. The faded pink is conspicuous as golf courses, but another pink and red line traces toward the left—a highway that leads from Boulder City to part of Henderson. Around Lake Las Vegas are more golf courses and development in the upper left. The River Mountains occupy the blank tan space to the left of Lake Mead. |
Cities, Deserts, Water | |||||||||||||||||||||||||||||||
| Nebraska | Shaded Relief | Shaded Relief Images of specific areas (generally… | Shaded Relief Images of specific areas (generally by state) have been selected from the National Elevation Dataset. For original data details, see NED. |
|||||||||||||||||||||||||||||||||
| Nebraska | State Mosaics | Although once described as the “Great American… | Although once described as the “Great American Desert,” Nebraska is now a breadbasket for the nation and much of the world. It ranks among the leading states in many agricultural production categories. |
|||||||||||||||||||||||||||||||||
| Nevada | Shaded Relief | Shaded Relief Images of specific areas (generally… | Shaded Relief Images of specific areas (generally by state) have been selected from the National Elevation Dataset. For original data details, see NED. |
|||||||||||||||||||||||||||||||||
| Nevada | State Mosaics | Nevada was the fastest growing state between 1990… | Nevada was the fastest growing state between 1990 and 2000, with a population growth rate of 66.3 percent. No other state topped 40 percent. |
|||||||||||||||||||||||||||||||||
| New Administrative Capital | Earthshots | delta, urban growth | As Cairo and other urban areas on the Nile… |
As Cairo and other urban areas on the Nile Delta grow, new satellite cities are being constructed in the desert. Development of New Cairo City east of Cairo began in the early 1990s to help relieve congestion in the large city. Farther east, about 35 km from the Nile, is a city being built from scratch. Designed to accommodate 6.5 million residents, this new administrative capital for Egypt will house government buildings, foreign embassies, and major companies. A monorail will link the new city to Cairo. Construction of the all-new city began in 2015 and full completion is planned for 2050. |
Agriculture, Cities, Deserts | |||||||||||||||||||||||||||||||
| New Airport | Earthshots | airport, freeways, urban growth | A major development in this time series of… |
A major development in this time series of images is Denver International Airport. A massive piece of infrastructure, the airport sits on 34,000 acres of land, making it the second largest airport in the world. Located 23 miles northeast of downtown Denver, the airport was the fifth busiest in the U.S. in 2017. Its footprint on the landscape is impressive, and the airport even has room to expand. Prepared for plenty of future growth, there is enough space to expand it from 6 runways to 12. Construction began in 1989, and the disturbance to the former farm and range land can be seen in the Landsat image from 1990. The transformation from agriculture to developed land use was complete soon after, and the airport’s first flight took off in 1995. That first year, the Denver airport serviced 31 million passengers. In 2018, 64.5 million passengers traveled through the airport. The runway layout was planned to be as efficient as possible. None of the runways intersect. And there is enough space between them to accommodate simultaneous landings even in poor weather. This plan reduces delays and minimizes the risk for aircraft traffic jams. Five of the runways are 12,000 feet long. The sixth was a more recent addition. Brought into service in September 2003, this runway is 16,000 feet long and 200 feet wide. That’s about 2 Landsat pixels wide, but it shows up clearly in the imagery because it’s 162 Landsat pixels long. It’s the longest commercial runway in North America. The extra length is needed in Denver’s high elevation. Particularly for departures, larger, heavier planes need the additional space to get off the ground. |
Cities | |||||||||||||||||||||||||||||||
| New Airport | Earthshots | airport, urban growth | Nouakchott’s airport is visible as the… |
Nouakchott’s airport is visible as the straight diagonal line near the city’s center in the images in the other subsections. Over the time series of images, the airport became surrounded by the urban growth. A new larger airport, Nouakchott-Oumtounsy (NKC), opened in June 2016. In the 2013 image, the airport is still under construction, and in 2011, there is no sign of it. Located about 20 km north of the old airport, and about 17 km north of the northern extent of the city, this new airport will accommodate even more growth. |
Cities, Deserts | |||||||||||||||||||||||||||||||
| New Airport | Earthshots | airport, land creation, land reclamation, urban growth | Construction started on Hamad International… |
Construction started on Hamad International Airport (HIA) in 2004 with a huge land reclamation project. Sand from the seabed was used to build new land off the coast. More than half of the area of the new airport is on 28 square kilometers of reclaimed land. The new airport’s two runways are 4,850 meters and 4,250 meters long. They were designed to accommodate the Airbus A380, the world’s largest passenger jet. The first flights at HIA began in 2014. The new airport replaces the old Doha International Airport, located just west of the new airport. HIA is 12 times the size of the old airport. Indeed, its presence now dominates the Landsat images of Doha. |
Cities, Coasts, Deserts | |||||||||||||||||||||||||||||||
| New Cutoff Close Up | Earthshots | cutoff, flooding, rain, rivers, weather | Cutoffs are common on meandering rivers like… |
Cutoffs are common on meandering rivers like the Wabash, but it’s rare to be able to witness a cutoff forming as it happens. Scientists are using this cutoff as a chance to learn more about what happens when these cutoffs develop and how cutoffs change after they form. |
Natural-Disasters, Water | |||||||||||||||||||||||||||||||
| New Delhi Among Fastest Growing Urban Areas in the World | Image of the Week | land conversion, population, urban growth | In a world becoming increasingly urbanized, few… | In a world becoming increasingly urbanized, few cities have seen growth as dramatic as that occurring in India’s capital of New Delhi. These Landsat images from March 1991 and March 2016 show the city and its adjacent suburban areas—known collectively as Delhi. The area’s population ballooned from 9.4 million to 25 million during that period. Only Tokyo is more populated today with a population of 38 million. The United Nation’s Report on World Urbanization projects that Delhi will be at 37 million residents by 2030. Landsat can be a valuable tool in monitoring urban growth and its impact on the environment. Adjacent forests and agricultural fields converted to streets, parking lots, and rooftops can affect wildlife habitat. Rainfall blocked by impervious surfaces from soaking into the soil can pool and increase local flooding. Chemicals present on the pavement at the time of rain can be carried away with runoff, reducing water quality and threatening aquatic ecosystems downstream. All are important considerations—in Delhi or any area undergoing significant growth—when it comes to discussions about urban planning. From a regional standpoint at least, and from an environmental one, Landsat is an important part of that conversation. |
||||||||||||||||||||||||||||||||
| New Ecosystem | Earthshots | breakwater, lagoons, mangroves | Continuous testing of the seabed and water… |
Continuous testing of the seabed and water takes place during and after construction of each phase of the Sea City project to monitor the condition of the sea and coast. Scientists take water and sand samples from many locations to monitor water and sediment quality. Marine life is now flourishing in what was once relatively lifeless desert. Even new coral is growing in the lagoons. According to a study conducted in the new marine environment, over 1,000 marine macrobiota, including 100 commercial fish and shellfish species, inhabited the waterways within just a few years of bringing seawater to the desert. The species richness after just 4 years was equivalent to that of the open sea. Mangroves, a salt-tolerant plant, are raised in nurseries and then planted on islands in the new lagoons. The mangroves provide nurseries for fish and stabilize the marine bed. Since the waterways are semi-enclosed, they provide protected nurseries for fish, shellfish, and other wildlife. Bees were also introduced to pollinate the salt-tolerant plants. The aim is to have a coastal landscape that can survive without freshwater. A breakwater also needed to be built. This detached breakwater was built with 28,000 hexagonal concrete blocks, which were cast on site. These were used instead of rock because rock would not have been strong enough to protect the city and its lagoons from the currents of the open Gulf. The new marine environment created is the heart of the project. Sea City is becoming at once a thriving ecosystem and a modern city. |
Coasts, Deserts | |||||||||||||||||||||||||||||||
| New Farming Plan | Earthshots | The harvest of sugar cane continued through… |
The harvest of sugar cane continued through 2016, but no new planting took place. And with irrigation halted, the only growth after that is some resprouted cane and dry, nonnative grass. Mahi Pono, a farming company, bought the land in 2018 and plans diversified agriculture for the 41,000 acres of former cane fields. Some crops are planned for export, such as citrus, coffee, and macadamia nuts. But since Hawaii imports about 90% of its food, the company’s goal is to keep most of the food it produces in the local market. It takes time to get the varied crops up to full production, so the recent imagery continues to show the brown swath of dry grasses. For example, a plan for 40 acres of citrus trees would be the largest citrus orchard in Hawaii. But even that will not look impressive in the Landsat imagery just yet. That 40 acres would only be about 180 30-meter pixels—out of the nearly half a million pixels that make up this scene. Furthermore, those citrus trees won’t be productive right away. The company needs to upgrade the irrigation system, recondition the soil, and wait for the trees to mature. They are also learning about what can grow in certain soils and climates. Even this relatively small area of plains between the dormant volcanos has different microclimates and soil attributions. It takes time to recondition the land after growing one crop for so long, when decades of herbicide and fertilizer use depleted the soil’s organic material. As of 2021, the company had planted more than 600,000 citrus trees and more than 300,000 coffee trees on the former cane land. Other trees have also been planted as wind breaks. |
Agriculture, Fires | ||||||||||||||||||||||||||||||||
| New Hampshire | Shaded Relief | Shaded Relief Images of specific areas (generally… | Shaded Relief Images of specific areas (generally by state) have been selected from the National Elevation Dataset. For original data details, see NED. |
|||||||||||||||||||||||||||||||||
| New Hampshire | State Mosaics | In 1934, the summit of Mount Washington in New… | In 1934, the summit of Mount Washington in New Hampshire’s White Mountains experienced a wind gust of 231 miles per hour, the highest surface wind speed ever recorded. |
|||||||||||||||||||||||||||||||||
| New Jersey | Shaded Relief | Shaded Relief Images of specific areas (generally… | Shaded Relief Images of specific areas (generally by state) have been selected from the National Elevation Dataset. For original data details, see NED. |
|||||||||||||||||||||||||||||||||
| New Jersey | State Mosaics | Modern paleontology began with the 1858 discovery… | Modern paleontology began with the 1858 discovery by William Parker Foulke at Haddonfield, New Jersey of the nearly complete skeleton of a dinosaur called Hadrosaurus. |
|||||||||||||||||||||||||||||||||
| New Land Forming in the Atchafalaya Basin | Image of the Week | deltas, marshland, rivers, sediment | Most of the Mississippi River Delta in southern… | Most of the Mississippi River Delta in southern Louisiana is sinking. An area almost the size of Delaware has been lost to subsidence over the past 80 years. However, further west along the coastline is an area of delta buildup. These two Landsat images show changes to the coastline along the Atchafalaya River outlets between 1984 and 2014. Sediments carried by the Atchafalaya River, a distributary of the Mississippi, are responsible for the growth of two new river deltas seen in the 2014 image. These two deltas are from the main Atchafalaya River (right) and its associated Wax Lake Outlet (left). Both of these channels were used for flood control during the Mississippi River floods of 2012, when water was diverted from the Mississippi through the Atchafalaya River Basin into the Gulf of Mexico. The slow-moving waters of the Atchafalaya River allow suspended sediments to settle near shore. This creates an optimal land- and marsh-building environment. In contrast, the lower Mississippi River’s waters flow quickly through a narrow channel, carrying most of its suspended sediments far offshore. The coastal marshland that has now been built in the Atchafalaya region gives planners hope that other areas of the Mississippi Delta could be similarly rebuilt or preserved through land and water management. The continuous acquisition of Landsat imagery now spans more than four decades, providing a valuable historical record that can help researchers and scientists monitor and understand landform changes on the Earth’s surface. |
||||||||||||||||||||||||||||||||
| New Mexico | Shaded Relief | Shaded Relief Images of specific areas (generally… | Shaded Relief Images of specific areas (generally by state) have been selected from the National Elevation Dataset. For original data details, see NED. |
|||||||||||||||||||||||||||||||||
| New Mexico | State Mosaics | Lakes and rivers make up only 0.002 percent of… | Lakes and rivers make up only 0.002 percent of New Mexico’s total surface area–the lowest water-to-land ratio of all fifty states. Most of New Mexico’s lakes are human-made reservoirs. |
|||||||||||||||||||||||||||||||||
| New NASA/USGS Satellite Takes the Salton Sea's Temperature | Image of the Week | irrigation, lakes, thermal | ||||||||||||||||||||||||||||||||||
| New Orleans | Earthshots | canals, flooding, hurricane, lake, river, storm, weather | Lake Pontchartrain covers the northern part of… |
Lake Pontchartrain covers the northern part of these Landsat images. The curvy dark line is the Mississippi River as it meanders past New Orleans. The dark straight lines are canals, built for flood protection and as an aid to water navigation. The September 7 image shows New Orleans days after Hurricane Katrina struck. The flooded areas are dark, giving the city a bruised appearance. A straight vertical line separates a dark flooded area of the city from the light green-pink unflooded area. The floodwaters appeared to have stopped at the 17th Street Canal. This canal failed but the west dike held, keeping that part of the city from flooding. Floodwater from the Gulf of Mexico made its way to Lake Pontchartrain, which then flooded this part of the city with an 11-foot storm surge. Water entered the canals but the canal walls did not overtop. The walls failed when water had only risen part of the way up the wall. When these canals broke, water from Lake Pontchartrain poured into these neighborhoods. By September 7, the city had started to drain. Pumps worked to return the water to Lake Pontchartrain. About 380 cubic meters (100,000 gallons) of water were pumped out of the city every second. Green vegetation has returned by the 2006 image, one year after the storm. Comparing the image from before Katrina and the most recent image, the amount of vegetation appears similar. |
Cities, Natural-Disasters, Water, Wetlands | |||||||||||||||||||||||||||||||
| New Rift on Greenland’s Petermann Glacier | Image of the Week | calving, icebergs, rifts | A new rift has been forming on Petermann Glacier… | A new rift has been forming on Petermann Glacier, Greenland, throughout 2017. An older crack to the right of the new rift also seems to be extending toward the glacier’s center. If this new rift meets up with the older crack, and an iceberg breaks off, it would be Petermann’s third massive iceberg calving since 2010. It also would place the new calving face much farther upstream than the 2010 break. A close-up image from Sentinel-2A takes advantage of its 10-meter spatial resolution to show the new rift in greater detail. Landsat 8 and Sentinel-2A complement each other by imaging glacial movement and possible calving events. The prominent vertical line could be from deformation of the ice as it flows over the bedrock farther upstream. The irregular topographic surface of the underlying bedrock could have caused the ice to develop this longitudinal crevasse as it moved over bedrock, resulting in a line being drawn the length of the glacier as it flows. Besides the new rift, other bumps and lines extend from this longitudinal line, which are stress fractures from the glacial movement. Landsat 8 normally images all Earth landmasses every 16 days. However, at high latitudes, there is considerable overlap because Landsat 8’s orbital tracks converge at the Poles. As a result, this increases the temporal frequency of Landsat 8 coverage over northern Greenland. Building on this imaging overlap, Landsat 8 takes advantage of long hours of daylight in the Arctic to acquire “nighttime” sunlit images, increasing temporal coverage even more. The two Landsat 8 images were acquired a little over 3 hours apart, one on its descending orbit and one ascending. Having multiple images increases the chances of acquiring more cloud-free images and helps scientists monitor iceberg calving events. |
||||||||||||||||||||||||||||||||
| New Safe Confinement | Earthshots | accident, nuclear power plant, nuclear reactor, radiation | A temporary structure was quickly built over… |
A temporary structure was quickly built over reactor number 4 to contain radioactive material. A more permanent solution was needed. About two decades in the making, a massive steel structure called the New Safe Confinement was built to seal in the site. Segments of the structure were pre-assembled in Italy and shipped to Ukraine. To prevent exposure to radiation for the workers, the structure was erected 300 m away from the site. The framework was completed in 2014, and the entire structure was moved into place in November 2016. Notice the difference in its location between these 2015 and 2018 images from Sentinel-2. Considered the world’s largest moveable structure, the new covering weighs 40,000 tons and is 843 feet across, 355 feet high, and 492 feet long. It’s tall enough for the Statue of Liberty to fit inside. At Sentinel’s 10-meter resolution, the huge structure appears as a bright set of pixels at the accident site. The New Safe Confinement is expected to securely contain the radiation for 100 years. |
Agriculture | |||||||||||||||||||||||||||||||
| New Year’s Flooding in the Midwest | Image of the Week | flooding, rain, rivers, storms, weather | At the end of 2015, a series of storms dropped 6–… | At the end of 2015, a series of storms dropped 6–10 inches of rain in a few days over the central part of the United States. Missouri and Illinois were particularly hard hit, with many waterways overflowing their banks. |
||||||||||||||||||||||||||||||||
| New York | Shaded Relief | Shaded Relief Images of specific areas (generally… | Shaded Relief Images of specific areas (generally by state) have been selected from the National Elevation Dataset. For original data details, see NED. |
|||||||||||||||||||||||||||||||||
| New York | State Mosaics | New York’s Adirondack Park is the largest… | New York’s Adirondack Park is the largest publicly-protected area in the conterminous United States, greater in size than Yellowstone, Everglades, Glacier, and Grand Canyon National Parks combined. |
|||||||||||||||||||||||||||||||||
| Niger River | Earth As Art | deltas, rivers, sand dunes | Coursing through parched, landlocked Mali in… | Coursing through parched, landlocked Mali in Western Africa, the Niger River flows north through an ancient sand sea before turning sharply east to skirt the edge of the dune-striped Sahara. At the confluence of the Bani and Niger Rivers is an inland delta complete with narrows, twisting waterways, lagoons, and tiny islands. |
||||||||||||||||||||||||||||||||
| Niger River flooding in Mali | Image of the Week | deltas, flooding, rain, rivers, weather | ||||||||||||||||||||||||||||||||||
| Night Lights in North Dakota | Image of the Week | gas flares, oil, oil pads, thermal, urban growth | The discovery of the Parshall Oil Field in 2006… | The discovery of the Parshall Oil Field in 2006 set off a multi-billion dollar energy boom in North Dakota's Bakken Oil Patch. Daytime imagery from Earth-observing satellites has documented explosive urban growth in places like Williston and Watford City. But proof of the oil industry's rapid expansion is clearest when the sun goes down. In 1995, North Dakota cities are small but distinct yellow spots. After the boom, bursts of light explode across that landscape to create a brightness footprint for the Bakken less luminous but larger than the one created by the Twin Cities of Minneapolis and St. Paul. The wide scale images represent the artificial lights of cities and well-lit oil pads. But finer resolution nighttime imagery from Landsat reveals another aspect of the oil boom: gas flares. Natural gas is a byproduct of oil drilling. Much of it is captured, refined and sold, but about 20% of North Dakota's gas is burned off at the drill site. Landsat's thermal, shortwave infrared, and near infrared bands render the gas flares as blue-green flecks corresponding with oil pads visible in daytime imagery. |
||||||||||||||||||||||||||||||||
| Niigata Prefecture, Japan | Image of the Week | rivers | The Niigata Prefecture is on the northwest coast… | The Niigata Prefecture is on the northwest coast of Honshu, Japan’s largest island. Multiple rivers along the shoreline form a fertile coastal plain that supports abundant fields of rice and flowers, both of which are major industries of the area. |
||||||||||||||||||||||||||||||||
| Nile River Delta, Egypt | Earthshots | center-pivot, delta, irrigation, rivers, urban growth | These images show the dramatic urban growth… |
These images show the dramatic urban growth within the Nile River Delta and the expansion of agriculture into adjoining desert areas. The Nile is the world's longest river at 4,160 miles. It flows south to north, bringing fresh, nutrient-rich water to Egypt. In these images, red indicates vegetation. The contrast is clear between the lush vegetation of irrigated fields and the white or tan barren desert. |
Agriculture, Cities, Deserts, Water | |||||||||||||||||||||||||||||||
| No Man's Land | Earth As Art | magma, rock | A study in shades of blue and brown is actually… | A study in shades of blue and brown is actually one of the harshest landscapes on Earth. This glimpse of Africa's Sahara Desert, located near where the borders of Mali, Niger, and Algeria converge, is truly a no man's land, a world of sand and rock without roads or settlements. The horizontal lines across the top half of the image are intrusions of igneous rock, where magma poked up to the surface from deep underground. |
||||||||||||||||||||||||||||||||
| No Place for Flamingos on Fuente de Piedra | Image of the Week | drought, lakes | Fuente de Piedra, a saltwater lagoon in southern… | Fuente de Piedra, a saltwater lagoon in southern Spain, is an important breeding site for thousands of flamingos. In 2023, the shallow wetland nearly completely dried up, leaving little space for the birds. Only a few dozen birds were seen on the lagoon this year, a situation that could impact tourism. This spring was much hotter and drier than normal, and the above average temperatures persisted throughout the summer. Landsat shows water as dark blue. Brighter colors are caused by higher reflectivity of shallow water and salts and minerals in the water. Landsat provides a consistent worldwide record for understanding landscape changes as they occur. |
Water, Wetlands, Wildlife | |||||||||||||||||||||||||||||||
| Nordhavn | Earthshots | development, land creation, population, urban growth | One solution to accommodate Copenhagen’s… |
One solution to accommodate Copenhagen’s population growth is to grow inwardly as well as outwardly. Growth near the central part of the city will help encourage commuters to use mass transit and bicycles to commute to and from work. Nordhavn is an artificial peninsula on the Øresund coast. Nordhavn is the northernmost extension off the coast of the central part of the city. Once a harbor for container traffic and cruise ships, Nordhavn is becoming a new trend in urban development. Development of the area began in 2011, and plans are to continue development for the next several decades. This development is bringing the peninsula a new identity. It will become a mixture of housing, businesses, public spaces, parks, natural areas, and cafés. Dense urban development will minimize energy consumption used for transportation. People will find cycling, walking, and public transportation the easy and obvious choice. |
Cities | |||||||||||||||||||||||||||||||
| North America | Earth As Art | The third largest continent, North America is a… | The third largest continent, North America is a land of many facets: frozen tundra, rugged mountains, high plains, deserts, and lowland forests. |
|||||||||||||||||||||||||||||||||
| North Antelope Rochelle Complex Mines | Earthshots | coal, open pits | The North Antelope Rochelle Complex is the… |
The North Antelope Rochelle Complex is the most productive of the PRB mines. In 2018, the mine sold 98.4 million tons of coal. In 2017, it accounted for 13.1% of U.S. coal production. It began operations in 1983, and the series of Landsat images shows the progression of this mine since 1984.
|
Energy, Mining | |||||||||||||||||||||||||||||||
| North Carolina | Shaded Relief | Shaded Relief Images of specific areas (generally… | Shaded Relief Images of specific areas (generally by state) have been selected from the National Elevation Dataset. For original data details, see NED. |
|||||||||||||||||||||||||||||||||
| North Carolina | State Mosaics | Orville and Wilbur Wright made the first powered… | Orville and Wilbur Wright made the first powered flight near Kitty Hawk, North Carolina in 1903. The actual flight took place four miles away at the Kill Devil Hills, now the site of Wright Brothers National Memorial. |
|||||||||||||||||||||||||||||||||
| North Dakota | Shaded Relief | Shaded Relief Images of specific areas (generally… | Shaded Relief Images of specific areas (generally by state) have been selected from the National Elevation Dataset. For original data details, see NED. |
|||||||||||||||||||||||||||||||||
| North Dakota | State Mosaics | Since 1931, Rugby, North Dakota, has been… | Since 1931, Rugby, North Dakota, has been recognized as the geographical center of North America. A 15-foot tall rock obelisk, flanked by poles flying the United States and Canadian flags, marks the location. |
|||||||||||||||||||||||||||||||||
| North Rift | Earthshots | calving, chasm, crevasses, ice, ice rumples, ice shelf, icebergs, rifts | While a large iceberg was threatening to form… |
While a large iceberg was threatening to form from the Halloween Crack or Chasm 1, a new rift suddenly appeared in satellite images in September 2019 just north of these features. The rift zippered across the ice at remarkable speed during the Antarctic summer of 2020–2021. The third major rift in this ice shelf to become active in the past decade, the North Rift lengthened by about 20 km between November 18 and December 22, 2020. It then grew an additional 8 kilometers by January 12, 2021. Watch the new rift widen and flow westward with the ice shelf in the images. As you flip through, notice the McDonald Ice Rumples remaining stationary. |
Glaciers | |||||||||||||||||||||||||||||||
| North Rift 2 | Earthshots | calving, ice, ice shelf, icebergs, rifts | The rift continued to push northeast at up to… |
The rift continued to push northeast at up to 1 km per day as it cut through the 150-m thick ice shelf. GPS equipment detected a break on February 26, 2021. Landsat 8 got its first glimpse of the resulting iceberg, named A-74, on March 1. |
Glaciers | |||||||||||||||||||||||||||||||
| Northern Delta | Earthshots | floodplain, floods, lakes, river, sand dunes | In the northern portion of the delta, channels… |
In the northern portion of the delta, channels fill in between sand dunes during the flood season. Temporary lakes also fill during high floods. The water reaching these lakes is not returned to the river as flood waters recede. The north receives far less precipitation than the southern portion. The mean annual precipitation there is just 200 mm (7.9 inches). (Black stripes run through the 2011 image because of the Scan Line Corrector failure on Landsat 7 in May 2003.) |
Water, Wetlands | |||||||||||||||||||||||||||||||
| Northern Kazakhstan | Earth As Art | snow | Mimicking a cubist collage, linear windbreaks of… | Mimicking a cubist collage, linear windbreaks of densely planted trees surround farmsteads in this winter landscape near the city of Komsomolets in Northern Kazakhstan. |
||||||||||||||||||||||||||||||||
| Northern Norway | Earth As Art | fjords, ice, snow | Like dark fingers, cold ocean waters reach deeply… | Like dark fingers, cold ocean waters reach deeply into the mountainous coastline of northern Norway, defining the fjords for which the country is famous. Flanked by snow-capped peaks, some of these ice-sculpted fjords are hundreds of meters deep. |
||||||||||||||||||||||||||||||||
| Nouakchott, Mauritania | Earthshots | airport, flooding, groundwater, near-infrared, sand dunes, sea level, urban growth | Not too long ago, Nouakchott, Mauritania, was… |
Not too long ago, Nouakchott, Mauritania, was a small fishing town. It became the country’s capital in 1958, shortly before Mauritania became independent. The town rapidly bloomed into a huge metropolis. During a long series of drought years in the 1970s, thousands of rural families moved to Nouakchott in search of a better life. Refugees displaced by the Western Sahara War, which started in the mid-1970s, added to the city’s growth. From small fishing town to rapidly expanding national capital, Nouakchott is surrounded by shifting sand dunes from the north and east, threatened by sea level rise from the west, and facing rising salty groundwater from below. Sand, salt, and water simultaneously threaten to damage the city from all sides. That’s why monitoring the region with Earth-observing satellites will be important for its future. |
Cities, Deserts | |||||||||||||||||||||||||||||||
| Observing Snowpack in the Sierra Nevada: 2000 - 2020 | Video - LP DAAC | |||||||||||||||||||||||||||||||||||
| Observing the Sierra Nevada Mountain Snowpack 2000-2019 w/ Terra MODIS | Video - LP DAAC | |||||||||||||||||||||||||||||||||||
| Ohio | Shaded Relief | Shaded Relief Images of specific areas (generally… | Shaded Relief Images of specific areas (generally by state) have been selected from the National Elevation Dataset. For original data details, see NED. |
|||||||||||||||||||||||||||||||||
| Ohio | State Mosaics | Did you know that nearly 50 percent of the United… | Did you know that nearly 50 percent of the United States population lives within a 500-mile radius of Columbus, Ohio? Columbus is the state capital and Ohio’s largest city. It is also home to The Ohio State University. |
|||||||||||||||||||||||||||||||||
| Oil | Earthshots | coal, oil | The PRB has become about more than just coal.… |
The PRB has become about more than just coal. Oil production is also increasing. Similar to the Bakken Formation in North Dakota, new technologies are allowing oil to be more economically recoverable. Since 2009, hundreds of oil wells have been drilled in the PRB. In the second half of 2010, 219 drilling permits were received. In the first half of 2014, 1,161 permits were received. These images show the region just west of the Black Thunder Mine. The 2014 image looks like a messy dot-to-dot drawing. The light dots, connected by crooked lines, are oil wells and the roads that lead to them. |
Energy, Mining | |||||||||||||||||||||||||||||||
| Oil Fires in Iraq | Image of the Week | oil, oil spill, oil wells, smoke | Over the past few years, black smoke has been… | Over the past few years, black smoke has been seen in satellite images billowing from various locations in Iraq. As Iraqi forces drive ISIS away, the terrorist group has been setting oil wells on fire as it retreats. In the Hamrin Mountains, in northern Iraq, fires are visible in Landsat and Sentinel images acquired in fall 2017 and early 2018, compared to the area seen in the 2014 image. Along with the visible fires, an oil spill can be seen in the most recent images. The spill flows from hills into a valley over agricultural land for about 11 kilometers. The January 2018 image shows a darkened landscape. Though there is much less smoke obscuring this scene, an obvious degraded landscape is left behind. Earth observing satellites continue to detect and monitor the effect of oil fires throughout the country. |
||||||||||||||||||||||||||||||||
| Oil Production near Tioga, North Dakota | Image of the Week | drilling, oil, oil wells | These Landsat images show the area around Tioga,… | These Landsat images show the area around Tioga, North Dakota, in 2002 and again in 2014. Oil was first discovered near Tioga in 1951, and the town has experienced several episodes of rapid growth due to its location over the Williston Basin, a major North American geologic source of oil, natural gas, and other energy resources. The recent development of advanced drilling techniques has led to a new surge of production, particularly within the Bakken Formation, which has become an important source of oil within the United States. |
||||||||||||||||||||||||||||||||
| Okavango Delta | Earth As Art | deltas, rivers | Like a watercolor in which a brushstroke of dark… | Like a watercolor in which a brushstroke of dark green has bled into a damp spot on the paper, southern Africa's Okavango River spreads across the pale, parched landscape of northern Botswana to become the lush Okavango Delta. The delta forms where the river empties into a basin in the Kalahari Desert, creating a maze of lagoons, channels, and islands where vegetation flourishes, even in the dry season, and wildlife abounds. |
||||||||||||||||||||||||||||||||
| Okefenokee Fire Continues to Burn | Image of the Week | ash, burn severity, drought, near-infrared, shortwave infrared, smoke | A wildfire ignited by lightning in the Okefenokee… | A wildfire ignited by lightning in the Okefenokee National Wildlife Refuge on April 6, 2017, is persisting into May. Hot, dry weather and extremely dry fuels are making the fire difficult to contain. As of May 21, the blaze, also called the West Mims Fire, had burned 152,478 acres. Thick smoke is affecting nearby communities, and falling ash has been reported to have reached Jacksonville, Florida, about 30 miles to the southeast. Recent reports indicate that good progress has been made to extinguish the flames; however, drought conditions are expected to continue in this area of extremely dense vegetation. Landsat 8’s Operational Land Imager (OLI) combined shortwave infrared (SWIR), near-infrared (NIR), and red spectral bands to produce vivid false-color images of the burned area on April 27, 2016, and May 16, 2017. The OLI SWIR band is sensitive to soil and ash in burned areas, while the NIR band is sensitive to healthy vegetation, enabling the Landsat images to provide an accurate distinction between burned and unburned vegetation. Continuous acquisitions by Landsat will provide scientists with important data through the duration of the fire, as well as after the flames are extinguished, for assessments of burn severity, regrowth, and restoration. |
||||||||||||||||||||||||||||||||
| Oklahoma | Shaded Relief | Shaded Relief Images of specific areas (… | Shaded Relief Images of specific areas (generally by state) have been selected from the National Elevation Dataset. For original data details, see NED. |
|||||||||||||||||||||||||||||||||
| Oklahoma | State Mosaics | Oklahoma has the largest Native American… | Oklahoma has the largest Native American population of any state. Many of the 250,000 American Indians living in Oklahoma are descended from the original 67 tribes who inhabited Indian Territory. Oklahoma is tribal headquarters for 39 tribes. |
|||||||||||||||||||||||||||||||||
| Oklahoma's Scarred Landscape | Image of the Week | storms, tornadoes, weather | ||||||||||||||||||||||||||||||||||
| Okomu | Earthshots | logging, oil palm, rain forest | In 1977, part of the Okomu Forest Reserve was… |
In 1977, part of the Okomu Forest Reserve was given to the Federal Government for the Okomu Oil Palm Project. Between 1984 and 2011, the area of land used for oil palm plantations increased more than fourfold. These plantations mostly appear in the northern part of the reserve. The image series also shows major changes in the southeastern part of the reserve, where the dark green is giving way to lighter green shades and pink. Small-scale subsistence farming is becoming more widespread. Logging and fuel wood collection also take place there under the forest canopy. People in this region can also sell forest products as a means of income. These changes to the vegetation can cause increased localized erosion and flooding. Slightly higher than average rainfall can make the area vulnerable to flooding. |
Forests | |||||||||||||||||||||||||||||||
| Okomu Forest Reserve, Nigeria | Earthshots | logging, rain forest | Closed-canopy tropical moist forest once… |
Closed-canopy tropical moist forest once covered large parts of this landscape near the Niger River Delta. Since the 1940s, however, logging, farming, and large-scale plantations have caused major losses of natural forest. In the middle of this increasingly degraded landscape, a fragment of relatively undisturbed rain forest remains. In this series of Landsat images, plantations of oil palm and rubber trees appear in blocks of light green and magenta. Okomu National Park in Nigeria was designated in 1999 to protect a small population of forest elephants and several species of threatened primates within the Okomu Forest Reserve. Despite the large-scale rubber and oil palm plantation expansion in the northern half of the forest reserve and farmland in the southern half, Okomu National Park remains largely protected within the reserve and its dark green hue stands out against these surroundings. |
Forests | |||||||||||||||||||||||||||||||
| Old Faithful | Earthshots | burn severity, fire scars, recovery | This series shows the area around the famous… |
This series shows the area around the famous Old Faithful geyser. Geysers and hot pools are the bright or blue spots within the dark green forest. The vertical line on the left side of the images is the western park boundary. The patchy spots to the left of the line are logging areas outside the boundary. The 2011 image reveals another smaller burn scar just to the northwest of the airport at West Yellowstone, Montana, and the 2016 image shows another new burn scar at the top edge. The fires scorched a lot of the park, but they did not destroy forests in one large swath. The severity of the burn varies. Unburned land is interspersed with the burned area. Dark red areas are severe burns, and lighter red areas are less severe. Over time, the pink bare ground begins to give way to light green as vegetation returns. |
Fires, Forests, Natural-Disasters | |||||||||||||||||||||||||||||||
| Old Name, New Elevation for North America’s Highest Peak | Image of the Week | snow | Secretary of the Interior Sally Jewell recently… | Secretary of the Interior Sally Jewell recently announced that the highest point in North America, formerly known as Mount McKinley, will be designated by the name Denali in all federal records. Later, U.S. Geological Survey acting Director Suzette Kimball announced that the Denali summit has a new, official elevation of 20,310 feet. Using the latest methods of satellite-based surveying technology (GPS), a team of mountaineering surveyors under the direction of the U.S. Geological Survey, NOAA’s National Geodetic Survey (NGS), the National Park Service, and the University of Alaska Fairbanks Geophysical Institute re-measured the height of the mountain this summer. The last official survey of the summit had been conducted in 1953. Scientists from NOAA’s NGS, Dewberry, CompassData, the University of Alaska Fairbanks, and the USGS carefully analyzed the raw data acquired by the survey party to arrive at the final elevation number. The exceptional circumstances for this surveying challenge, such as making allowances for the variable depth of the snow pack and establishing the appropriate surface that coincides with mean sea level, were judiciously considered before the new apex elevation was finally determined. The Landsat 8 image from June 15, 2015, shows a clear view of the perennially snow-covered summit. Glaciers stream down the mountain to lower elevations. |
||||||||||||||||||||||||||||||||
| Old River Control Structure | Earthshots | canals, deltas, marshes, rivers, sea level rise, sediment | The Mississippi River Delta has… |
The Mississippi River Delta has naturally meandered and migrated over time, building lobes of low swampland in what is now southern Louisiana. If left to its own, the river might migrate west and join the Atchafalaya to take a direct southerly route to the Gulf. However, a system of levees, flood gates, and canals prevents that from happening. Built in 1963 to regulate the amount of flow into the Atchafalaya, the Old River Control Structure prevents the Atchafalaya River from capturing the Mississippi. The system keeps 70% of the water in the Mississippi. The 2022 image labels the parts of the Old River Control Structure and rivers. With more than 50 yeas of data, the Landsat program is a valuable tool in continuing to monitor both the land loss and land gain of the Mississippi River Delta. |
Coasts, Water, Wetlands | |||||||||||||||||||||||||||||||
| Olympic Skiing and Land Change | Image of the Week | land conversion, Olympics, snow | Images from the Advanced Spaceborne Thermal… | Images from the Advanced Spaceborne Thermal Emission and Reflection Radiometer (ASTER) onboard NASA’s Terra satellite show how one area in South Korea transformed from mountainous forest to a world-class downhill skiing venue to get ready for the 2018 Winter Olympics. The Jeongseon Alpine Centre was built on Mount Gariwang, chosen because it met international guidelines for the Alpine Skiing events, including Downhill, Super-G, and Alpine Combined. These ASTER images show the area in 2013 before the Jeongseon Alpine Centre was built, in 2017 after it was completed, and finally during the Olympic Games in February 2018. The inset is an oblique view of the ski hill using ASTER data. In these pseudo-true color images, varying amounts of snow cover the ground and forests appear bright green. An additional image from Sentinel-2B shows the ski slopes in slightly higher resolution and in natural color. Forested areas are darker, and snow-covered ground appears gray. Approximately 58,000 trees were cleared to make room for the ski runs. More than 1,000 trees are slated to be returned once the Olympics are completed. Data from ASTER and Sentinel distributed by the USGS EROS Center will be able to monitor the mountain to see any land changes that happen after the games are over. |
||||||||||||||||||||||||||||||||
| Olympic Skiing in Beijing | Image of the Week | Olympics, snow | A satellite image of the mountains that will host… | A satellite image of the mountains that will host Olympic skiing events should display a snowy landscape, right? But the National Alpine Ski Center and Sliding Center, 45 miles northwest of Beijing, China, doesn’t get much snowfall. Instead, the steep slopes are lined with man-made snow. Water used in snowmaking is pumped from reservoirs, which makes it possible to reuse snowmelt and rainwater. Landsat 8 imagery acquired in the years before the venue’s opening shows a forested mountain range. In February 2022, Landsat shows the artificially snow-covered ski runs ready for competition. In summer, the ski runs carved out of the mountainside stand out against a green, forested landscape. |
||||||||||||||||||||||||||||||||
| Omo River Delta | Earthshots | delta, lakes, rivers | In these images, bright green indicates… |
In these images, bright green indicates aquatic vegetation on the Omo River delta. The size of the delta changes over time in these scenes because of changes to the lake’s water level. The delta expands and shrinks in response to the high rainfall variability in the region. However, if a significant amount of water is diverted from the Omo River for irrigation, the natural dynamics of the lake levels could be affected. In the 2011 and 2015 images, curious features appear: green swirling shapes south of the delta. We know that green indicates growing vegetation in these images, but is this shallow water being exposed with more aquatic vegetation taking hold, or is this vegetation floating on the water’s surface? Examining the lake’s depth reveals that it is too deep in this area to be growing, rooted plants. So it must be vegetation or weeds floating on the surface. |
Dams, Water | |||||||||||||||||||||||||||||||
| On Thick Ice | Earthshots | fishing, ice, ice fishing, ice road, lake | The maximum depth of this large lake is only… |
The maximum depth of this large lake is only 40 feet. The entire surface freezes all the way across each winter, with ice reaching 2–4 feet thick. That’s thick enough to drive cars and pickups on. According to the Minnesota Department of Natural Resources, clear ice 16 inches thick can support a heavy-duty pickup. Some years look a little busier. In some images, the lake looks smudgy with snow or wind. So the view depends on local conditions on the day of Landsat overpass. |
Water | |||||||||||||||||||||||||||||||
| One Year Ago: Eclipse Darkens Nebraska | Image of the Week | center pivots, eclipse, irrigation, rivers | A total solar eclipse darkened the skies over the… | A total solar eclipse darkened the skies over the United States on Aug. 21, 2017. Fourteen states were in the path of totality, a 70-mile-wide band under which the moon fully blocked the sun for just under three minutes. Oshkosh, a town in the Nebraska Sandhills, was a prime location for viewing the eclipse. This Landsat 7 image shows the town at 11:33 a.m. local time on Aug. 18, 2016, a year before the total eclipse. The sandy surroundings to the north and south are bright and clear in the natural color image, as is the lush green vegetation along the North Platte River to the south. The green circles peppered throughout the image signal the location of center-pivot irrigation systems. One year later, Landsat 7 captured an image of Oshkosh at the same time of day, just 17 minutes before the totality. Each feature in the midday scene is darker. A scattering of clouds to the west is the brightest feature in the scene. The next total solar eclipse will take place on July 2, 2019. That eclipse will be visible in the South Pacific, Chile and Argentina. |
||||||||||||||||||||||||||||||||
| Open Data in Australia | Video - Landsat | |||||||||||||||||||||||||||||||||||
| Oregon | Shaded Relief | Shaded Relief Images of specific areas (generally… | Shaded Relief Images of specific areas (generally by state) have been selected from the National Elevation Dataset. For original data details, see NED. |
|||||||||||||||||||||||||||||||||
| Oregon | State Mosaics | Crater Lake, in south-central Oregon, is the… | Crater Lake, in south-central Oregon, is the deepest lake in the United States and was formed in the remains of an ancient volcano. The lake is widely known for its intense blue color and spectacular views. |
|||||||||||||||||||||||||||||||||
| Orlando, Florida, USA | Earthshots | karst, lakes, limestone, phosphate, reclamation, sinkholes | The physical growth of Orlando, Florida,… |
The physical growth of Orlando, Florida, especially to the east and south, is apparent in these images. Builders in the area have to plan construction carefully because this land is karstic. Karst terrain is characterized by springs, caves, sinkholes, and a unique hydrogeology that results in aquifers that are highly productive but extremely vulnerable to contamination. The term karstic comes from Karst, a region in the Balkans whose underlying rock is limestone, which slowly dissolves in the groundwater giving it a distinctive terrain and water cycle. Karstic lands comprise 5 to 10 percent of the Earth's land surface, where oceans have retreated as they did in Florida. Millions of years ago, Florida was under water; calcium crystals and seashells sank to this ocean floor and gradually compacted into hard limestone. As the ocean dropped, Florida became covered by plants and soil, and subject to rainwater. |
Cities, Mining | |||||||||||||||||||||||||||||||
| Other Vortices | Earthshots | clouds, islands, Karman vortex street | Selkirk Island is not the only place where… |
Selkirk Island is not the only place where Landsat has seen vortex streets. Other places where this phenomenon is common are nearby Robinson Crusoe Island; the Kuril Islands, Russia; Guadalupe Island, off the western coast of Mexico; and the Aleutian Islands, Alaska. The reason for the cloud patterns is the same: tall, steep-sided islands that affect the motion of passing clouds. That first image over Selkirk Island in September 1999, however, is still the clearest vortex street Landsat has recorded. |
Coasts, Water | |||||||||||||||||||||||||||||||
| Outbreak Causes | Earthshots | caterpillar, defoliation, drought, insect infestation, moth | The current gypsy moth outbreak is thought to… |
The current gypsy moth outbreak is thought to be the result of a series of unusually dry springs in 2014, 2015, and 2016, which suppressed a fungus that keeps the moth population in check. The fungus (known as Entomophaga maimaiga in the scientific world) infects the caterpillars and causes high rates of mortality. However, researchers believe that during this outbreak, low precipitation during key periods in the gypsy moth life cycle resulted in lower amounts of this fungus, so the fungus was not as effective and the moth population was not kept in check. A healthy tree can survive a defoliation by the caterpillars. It can usually produce new leaves in the same growing season. However, consecutive years of caterpillar attacks can cause tree mortality. |
Forests, Wildlife | |||||||||||||||||||||||||||||||
| Outburst | Earth As Art | flooding, ice | Red and black seem to mar the icy glacial… | Red and black seem to mar the icy glacial landscape of southern Iceland. The gray-black filaments are past glacial melting outbursts called jökulhlaups. These abrupt flooding events gush down this outwash plain called Skeiðarársandur, one of the world’s largest. The Skeiðarárjökull Glacier reaches down from the top left of the image. The plain is mostly devoid of vegetation, but red coloring indicates low moss, birch shrub, and other grass species. |
||||||||||||||||||||||||||||||||
| Over 20 Million Landsat Scenes Downloaded | Image of the Week | icefield | Since 2008, all Landsat data—archived and newly… | Since 2008, all Landsat data—archived and newly acquired—have been available for free download. On September 16, 2014, users worldwide downloaded over 14,000 scenes from the servers at the USGS Earth Resources Observation and Science (EROS) Center. These downloads brought the total number of Landsat data downloads to more than 20 million. |
||||||||||||||||||||||||||||||||
| Oxbow Lakes | Earthshots | cutoffs, erosion, lakes, oxbow lakes, rivers, sediment | The more a river meanders, the more cutoffs… |
The more a river meanders, the more cutoffs form. Cutoffs form more frequently on rivers that have more sediment. Flanking the Mamoré River in these images are numerous oxbow lakes, formed from these cutoffs. An oxbow lake starts as a meander, or curve, in the river. Sediment builds up on one side of the curve, called deposition. The river becomes more curvy until the river ultimately loops back onto itself. The river then flows along the straighter path and forms a cutoff. Once the river completes this shortcut, the curve becomes a separate body of water, called an oxbow lake. Over time, the oxbow lake fills with sediment and detritus and eventually becomes a swamp or bog for a while and then often dries up as the water evaporates.
|
Water | |||||||||||||||||||||||||||||||
| Oxbows in Bolivia | Earth As Art | grassland, lakes, rivers | The Beni River in Bolivia resembles a blue ribbon… | The Beni River in Bolivia resembles a blue ribbon as it meanders toward the Amazon River. Scattered along the river are numerous oxbow lakes, which are curved bodies of water that form when a meander from the main stem of a river is cut off, creating a freestanding body of water. Dark green colors in the image indicate forest and lighter green shades indicate grassland or sparse forest. |
||||||||||||||||||||||||||||||||
| Øresund Link | Earthshots | artificial islands, bridge, development, islands, land creation, population, urban growth | An artificial island first appears in the… |
An artificial island first appears in the Øresund Strait in the 1998 image. The 4-km-long (2.5-mile-long) island is called Peberholm and was built from material dredged from the seabed. It’s a key point in the construction of the Øresund Link, which connects Copenhagen and Malmö. Open for traffic since 2000, the Øresund Link is made up of three segments. Starting from Copenhagen on the northern end of the airport, the link begins with an underwater tunnel that is 3,510 meters (2.2 miles) long. The roadway on Peberholm Island is 4,055 meters (2.5 miles) long. Finally, Øresund Bridge spans the rest of the strait to Malmö. The cable-stayed bridge is 7,845 meters (4.9 miles) long and is visible as the thin line curving from the island to Malmö. |
Cities | |||||||||||||||||||||||||||||||
| Pad Drilling | Earthshots | drilling, oil, oil platforms, well pads | A new drilling technique called pad drilling… |
A new drilling technique called pad drilling reduces the overall footprint of land cover change caused by the industry. Several horizontal well bores are drilled from a single larger pad. Pad drilling became more widespread in 2010 and now accounts for about 75% of all new wells. While the number of wells drilled can increase, the land requirement for increased production is not as extensive. Furthermore, other infrastructure, such as roads and pipelines, are reduced overall. Pad drilling also has the benefit of more wells being drilled in less time. A significant area of underground resources can be tapped with minimal impact on the surface. Even as the number of new drilling wells slows, production can continue to increase. |
Cities, Mining | |||||||||||||||||||||||||||||||
| Pāhoa | Earthshots | crater, eruption, fissure, island, lava, lava flow, volcano | On June 27, 2014, new fissures erupted just… |
On June 27, 2014, new fissures erupted just east of Pu‘u ‘Ō‘ō crater and lava advanced rapidly to the east. By late October, lava had advanced 20 km toward Pāhoa. The flow eventually stalled 1,800 feet (550 m) from the Pahoa police and fire stations. It also reached within 500 feet (150 m) of Pāhoa’s main street before stopping. By mid-December, the lava flow threatened the Pāhoa Marketplace shopping center but no damage was done there. The entire flow extended 13.5 miles (21.7 km). Landsat imagery shows this flow as ragged, dark lines protruding from the main lava flows around Pu‘u ‘Ō‘ō. An image from the European Space Agency’s Sentinel-2 satellite shows the lava flow and Pāhoa in slightly higher resolution and makes it clear just how closely the flow approached the community. |
Coasts, Natural-Disasters | |||||||||||||||||||||||||||||||
| Painted Horse | Earth As Art | craters, islands, volcanoes | The northern end of Isla Isabela in the Galapagos… | The northern end of Isla Isabela in the Galapagos looks like a seahorse with warts—with an eye painted in the ancient Egyptian style. The island was formed by the merger of six volcanoes. Wolf Volcano is the prominent one in the center; Ecuador Volcano is the one that forms the seahorse’s mouth. Past volcanic flows radiate from the large craters. |
||||||||||||||||||||||||||||||||
| Painting the Desert | Earth As Art | flooding, streams | The Lake Eyre Basin is one of the driest places… | The Lake Eyre Basin is one of the driest places in Australia. But this image features a rare green flush to this otherwise parched landscape. Streams and creeks that drain into the basin are usually dry, but storms in March 2018 delivered water to these braided channels. By April, the floodwater had receded and left a green expanse behind. Scientists use satellites to track such flooding and greening events. |
||||||||||||||||||||||||||||||||
| Palm Jebel Ali | Earthshots | artificial islands, islands, land creation, urban growth | Palm Jebel Ali is another island similarly… |
Palm Jebel Ali is another island similarly shaped to the Palm Jumeirah and slightly larger. And like Palm Jumeirah, this artificial island was built quickly in the early years of the 2000s. After the financial crisis of 2008, development slowed down. In fact, construction on Palm Jebel Ali was suspended in 2009, and relatively less change is visible between the 2008 and the 2022 images. Planning is again underway to develop the island but at a slower pace. Similar to Palm Jumeirah, Palm Jebel Ali will include apartments, homes, offices, and hotels. |
Cities, Coasts, Deserts | |||||||||||||||||||||||||||||||
| Palm Jumeirah | Earthshots | artificial islands, islands, land creation, urban growth | Palm Jumeirah was the first of the artificial… |
Palm Jumeirah was the first of the artificial islands off the coast of Dubai to be built. Shaped like a huge palm tree, it added 56 kilometers (35 miles) to Dubai’s coastline. Palm Jumeirah includes a trunk with 17 fronds surrounded by a crescent-shaped breakwater. Residences are on the fronds, the trunk has apartments, and hotels line the crescent. The crescent also has a large water park called Aquaventure. In the early years of the 21st century, substantial progress is seen on this artificial island. Once the island takes shape, vegetation is seen increasing on the new land. The progress on the island matched the urban growth inland during the same time period. New roads, expanded urban areas, and increased vegetation mark the most visible changes in these images. |
Cities, Coasts, Deserts | |||||||||||||||||||||||||||||||
| Palm Oil Plantations | Earthshots | carbon, palm oil, peat, rain forest | Understandably, many countries are pursuing… |
Understandably, many countries are pursuing renewable resources to get away from the reliance on fossil fuels. However, new research has determined that palm oil doesn’t reduce greenhouse gas emissions at all—producing biofuel from palm oil may actually increase greenhouse gases as much as burning fossil fuels does. One of the reasons is peat land. Much of the rain forest that is being converted to palm oil plantations is located on peat land. These natural carbon sinks sequester huge amounts of carbon. Cutting these forests and draining the peat land releases this stored carbon that has been there for thousands of years. Besides that, the carbon costs in fertilizing and managing the crops, processing the products, and transporting them outweigh any benefits. Forest cover in West Papua was estimated to be 33 million hectares in 1997. That reduced to 30.4 million hectares by 2004. Even more plantations appear in the later images. |
Agriculture, Deforestation, Forests | |||||||||||||||||||||||||||||||
| Palmyra | Earth As Art | atolls, islands | Palmyra Atoll is an ancient volcanic remnant… | Palmyra Atoll is an ancient volcanic remnant located about 1,000 miles from Hawaii. The Nature Conservancy, along with the U.S. Fish and Wildlife Service, manages the atoll as a science and research station. Multispectral sensors on drones efficiently capture high-resolution images of land and coral reefs. Part of the atoll, an islet named Pelican Island, shows green vegetation as blue. |
||||||||||||||||||||||||||||||||
| Papua, Indonesia | Earthshots | carbon, logging, palm oil, peat, rain forest | The growth of the palm oil industry has… |
The growth of the palm oil industry has transformed part of the tropical rain forest of Papua, Indonesia, into gridded blocks of palm oil plantations. Indonesia produces a little over half of the world’s palm oil. Together, Indonesia and Malaysia produce 87% of the world’s palm oil. Palm oil is used in about half of all consumer goods. It is found in cooking oil, soap, food additives, and myriad other products. You have almost certainly used palm oil recently probably without knowing it. |
Agriculture, Deforestation, Forests | |||||||||||||||||||||||||||||||
| Parallel Dunes | Earth As Art | lakes, sand dunes | Most of this image is in the Simpson Desert… | Most of this image is in the Simpson Desert Regional Reserve of South Australia. The shallow lakes, appearing in colors ranging from nearly black to aqua blue, are dry most of the time. Here, they seem to stretch with the sand dunes, which extend for hundreds of kilometers. |
||||||||||||||||||||||||||||||||
| Parana River Delta | Earth As Art | deltas, marshland, rivers | The Parana River delta is a huge forested… | The Parana River delta is a huge forested marshland about 32km northeast of Buenos Aires, Argentina. The area is a very popular tour destination. Guided boat tours can be taken into this vast labyrinth of marsh and trees. The Parana River delta is one of the world's greatest bird-watching destinations. This image highlights the striking contrast between dense forest and wetland marshes, and the deep blue ribbon of the Parana River. |
||||||||||||||||||||||||||||||||
| Parana River Diversion | Image of the Week | hydropower, lakes, rivers | ||||||||||||||||||||||||||||||||||
| Pasig-Potrero | Earthshots | ash, eruption, lahar, mudflows, pyroclastic flows, rivers, sediment, urban growth, volcanoes | The Pasig-Potrero River drains the east side… |
The Pasig-Potrero River drains the east side of Mount Pinatubo, just south of Clark Air Force Base. Following the 1991 eruption, pyroclastic flows buried about one-third of the Pasig-Potrero watershed. A series of lahars that occurred in the years after the eruption made the Pasig-Potrero channel wider. After the eruption image from July 1991 (really just a brown and gray mess under a few puffy clouds), a bright purple-pink lahar appears downstream on the Pasig-Potrero River. The sediments are redistributed over time, until the October 1994 image shows a larger change to the river. A lahar alongside a previous one more than doubled the area covered by sediment. The 1996 image shows more clearly even further lahar action with bright pink hues. Recent images show the reestablishment of farm fields, though the land and river course are altered from what they were before the 1991 eruption. The 1996 image indicates the beginning of dike construction. These dikes, along with a reinforced dam built along the southern slopes, create a sediment retention area. The dikes stand 5 to 15 meters tall. These images also hint at the lingering hazard in this region. A growing population is indicated by the urban growth of the city of Angeles in the upper center of the images. This city, with a 2016 population of about 900,000, is near Clark Air Force Base; the long straight lines are the runways of the air base. Clark Air Force Base closed soon after the Pinatubo eruption. However, it reopened to U.S. forces in June 2012, when it was called Clark Air Base. A new highway was also completed by 2007, seen in the image winding past the air base and to the lower left. In early 2017, clouds covered the Pasig-Potrero River area in all available Landsat images. The image ASTER captured on February 23, however, was clear. With many cloudy days in this part of the world, these sensors complement each other, filling in when the other sensor detects mostly clouds. Even more than two and a half decades after the eruption, lahar hazards may continue. Landsat and ASTER help monitor changes caused by these hazards and how the changes to the land affect the population. |
Mountains, Natural-Disasters | |||||||||||||||||||||||||||||||
| Pearl River Delta, China | Earthshots | airports, bridges, delta, megacities, population, urban growth | In 1978, the Pearl River Delta (PRD) region in… |
In 1978, the Pearl River Delta (PRD) region in southern China had a population of just under 10 million. The population was scattered between several medium-sized cities on an interlacing network of rivers and streams. Some of those cites have become megacities, and the entire region has merged into one continuous, if scattered, megalopolis with a combined population greater than the six U.S. New England states plus New York, New Jersey, and Pennsylvania. The PRD now has a population higher than Tokyo, making it the world’s largest urban area. In 1978, China began new economic policies that loosened regulation for migrating within the country, and people either moved permanently to cities to find work in industry or moved there temporarily for seasonal work. In-migration has been the largest contributor to the rapid population rise. The new model also opened up the country to foreign investment and less government control on private businesses. Landsat’s long record and spatial resolution make it ideal for mapping change in areas that are urbanizing rapidly, such as the Pearl River Delta. Urban area growth dominates the later images in this Landsat time series. Municipalities and Special Administrative Regions of the Pearl River Delta
* For comparison, the population of Tokyo is 37,732,000 |
Agriculture, Cities, Coasts | |||||||||||||||||||||||||||||||
| Pearl-Qatar | Earthshots | artificial islands, islands, land creation, land reclamation, pearl diving, pearls, urban growth | The Pearl-Qatar is 32 kilometers of new… |
The Pearl-Qatar is 32 kilometers of new coastline extending into the Persian Gulf. It is so named because Doha began as a pearl fishing village in the 1800s. The Pearl-Qatar is built on one of the country’s historical pearl diving sites. Construction of the Pearl-Qatar began in 2004. Once completed, it will contain over 19,000 residences that will include townhouses, luxury apartments, beachfront homes, luxury hotels, shopping, fine dining, marinas, and entertainment. The string of nine artificial islands to the east is called Isola Dana. These private islands each have a personal beach and protected harbor for yachts. Based on the 2019 image, it appears that so far four of these islands have been developed. |
Cities, Coasts, Deserts | |||||||||||||||||||||||||||||||
| Pelon | Earthshots | migration, monarch butterflies, oyamel | These close-ups show another core zone area of… |
These close-ups show another core zone area of the reserve called Pelon. Forest disturbance is most visible in the 2000 image. Later Landsat images reveal some red filling in in this area. In the Landsat imagery, red indicates any actively growing vegetation, so it may not be the tall trees of oyamel forest recovering yet. The Global Forest Change data do reveal some blue pixels in the Pelon site, so there is potentially some recent recovery occurring. The northern side of this site had been stripped of several historical colony sites by the time of the 2000 Landsat image. The Global Forest Change data don’t show some of this area as forest loss because that study uses Landsat data from 2000 to 2013, so the areas that are black were already non-forest by 2000. |
Forests, Wildlife | |||||||||||||||||||||||||||||||
| Pennsylvania | Shaded Relief | Shaded Relief Images of specific areas (generally… | Shaded Relief Images of specific areas (generally by state) have been selected from the National Elevation Dataset. For original data details, see NED. |
|||||||||||||||||||||||||||||||||
| Pennsylvania | State Mosaics | The first commercial oil well in the United… | The first commercial oil well in the United States was drilled by Edwin Drake near Titusville, Pennsylvania in 1859. Pennsylvania produced nearly half of the world’s supply of oil until the Texas oil boom in 1901. |
|||||||||||||||||||||||||||||||||
| Penrith Lakes | Earthshots | lakes, Olympics, urban growth | A feature west of Sydney changes shape and… |
A feature west of Sydney changes shape and color throughout these four images, indicating constant change in that location. This area, which covers about 1,935 hectares, is the Penrith Lakes mining and reclamation project. Located on the floodplain of the Nepean River, Penrith Lakes is the largest sand and gravel quarry in Australia. Eventually, quarrying activities will end and the entire site will be completely turned into parkland and lakes. Three main recreation lakes are planned, and the northern lake will be a wildlife sanctuary. During the first stage of the reclamation, the southern part of the area was turned into the kayaking and rowing venue for the 2000 Summer Olympic Games. |
Cities, Coasts | |||||||||||||||||||||||||||||||
| Perform A General Search | Video - Find Data | |||||||||||||||||||||||||||||||||||
| Petermann Glacier | Earth As Art | ice | Located on the northwestern coast of Greenland,… | Located on the northwestern coast of Greenland, Petermann Glacier covers 1,295 square kilometers (500 square miles). The glacier's floating tongue of ice extends from the lower right corner of the image toward the top center. At 15–20 kilometers (9–12 miles) wide and 70 kilometers (43 miles) long, it is the longest floating glacier in the Northern Hemisphere. Infrared wavelengths reveal bare ground shown in red-brown tones in this summer image. |
||||||||||||||||||||||||||||||||
| Petermann Glacier, 2020 Update | Image of the Week | icebergs, rifts | Petermann Glacier in northwestern Greenland is… | Petermann Glacier in northwestern Greenland is known to generate large icebergs—most notably in 2010 and 2012. Another large iceberg may be forming now. A new rift was spotted on the glacier in 2017. Since then, imagery from both Landsat and Europe's Copernicus Sentinel-2 satellites show the rift lengthening and meeting up with an older crack. The potential iceberg could exceed 150 km2 in area. That’s bigger than the 2012 break, but smaller than the 2010 break. (This is a rough estimate—it could be larger or smaller than that.) Landsat and Sentinel help glaciologists keep a close eye on this remote but significant glacier. Go to the USGS Earthshots page for more imagery of Petermann Glacier and the iceberg calvings from 2010 and 2012. |
||||||||||||||||||||||||||||||||
| Petermann Glacier, Greenland | Earthshots | calving, ice shelves, icebergs, rifts, sea level rise, solstice | Petermann Glacier made headline news in 2010… |
Petermann Glacier made headline news in 2010 and again in 2012 when large pieces broke off the end of the glacier and floated out to sea. Located on the northwestern coast of Greenland, Petermann Glacier covers 1,295 square kilometers. Its floating ice tongue is 15–20 kilometers wide and 70 kilometers long—the longest floating glacier in the Northern Hemisphere. A glacier is made up of fallen snow that has been compressed into a large thickened ice mass over many thousands of years. Tidewater glaciers flow like very slow rivers to the ocean, and at the boundary between the glacier and the sea, ice breaks, or calves, from the end, creating icebergs. This calving is normal, but it’s worth watching Petermann and other Greenland glaciers closely. Petermann is one of the major marine-terminating glaciers of Greenland. Ice loss from the Greenland Ice Sheet has increased recently. An article in Nature concluded that climate change may cause Petermann and other Greenland glaciers to contribute to sea level rise. Landsat helps glaciologists keep a close eye on this remote but significant glacier. |
Glaciers, Water | |||||||||||||||||||||||||||||||
| Phnom Penh, Cambodia | Earthshots | canals, irrigation, population, rivers | From 1975 to 1978, Cambodia was ruled by the… |
From 1975 to 1978, Cambodia was ruled by the Khmer Rouge regime, which sought among other things to build a vast system of irrigation canals. These images show an area around Cambodia's capital city of Phnom Penh where such waterworks were built. Many areas east of the Mekong River show a gridwork of canals by 1985. |
Water | |||||||||||||||||||||||||||||||
| Phoenix, Arizona, USA | Earthshots | airports, canals, freeways, golf courses, lakes, population, reservoirs, stadium, streets, suburbs, urban growth, water use | Phoenix, Arizona, and its suburbs are growing… |
Phoenix, Arizona, and its suburbs are growing rapidly, both in population and area. Landsat images show striking changes in the Phoenix metropolitan area in only a few decades. The most noticeable change is residential areas spreading over agricultural fields, which are shown in the images as bright red squares and rectangles. But in other areas, the urban growth expands over what was once bare desert. New residents and tourists are attracted to Phoenix by the warm weather and abundant sunshine. Phoenix has maintained rapid and sustained growth, and its location in a wide valley allows neighborhoods to be built with houses that can have a lot of space around them. From 1970 to 2022, the population of the Phoenix metropolitan area grew by 416 percent. Phoenix doesn’t have many cloudy days, so it’s perfect for studying urban growth with satellite images. Scientists and city planners study population growth and urban expansion in fast-growing cities like Phoenix to determine the changes that have occurred over time and to see how those changes impact the surrounding environment, affect the availability of natural resources such as water, and alter the landscape and how it’s used. That information can help people plan for future changes as cities continue to grow.
|
Cities, Deserts, Water | |||||||||||||||||||||||||||||||
| Phosphate Mines | Earthshots | karst, phosphate, reclamation, sinkholes | The central phosphate region of Florida has… |
The central phosphate region of Florida has been strip mined since 1888. By the 1980s, it accounted for almost 30% of worldwide production, and almost three quarters of U.S. production. 93% of Tampa Bay's exports are phosphates. Almost all mined phosphate goes into crop fertilizer. Modern phosphate mining involves complete removal of the land—plants, animals, soil, water, even bedrock—and then its approximate reconstruction minus the phosphate. The steps are as follows:
This process creates several byproducts besides fertilizer. Topsoil lies stacked by the mine. Sand has been separated from the phosphate ore and pumped back from the processing plant to the mine where it is used to restore the site when mining is complete. Fine-grained clay has also been separated and is more troublesome since it stays mixed with the slurry water and swells to three times its original size. Finally, every pound of manufactured fertilizer also creates five pounds of phosphogypsum waste. Since 1975, state law has required mining companies to reassemble these byproducts back into a reclaimed semblance of the pre-mined landscape. This means bulldozing the piles of topsoil and sand into gentle slopes and replanting them with vegetation sufficient to hold a 25-year downpour as well as the pre-mined land could. Sometimes part of the clay is mixed with this bulldozed sand, but most clay gets pumped into settlement ponds, where over several decades it consolidates to an acceptable density, though still more swollen than before mining. Many of the water bodies visible in the Landsat images are settlement ponds. These aboveground ponds are contained by earthen walls that have occasionally burst, releasing billions of gallons of waste water, threatening water quality and human lives. A more stubborn problem is the phosphogypsum. This byproduct of fertilizer manufacture is too low-grade to be used like mined gypsum in products such as wallboard. It is also acidic and contains low levels of carcinogens like radon. It is kept out of reclamation and piled in massive "gypsum stacks" up to 200 feet high. Possible uses for the phosphogypsum such as roadbuilding have been stymied by toxicity concerns. Even establishing plant cover on the stacks has been challenging. Meanwhile, the stacks grow rapidly. Recent regulations require liners under new stacks, but in 1994 an existing stack of 80 million tons was struck by that old karstic hazard, a sinkhole. Fifteen stories deep, it dumped millions of cubic feet of water and gypsum into the aquifer. You can see in these images the expansion of the mined area, its southward shift, and the progress of individual mines through the mining process. Look for this progression: lush vegetation (red), then perhaps bare earth (bright), then ponds (black if deep and clear, brighter blue if shallow and/or full of sediment), and finally reclaimed vegetation (red if lush, pink if not). |
Cities, Mining | |||||||||||||||||||||||||||||||
| Phosphate Mines, Florida | Image of the Week | land conversion, phosphate, reclamation | The Bone Valley region in Central Florida… | The Bone Valley region in Central Florida contains the largest known deposits of phosphate in the United States. These deposits were formed within layers of fossil-rich sediments that developed millions of years ago when the area was underwater. The rocks in this region contain phosphate minerals that are broken down for phosphorus, which is used to produce agricultural fertilizer and other applications.
|
||||||||||||||||||||||||||||||||
| Picking Calibration Sites | Earthshots | calibration | Engineers use test sites around the world to… |
Engineers use test sites around the world to make sure Landsat imagery is consistent and accurate. These calibration test sites are regions on the Earth that remain stable over long periods of time. They do not change year to year or season to season. They are typically deserts or dry lakebeds with very low humidity, low atmospheric changes, and little to no human intervention. These sites are described as pseudo-invariant. They are not completely invariant because no site can be perfectly stable over time and varies to some degree. So engineers refer to the sites as Pseudo-Invariant Calibration Sites, or PICS. The idea of studying these test sites is simple. Engineers look at a spot of land that is expected to remain consistent. The reflectance at different wavelengths of light in the Landsat data should stay stable. When changes occur in these reflectance values, it may mean the sensor’s response has shifted. Examples of other test sites are the remote desert sands of Libya, the Railroad Valley Playa lakebed in Nevada, and even the straight bridge that crosses Lake Pontchartrain, Louisiana. (The span of the bridge happens to be nearly aligned with the Landsat ground track.) |
Agriculture, Deserts | |||||||||||||||||||||||||||||||
| Pinacate Volcano Field | Earth As Art | craters, national parks, volcanoes | The pockmarked terrain of Pinacate National Park… | The pockmarked terrain of Pinacate National Park in Mexico's Sonora Province is evidence of a violent past. Among hundreds of volcanic vents and cinder cones are rare maar craters, formed when rising magma met underground water to create pockets of steam that blew nearly circular holes in the overlying crust. |
||||||||||||||||||||||||||||||||
| Pine Island Glacier | Image of the Week | ice, ice shelf, icebergs, sea level rise | ||||||||||||||||||||||||||||||||||
| Pine Island Glacier, Antarctica | Image of the Week | calving, icebergs, rifts | Another large iceberg recently broke off Pine… | Another large iceberg recently broke off Pine Island Glacier, Antarctica. According to the U.S. National Ice Center, this iceberg, named B-46, has an area of 87 square miles. That’s slightly larger than the iceberg that previously separated from the glacier in September 2017. B-46 broke away on October 29, 2018, just a month after a rift first appeared. The October 1 image acquired by Landsat 8 shows the beginning of the rift. Iceberg calving is natural part of glacial change, but these large breaks are happening more frequently on Pine Island Glacier. Since 2013, the glacier has calved four large icebergs. A Landsat 1 image from 1973 compared to 2018 shows the glacier’s retreat over 45 years. |
||||||||||||||||||||||||||||||||
| Pine Island Glacier’s Newest Iceberg | Image of the Week | calving, ice shelf, icebergs, sea level rise | Pine Island Glacier in Antarctica has snapped off… | Pine Island Glacier in Antarctica has snapped off its share of icebergs in recent years. The frequency of noteworthy breaks is evidence that the ice shelf is becoming increasingly fragile. The latest iceberg cracked off the end of the Pine Island Glacier ice shelf around September 23, 2017. Named B-44, the new iceberg covers 71.5 square miles according to the U.S. National Ice Center. B-44 is likely to remain in place until the sea ice breaks up later in the Antarctic summer. It will then drift into Pine Island Bay. Landsat 8 images one week apart in September 2017 show the iceberg separating from the end of the ice shelf and even splitting into smaller pieces. A much smaller iceberg broke off in January 2017. Other substantial breaks happened in 2013, 2014, and 2015. As Pine Island Glacier continues thinning and retreating, more inland ice will be allowed to flow to the ocean, contributing to sea level rise. The dark spot seen in this pair of images is open water, called a polynya. They form where relatively warmer ocean water rises to the surface. A cavity underneath the ice shelf, which likely formed in the 1940s, has been allowing streams of relatively warm ocean water to melt it from underneath. |
||||||||||||||||||||||||||||||||
| Pinning Points | Earthshots | calving, ice, icebergs, moraine, terminus, tidewater glacier | Air temperature increases can bring about long… |
Air temperature increases can bring about long-term loss of ice mass from a tidewater glacier. An increase of less than 2 degrees Celsius over the mean annual air temperature is all it takes to trigger glacial retreat. In fact, Alaska has seen an increase in mean annual air temperature of 1.7 degrees Celsius over the past 60 years. But once a glacier has begun retreating, temperature alone does not have as much influence on its behavior. The topography of the valley the glacier is in affects it much more. For example, the pace of Columbia’s retreat has been uneven. Its retreat slowed between 2000 and 2006 because it reached a narrow spot in its valley. This spot between Great Nunatak Peak and Kadin Peak constricted the glacier’s movement. Known as a pinning point, this topographic constriction is a place where the glacier’s trough becomes either too narrow or too shallow to continue moving at the previous rate. A pinning point can be a location of enhanced stability for the glacier. If a glacier retreats from a pinning point, it will retreat until it reaches another pinning point upstream. A glacier that remains at a pinning point for a longer time may build another moraine. Calving is also affected by the topography of the glacier’s valley, and calving rates increase in deeper water. Researchers found that as Columbia continues to retreat, it will reach water that is shallow enough to provide a stable position within a few years and remain stable through 2100. In this shallower water, iceberg production will be slowed. |
Glaciers, Water | |||||||||||||||||||||||||||||||
| Pit Lakes | Earthshots | aerial photos, iron ore, lakes, open pit, pit lakes | At the western end of the Mesabi Range is… |
At the western end of the Mesabi Range is another consequence of the mining industry. Once mining operations halted in some parts of the Range, the deep open pits that were created were left to fill with rainwater and groundwater inflow. One of these lakes is the Canisteo pit lake. At about 4.8 miles long and 0.5 mile wide, it’s about the same size as Trout Lake to the south, a natural lake. The Canisteo pit is actually a complex of 19 inactive mine pits. The lake is now an average of 100 feet deep, with its deepest point a remarkable 300 feet. (For comparison, the deepest point in Mille Lacs Lake, Minnesota’s second largest lake, is about 40 feet.) The filling of this pit lake concerns residents of the adjacent small towns. Without some kind of intervention, these towns could eventually flood. The current temporary solution is a drain tile system to carry groundwater leaving the pit toward Trout Lake. The Hill Annex Mine pit lake is also in this scene, just east of Canisteo pit lake. This lake is also very deep. Hill Annex Mine State Park is located on the lake’s shores. The USGS aerial image shows the open pit mines that are now Canisteo pit lake. The towns of Coleraine and Bovey sit between these mines and Trout Lake. |
Mining | |||||||||||||||||||||||||||||||
| Pit Production | Earthshots | copper, open pit | Production in the Escondida Mine began in 1990… |
Production in the Escondida Mine began in 1990. Total mined copper production through 2014 was 22 million tons, 21% of all copper mined in Chile. It’s easy in these images to see the extent to which the open-pit mining operation is expanding. But it’s harder to appreciate how deep the pits are. The main pit at Escondida is 645 meters deep. If you could stack two Eiffel Towers inside the pit, the top one would just barely peek over the edge. |
Deserts, Mining | |||||||||||||||||||||||||||||||
| Plant and Wildlife | Earthshots | fire scars | Wyperfeld National Park now covers 360,000… |
Wyperfeld National Park now covers 360,000 hectares, with its western half an official wilderness. The park is habitat for black-faced mallee kangaroo, desert hopping mice, 50 species of lizards and snakes, and 250 species of birds including parrots and eagles. Mallee fowl, a rare mound-nesting species almost extinct by the 1950s, also live in Wyperfeld’s vast shrubland. Much of the park’s vegetation is mallee, a type of shrubland dominated by several sparse, tall varieties of eucalyptus. These eucalyptus have large underground tubers which sprout several stems after a fire, giving the mallee its distinctive look. The vegetation ranges in structure from short heath to tall, open woodlands but is commonly a thick, impenetrable scrub forest. Areas along the river are dominated by river red gum trees, which grow in the wetter soil there, and by black box trees, which grow in the slightly drier soil. These trees act as a natural record of floods, since they germinate in wet soil. The park also has stone-forming fungi, whose rootlike feeding-threads cement the sandy soil particles into underground “stones” of up to 20 pounds. These stones incorporate black rings of ash, forming a natural archive of fires. |
Fires, Forests | |||||||||||||||||||||||||||||||
| Point Bars | Earthshots | cutoffs, erosion, rivers, sediment | The Mamoré River carries sediment from the… |
The Mamoré River carries sediment from the rapidly eroding Bolivian Andes. The steep terrain coupled with high river discharge in the Andes causes a high degree of soil erosion. The high sediment load encourages the growth of point bars, which are seen in these Landsat images as the lighter colored areas along the inside bends of the river. These sandy areas are mostly vegetation-free. Point bars increase the erosion on the opposite side of the river, causing it to further push the river’s course off to the side. These close-up images show a location on the Mamoré River where several point bars have formed. At the top of these images, this action created a cutoff. Point bars tend to increase the rate of cutoff formation. And the bends that have more sediment (pink) move more than the bends that have less. View this animation to really see this process in action. |
Water | |||||||||||||||||||||||||||||||
| Ponds | Earthshots | dry lakes, evaporation, evaporation ponds, lithium, salt, salt flat | Some dry lakes have occasional inundations… |
Some dry lakes have occasional inundations that partially dissolve the surface crusts. The center of the Salar de Atacama, however, is continually dry, so its surface is very rough. An increasing number of evaporation ponds now sprawl across the salt flat. Large amounts of lithium-rich brine are pumped to the surface from up to 30 meters below the saline crust. Canals bring the brine to ponds for efficient evaporation in this dry, windy place. Potassium chloride, potassium sulphate, boric acid, magnesium chloride, and lithium chloride are left behind. The lithium chloride is treated with sodium carbonate to produce lithium carbonate, the primary ingredient in lithium-ion batteries. The lithium concentration in the Salar de Atacama is the highest in the world. That, along with the fast evaporation rate, means the region has the planet’s largest deposit of economically recoverable lithium. Salar de Atacama has an estimated lithium content of 6.3 million tons. |
Deserts, Energy, Mining | |||||||||||||||||||||||||||||||
| Population Change | Earthshots | population, rivers | Phnom Penh is the largest city along the… |
Phnom Penh is the largest city along the Mekong River. Its population fluctuated wildly during the 1970s and 1980s; the population of 1.2 million in 1971 swelled with war refugees to 2 million or more by 1975, when it was evacuated to almost nothing by the victorious Khmer Rouge communists. From 1978 (the last year of the Khmer Rouge regime) to 1987, Phnom Penh's population is estimated to have grown from about 50,000 to 700,000 people. The 2022 population was over 2.4 million. A note on terms: Phnom Penh is pronounced p-NOM PEN. Phnom means "hill" or "mountain" in Khmer; Penh is a woman's name. More than 90% of Cambodians are ethnic Khmer, and Khmer is the national language. Cambodia has also been known as Kampuchea. |
Water | |||||||||||||||||||||||||||||||
| Populations | Earthshots | lakes, water use | About 76 million people live within 500… |
About 76 million people live within 500 kilometers (310 miles) of Lake Urmia. Residents of the region fear that what has happened to the Aral Sea is happening to Lake Urmia. The almost complete loss of the Aral Sea has had serious economic and environmental consequences. The population near Lake Urmia is denser, so more people are at risk. The city of Urmia is the gray patch in the lower left of these images. Agricultural fields spread out to the north and east of the city. The oval shape on the east side of the lake is an extinct volcano. This feature was an island as recently as 1998. A causeway and bridge completed in 2008 connects the oval and the western shore. Construction of the causeway began in 1979, was abandoned, and then started again in the early 2000s. |
Deserts, Water, Wetlands | |||||||||||||||||||||||||||||||
| Portage Diversion, Lake Manitoba | Image of the Week | lakes, rivers | ||||||||||||||||||||||||||||||||||
| Powder River Basin, Wyoming, USA | Earthshots | coal, oil, open pits, overburden, reclamation | Every day, 100 empty trains enter Wyoming.… |
Every day, 100 empty trains enter Wyoming. They leave fully loaded with coal. The United States has the largest coal reserves in the world, and much of it lies in the Powder River Basin (PRB) in Wyoming and Montana. The PRB, which lies between the Black Hills in South Dakota and the Bighorn Mountains in Wyoming, produced 43% of the nation’s coal in 2019. According to a study by the U.S. Geological Survey, the PRB contains 25 billion tons of economically recoverable coal. This does not mean it’s all mineable. The amount of economically recoverable coal can change based on mining costs and coal prices, which change based on market conditions. Nevertheless, the region has a lot of coal that is very accessible. The Black Thunder Mine and the North Antelope Rochelle Complex are two of the largest open-pit mines in the PRB. They lie within the Thunder Basin National Grassland. These mines have been expanding over the past few decades, and the land change is evident in this time series of Landsat images. |
Energy, Mining | |||||||||||||||||||||||||||||||
| Power Generation | Earthshots | hydropower, reservoirs, rivers, water use | The main purpose of the GERD is power… |
The main purpose of the GERD is power generation, and its 13 turbines are expected to produce about 16,000 GWh of electricity annually. That will double Ethiopia’s previous output of electricity and provide power to 60% of the country’s population. Recent years have provided ample rainfall in the region to fill the reservoir. But what happens during a severe drought? Even a gradual filling of the reservoir may lead to a reduction in water supply downstream, potentially affecting hydropower generation and irrigation. However, water stored in the GERD reservoir can mitigate the impacts of drought once it’s fully operational. Such water releases also generate more power. Besides power generation, the GERD will help regulate seasonal flooding, preventing destructive floods during heavy rains. And the reservoir will provide a steady supply of irrigation water for the downstream countries of Sudan and Egypt. Finding the right balance between power generation and water use downstream is the main challenge for the countries that rely on the Nile River system. |
Dams, Energy, Water | |||||||||||||||||||||||||||||||
| Process | Earthshots | dry lakes, evaporation, evaporation ponds, lithium, salt, salt flat | The brine, which at first looks like dirty… |
The brine, which at first looks like dirty slush, is pumped to the surface and sent via canals to several evaporation ponds. The dry, windy climate makes for efficient evaporation and leaves behind concentrated salts, from which lithium can be extracted. The ponds, which are about 10 feet deep, vary in color in the images because of varying amounts of salts in the water. The brighter ponds contain more concentrated salts. The deep blue ponds indicate more water content. The lithium is reduced to a concentrate and then shipped by tanker truck to a refinery on the coast in Salar del Carmen. From there, it’s on to the rechargeable battery you depend on to power your smartphone. |
Deserts, Energy, Mining | |||||||||||||||||||||||||||||||
| Proctor Lake Affected by Texas Drought | Image of the Week | drought, lakes, reservoirs, rivers | ||||||||||||||||||||||||||||||||||
| Progression of Global Vegetation | Video - LP DAAC | |||||||||||||||||||||||||||||||||||
| Pu‘u ‘Ō‘ō | Earthshots | eruption, fissure, island, lava, lava flow, volcano | The 2018 eruption was part of an ongoing… |
The 2018 eruption was part of an ongoing eruption sequence that started on January 3, 1983, with fissures breaking out along the East Rift Zone. Over the next 3 years, constant fountaining from one vent built a cone named Pu‘u ‘Ō‘ō. Eruptive activity continued from this vent until 2018, the longest East Rift Zone eruption ever recorded. Landsat images show the area around Pu‘u ‘Ō‘ō. The 2018 lava flow emerged farther along the East Rift Zone to the northeast. |
Coasts, Natural-Disasters | |||||||||||||||||||||||||||||||
| Puerto Rico after Hurricane Maria | Image of the Week | hurricanes, storms, weather | Hurricane Maria swept across Puerto Rico on… | Hurricane Maria swept across Puerto Rico on September 20, 2017, as a Category 4 hurricane and the fifth strongest storm ever to hit the United States. The hurricane’s 155 mile-per-hour winds left most of the island without power; it could take months for that power to get fully restored. This pair of Landsat 8 images shows the large-scale damage done to the island. The lush green landscape in the 2016 image is replaced by a faded green. The strong winds stripped the leaves off trees to cause the degraded landscape. The forest is expected to recover. Future Landsat 8 data acquisitions will be useful in assessing the changes caused by the winds, rain, and storm surge of the multiple hurricanes in 2017. |
||||||||||||||||||||||||||||||||
| Puerto Rico and the U.S. Virgin Islands | State Mosaics | The Caribbean island of Puerto Rico, a territory… | The Caribbean island of Puerto Rico, a territory of the United States, is only 100 miles long by 35 miles wide—about 2 ½ times as big as Rhode Island. Even though it is a U.S. territory, Puerto Rico has its own Olympic team. The largest islands in the U.S. Virgin Islands are St. Croix, St. Thomas, and St. John. |
|||||||||||||||||||||||||||||||||
| Pumping Station | Earthshots | irrigation, lakes, water use | As part of the Toshka Project, a pumping… |
As part of the Toshka Project, a pumping station sends water from Lake Nasser to irrigated fields in the Toshka basin. The Mubarak Pumping Station has a discharge capacity of 1.2 million cubic meters per hour through the Sheikh Zayed Canal. The pump house is like an island. Its 24 vertical pumps are arranged in two parallel lines. The intake channel is 50 meters deep, the deepest inland channel ever built. This innovative engineering marvel is even earthquake-proof. About 138 kilometers of canals carry the Nile water from the pumping station in Lake Nasser to irrigated fields west of the reservoir. By the 2013 image, the Sheikh Zayed Canal makes a clearly visible line to the northwest from the bay where the pumping station sits. |
Agriculture, Deserts, Water | |||||||||||||||||||||||||||||||
| Pune, India | Earthshots | impervious surface, population, streamflow, urban growth, urban heat island | A fast-growing city in India is a study area… |
A fast-growing city in India is a study area for urban impervious surface and the urban heat island effect. Located in western India about 120 kilometers southeast of the coastal city Mumbai, Pune is known as an educational and industrial center. Its population has grown from 450,000 in 1950 to nearly 8 million in 2021. People from rural areas are migrating to the city for better employment opportunities. The education and industrial sectors are also attracting people to Pune from other countries. False-color Landsat images show the steady expansion of the Pune metropolitan area. Forests cover higher elevation land, shown in bright green mostly to the west. Dull colors are shrubland and grassland, which occupy the lower elevations. However, urban land—the lavender and purple hues—has been expanding over grasslands, barren, and agricultural land. Pune’s proximity to Mumbai is also leading to its growth. The Mumbai–Pune expressway has reduced travel time between the two cities, so Pune has become a destination for those looking for housing away from Mumbai. West of Pune is the Western Ghats mountain range, a relatively low range of forested mountains. One of the peaks west of Pune reaches just over 1,220 meters (4,000 feet) of elevation. Rivers flow out of the mountain range toward the east—reservoirs along the rivers store water for the populations downstream. The Mula River and the Mutha River meet in Pune to form the Mula-Mutha River as it flows toward the east. In such a large city as Pune where the population is growing and those built-up surfaces are expanding so rapidly, the associated effects of streamflow changes and the urban heat island effect need to be measured and monitored. |
Cities | |||||||||||||||||||||||||||||||
| Putrid Sea | Earth As Art | algae, lagoons, lakes | Varied types of microalgae flourish in this… | Varied types of microalgae flourish in this colorful network of shallow, salty lagoons at the neck of the Crimean Peninsula between the Black Sea and the Sea of Azov. This natural color image portrays the unnaturally strange colors of the area known as Sivash, which is nicknamed the "putrid sea" because the algae in some of the lagoons produce a rotten smell. |
||||||||||||||||||||||||||||||||
| Puyehue Volcano | Image of the Week | ash, eruption, lava, lava flows, near-infrared, shortwave infrared, thermal, volcanoes | ||||||||||||||||||||||||||||||||||
| Queensland Flooding | Image of the Week | flooding, rivers | ||||||||||||||||||||||||||||||||||
| Racing Stripes | Earthshots | ice, moraines, snow | Glaciers move slowly, but Bear Glacier seems… |
Glaciers move slowly, but Bear Glacier seems to have racing stripes. Glaciers pick up dirt and debris from the rocks they pass. They deposit that material in accumulations called moraines. A lateral moraine is the material on the sides of a glacier. Two glaciers flowing together form a medial moraine in the middle where they join and show up as those dark stripes. When a glacier has a medial moraine, it’s made up of more than one ice flow. |
Glaciers, Water | |||||||||||||||||||||||||||||||
| Rain-Swollen Brazos River Floods Suburban Houston | Image of the Week | flooding, rain, rivers, shortwave infrared, weather | Heavy rains that began falling during Memorial… | Heavy rains that began falling during Memorial Day weekend in late May 2016 pushed the Brazos River, 30 miles southwest of Houston, Texas, toward a near-record flooding stage that hasn’t been seen since 1913, according to the National Weather Service (NWS). Shortwave infrared and red bands on Landsat 8’s Operational Land Imager (OLI) sensor reveal the river’s dramatic flooding extent on May 28, compared to two months earlier, on March 25, when the Brazos ran much more sedately past the nation’s fourth most-populous city. Just two years earlier, in 2014, the 840-mile-long river snaking through the center of Texas had gone dry in places because of drought conditions, the NWS said. As of June 1, more than 120 high-water boat rescues from buildings and cars had been reported near Houston by Fort Bend County first responders. The International Charter “Space and Major Disasters,” of which USGS and EROS are members, was activated May 31 to provide Texas Emergency Management rapid access to Landsat and other satellite data for assessing the extent of damage and helping with disaster response. With the rain expected to continue, future Landsat acquisitions will be important for that response. After almost 20 inches had fallen over parts of Texas since late May, NWS forecasters predicted up to 10 additional inches of precipitation by June 3, which would exacerbate flooding conditions along the flat, low-lying landscape of suburban Houston. |
||||||||||||||||||||||||||||||||
| Rainfall Follows Rosa | Image Comparison Sliders | flooding, hurricanes, rain, storms, weather | ||||||||||||||||||||||||||||||||||
| Rainy Days in Death Valley | Image Comparison Sliders | rain, sediment | ||||||||||||||||||||||||||||||||||
| Randolph Air Force Base | Earthshots | airports, population, urban growth | Randolph Air Force Base is visible as two… |
Randolph Air Force Base is visible as two white strips northeast of the city. The base’s streets were laid out in a series of concentric circles, with the runways along the east and west sides. This pattern can be seen in the series of Landsat images. Randolph Field was dedicated on June 20, 1930, so there is not much change to see to the base itself. What changes is the amount of residential buildup surrounding the base, development creeping in from the southwest and spilling over the north side of the base. Street patterns in residential areas are clearer in some images than in others. As trees in these neighborhoods mature, they begin to cover the streets, so you will see this progression in these images. |
Cities | |||||||||||||||||||||||||||||||
| Rapid Ice Movement | Earth As Art | ice, ice cap, islands | One glacier on Russian islands in the Arctic… | One glacier on Russian islands in the Arctic Ocean surprised scientists with its rapid change. After decades of normal, slow movement, a glacier draining Vavilov Ice Cap sprang forward, accelerating rapidly after 2013. This fast movement is extremely rare for cold-based glaciers. In 5 years, the ice tongue doubled in size. In this inverted rendition, land is blue and fractured sea ice appears tan across the top of the image. |
||||||||||||||||||||||||||||||||
| Rapid Suburban Expansion | Earthshots | lakes, suburbs, urban growth | Over the last few decades, Dallas’ urban/… |
Over the last few decades, Dallas’ urban/suburban areas have expanded rapidly by consuming arable land in the countryside. The city is expanding in almost every direction. These images show the northeastern suburbs of Plano, Allen, and McKinney. The lake on the east side of the images is Lavon Lake. |
Cities | |||||||||||||||||||||||||||||||
| Rare Clear Views | Earthshots | clouds, islands, Karman vortex street | April 19, 2009, could have been a rare clear… |
April 19, 2009, could have been a rare clear view of the island, but some of the data are missing because of Landsat 7’s Scan Line Corrector (SLC) malfunction of May 2003. Landsat 8, which launched in February 2013, has been more fortunate in its relatively short time in orbit to capture at least three clear views of the island: on March 8, 2014, March 11, 2015, and January 11, 2017. Those three images look about the same except for subtle changes to the mountain shadows caused by a different sun angle at different times of year. |
Coasts, Water | |||||||||||||||||||||||||||||||
| Rare Snow Falls at the Edge of Sahara Desert | Image of the Week | snow, weather | In mid-December 2016, a rarity occurred on the… | In mid-December 2016, a rarity occurred on the edge of the Sahara Desert in northwest Africa. It snowed. Landsat 7’s Enhanced Thematic Mapper Plus (ETM+) sensor captured the image that shows the white covering on the caramel-colored landscape southwest of the Algerian community of Ain Sefra, a town sometimes referred to as “the gateway to the desert.” All the snow except that at the highest elevations melted soon after, a fact Landsat 8 confirmed when it passed overhead on December 27. Ain Sefra’s last snowfall occurred on February 18, 1979. While snow does collect in Africa at higher elevations—Mount Kilimanjaro in Tanzania has long been crowned by a cap of snow and ice—snow on the edge of the Sahara Desert seldom falls. The average summertime temperature at Ain Sefra is 99 degrees Fahrenheit. Though winter temperatures are known to drop into the 30s, snow is as rare as the cool temperatures given that just a few centimeters of precipitation fall there annually. |
||||||||||||||||||||||||||||||||
| Rates of Decline | Earthshots | evaporation, evaporation ponds, rivers, salt, salt pan, salt ponds, saltwater, sea, sea level, water use | The Dead Sea is fed mainly by the Jordan River… |
The Dead Sea is fed mainly by the Jordan River, which enters from the north. Because of irrigation projects and other water needs upstream, the level of the Dead Sea has been falling. Much less water now enters the sea from the Jordan River. The river once brought 1.3 billion cubic meters of fresh water every year into the sea. Now it brings only about 100 million cubic meters, most of it containing agricultural runoff and sewage. These water uses have a bigger impact on Dead Sea levels than rainfall, which only amounts to an average of about 50 millimeters annually. Over the past 50 years, the level of the Dead Sea has dropped by 45 meters, and the rate of decline is increasing. From 1930 to 1973, the sea declined 17 centimeters per year. From 1974 to 1979, it dropped 62 centimeters per year, and from 1981 to 1990, 79 centimeters per year. From 1994 to 2001, the sea declined 100 centimeters per year. A 2018 report by Israel’s Ministry of Environmental Protection notes a rate of decline of 1.2 meters per year. As the water level continues to drop, the water only gets saltier. There is even a layer of salt coating the lake bottom, which has been growing about 10 centimeters thicker every year. To make matters worse, as the water retreats, sinkholes form in the salty seabed that is left behind. Studies have inventoried the sinkholes along the coast of the Dead Sea and found that the sinkholes are increasing in number, making development on this land hazardous. |
Water | |||||||||||||||||||||||||||||||
| Rattlesnake Fire, Arizona | Image of the Week | near-infrared, shortwave infrared | The 2018 fire season is already active in the… | The 2018 fire season is already active in the western United States. One of the larger wildfires so far is the Rattlesnake Fire. The blaze ignited on April 11 and has scorched over 26,000 acres on the Fort Apache Indian Reservation, San Carlos Indian Reservation, and the Apache-Sitgreaves National Forests in eastern Arizona. The Landsat 8 image acquired on April 15 shows the fire emerging from the White Mountains. The image from the European Space Agency’s Sentinel-2B satellite shows active burning on the south side of the burned area on April 25. By May 1, when Landsat 8 acquired data over the area again, the fire was mostly contained. Landsat 8’s shortwave infrared (SWIR) and near-infrared (NIR) bands combine to clearly show the distinction between burned and unburned vegetation and the active fire line expanding over time. The SWIR band is sensitive to soil and ash in burned areas, while the NIR band is sensitive to healthy vegetation. The complementary imagery from Sentinel can be used along with Landsat to monitor the greenness or recovery of vegetation after the burn. |
||||||||||||||||||||||||||||||||
| RBV Data | Earthshots | film, resolution, sensors | Roughly 138,000 images were taken by the RBV… |
Roughly 138,000 images were taken by the RBV on Landsat 3. The data were recorded to 70-mm black and white film rolls at the NASA Goddard Space Flight Center and delivered to EROS. This film, stored either on 70-mm film or in envelopes on film “chips,” is part of the EROS archive, and it’s the only copy. Only 64 of those images have been scanned from their film source for immediate download via EarthExplorer (look under Landsat Legacy in the Data Sets tab). The rest of them are there and you can find their locations, but the film would have to be scanned before you can download a high-resolution version. If a scene has not been already scanned, users can place an order to scan the film for $30 per scene. Once it’s scanned and a high-resolution digital version made available for download, it’s freely available worldwide. But as noted, any of these images have a decent chance of having geometric distortions. |
Glaciers, Mountains | |||||||||||||||||||||||||||||||
| RBV's Beginnings | Earthshots | resolution, sensors | Landsat’s RBV had an inauspicious beginning.… |
Landsat’s RBV had an inauspicious beginning. It rode into orbit on Landsat 1 on July 23, 1972. During orbit 196, just 14 days later, a relay in the Power Switching Module of the spacecraft got stuck in a permanently “on” state. The problem could have been fixed with a difficult command sequence, but the other sensor on Landsat 1, the MSS, was already showing its excellent performance and became the favored sensor for its capability to acquire near-infrared data. So the RBV on Landsat 1 was not reactivated. In the short time it operated, it recorded 1,692 images. The RBV camera that flew on board Landsat 3 was redesigned and given a slightly different mission. This RBV had a spatial resolution higher than the MSS, 40 meters, to add a new dimension to the MSS’s multispectral coverage. The higher detail could be used for detailed ground mapping. The Landsat 3 RBV acquired many thousands more images than either one on board Landsats 1 and 2. The RBV imagery is scattered across the globe, and all of it resides in the EROS archive. |
Glaciers, Mountains | |||||||||||||||||||||||||||||||
| RBV's Problems | Earthshots | ice, resolution, sensors, snow | Because of RBV’s higher spatial resolution… |
Because of RBV’s higher spatial resolution than MSS, glaciologists were able to use the RBV imagery for spotting more detail. “If you want to look at the ice front, you want to get as sharp a picture as you can,” John Dwyer, Chief of the EROS Science and Applications Branch, said. “They could map crevasses and their displacement and movement over time and map the surface velocity. Once you straighten out the geometry of the image, the RBV can still be useful.” Yes, the geometry of an RBV image had to be “straightened out.” It turns out there are a few problems inherent in the RBV data. The RBV was more like a television camera than a sensor, but television pictures tended to distort the image. Researchers using satellite imagery want the image to resemble an accurate map. They expect straight lines for latitude and longitude, for example. RBV images, however, were more like maps printed on a rubber sheet. They were easily stretched out of shape, distorting those imaginary latitude and longitude lines. These distortions could be corrected, but that would have increased processing time and cost. Furthermore, when imaging over Antarctica, RBV tended to go snow blind. Areas of high reflectance, like snow and ice, could be overexposed. Therefore, cloud cover and snow cover were easily confused. Because RBV’s main purpose was mapping the earth, the imagery included a reseau grid. No other Landsat sensors contain reseau marks. These plus signs on the images are used to correct distortions in the image after development or scanning. As John Faundeen, Archivist at EROS, put it, the reseau marks allowed you to “tie the imagery to the earth to verify the accuracy.” In all, there were officially 11 inherent problems with RBV data. Other problems include corners out of focus, occasional black vertical lines, and missing or distorted reseaus. These problems are detailed in a 1981 USGS Open-File Report. The RBV image shown in this section is in Brazil and shows a stairstep anomaly on the right side of the image. This stairstep phenomenon appears in several RBV images. |
Glaciers, Mountains | |||||||||||||||||||||||||||||||
| Re-entry | Earth As Art | erosion, plateaus | Jebel Kissu, in northwestern Sudan, emerges… | Jebel Kissu, in northwestern Sudan, emerges abruptly like an island in the vast Sahara Desert. The plateau is the eroded remnant of a granite dome. The bright linear features are truck tracks, common in the Sahara where there are no paved roads. Resembling graphic novel art style, this image could be an asteroid hurtling toward Earth, burning across a twilight sky. |
||||||||||||||||||||||||||||||||
| Re-greening | Earthshots | near-infrared, sand dunes, urban growth | Nouakchott is surrounded by a succession of… |
Nouakchott is surrounded by a succession of sand dune belts, some of which are highly mobile and can reach 20 m high. North and east of the city, a green belt was established between 1975 and 1990. Various trees and grasses were planted to curb sand encroachment. Evidence of this effort is seen in Landsat images, where the green belt actually appears red. Landsat’s ability to see various infrared wavelengths of light allows us to more easily differentiate actively growing vegetation from the urban areas and open desert. This vegetation appears red in these images because of Landsat’s near-infrared imaging capability, which reveals actively growing vegetation. This green belt has changed recently because of the city’s expansion. From 2000–2007, a new project extended the plantings around the city. During this project, 800 ha of inland dunes were stabilized with various trees and grasses. |
Cities, Deserts | |||||||||||||||||||||||||||||||
| Reactor Number 4 | Earthshots | accident, nuclear power plant, nuclear reactor | A closer look at the site of the power plant… |
A closer look at the site of the power plant in the 1986 image shows a red spot near the location of reactor number 4. The high brightness of those pixels indicates a high temperature heat source. This heat source and darkened strip that extends to the west indicate an explosion, with the reactor still emitting high heat three days later. |
Agriculture | |||||||||||||||||||||||||||||||
| Reclaiming the Land | Earthshots | coal, reclamation, strip mining | Since their start in the 1950s, the mines have… |
Since their start in the 1950s, the mines have moved, following the coal deposits. In the zoomed-in 1973 image, the mines appear in the northern part of the image. In the rest of the sequence of images, the mines shift and change shape, generally moving south. Federal law requires the restoration of mined lands to their approximate original contours. It also requires that reclaimed land support either the same or better land uses than it supported before mining. To meet this requirement the Muskingum mines, as well as other mines, are replanted to grassland, for agricultural use. The mining company replaces the topsoil, grades the soil, and applies grass seed and mulch. The mining company also planted some of this land to forest. As part of the voluntary Climate Challenge Program, the American Electric Power Company planted millions of trees on company-owned grassland. These new forests decrease the carbon dioxide in the atmosphere, control erosion, and provide habitat for wildlife. In the Landsat images, much of the reclaimed land is distinguishable from the surrounding forest. Generally, bright pink is new mined land. As land is reclaimed, it turns darker and then becomes green as the vegetation returns. |
Forests, Mining | |||||||||||||||||||||||||||||||
| Reclamation | Earthshots | bitumen, boreal forest, oil, oil sands, open pits, overburden, reclamation, tailings ponds | The mining companies are required to restore… |
The mining companies are required to restore the disturbed land to be at least as productive as it was before it was mined. Overburden that was removed for surface mining is replaced on top of the sand and sediment layer. Mining companies must ensure the overburden is not contaminated during the storage period. Native species are then planted, such as white spruce, aspen, dogwood, and blueberry. For example, a location called Wapisiw Lookout was a tailings pond from 1967 to 1997. The image series shows it later filled in by 2009, and then green by 2011. In the Sentinel-2 image provided for this series, the 20-meter resolution allows the bench pattern in the open pits to be visible. Data from satellites such as Landsat and Sentinel-2 continue to monitor the mining and reclamation of the Athabasca region. The frequent repeat cycle of these satellites—8 days for Landsat and 10 days for Sentinel—ensures that the land can be observed as it changes. |
Forests, Mining, Natural-Disasters | |||||||||||||||||||||||||||||||
| Reclamation | Earthshots | coal, mountaintop removal, overburden, reclamation, valleys | The Surface Mining Control and Reclamation Act… |
The Surface Mining Control and Reclamation Act of 1977 requires that mined lands be restored to an acceptable land cover. These images show some of the landscape returning to green after mining operations have moved on. But the contours of the land are not exactly the same as they were before mining started. Rock debris from the removal of overburden cannot be piled as high or graded as steeply as the original mountaintop. The topography ends up being leveled—the mountains are lowered and valleys raised. To avoid erosion during the reclamation process, soils are heavily compacted and then planted with fast-growing grasses. Trees are sometimes planted as well but do not grow back as quickly in this environment. Those grasses appear in these images as faded green or mottled with pink, compared to the bright green of the pre-mining dense forest. In this type of landscape, more precipitation becomes runoff than it would be in a forest. Furthermore, species diversity can lag behind natural forests, even decades later. The Sentinel-2 close-up makes that clear. A mined area on the left side of the image has returned to green after it was bright pink starting in 1986 in the Landsat imagery. But the shade of green is not yet the same dark green as intact forest. |
Mining, Mountains | |||||||||||||||||||||||||||||||
| Recovery in Iraq's 'Garden of Eden' | Image of the Week | land conversion, rivers, water use | The Marsh Arabs of southeastern Iraq have spent… | The Marsh Arabs of southeastern Iraq have spent millennia traversing the waterways at the confluence of the Tigris and Euphrates rivers. The recent history of those wetlands, however, has been one of forced loss and uneven recovery. The marshes once stretched across nearly 5,800 square miles. This Landsat 5 image from 1986 shows lush vegetation and dark waters both north and south of the Euphrates. Former Iraqi President Saddam Hussein installed dams to drain the wetlands a few years later, following a war with neighboring Iran. By 1995, the green expanses were gone. Just a few hundred square miles remained by 2001. The dams fell with Hussein’s regime in 2003, which marked the start of a slow recovery. Conditions had improved by 2015, but dry weather has persisted for several years. That changed this spring, when a flush of winter rainfall filled spaces left dry the year before. Some regard the marshes as the Biblical Garden of Eden. They were even named a UNESCO World Heritage site in 2016. Satellite imagery will remain a useful tool to monitor progress in the historic wetlands. |
||||||||||||||||||||||||||||||||
| Reflectivity of Water | Earthshots | clouds, islands, Karman vortex street | Have you noticed that in these images, clouds… |
Have you noticed that in these images, clouds look white but the ocean looks black? Both are made of the same substance, water—why would they appear as opposite colors? Landsat satellites see solar energy that reflects off the earth (or atmosphere) and back to the satellite. When light hits water, whether ocean or cloud droplet, most of the light reflects at the same angle it came in, like a basketball bounce-pass. Calm water lets the light bounce away, like a mirror, so little light reflects toward the satellite; the ocean looks dark. But a cloud’s millions of droplets bounce the light around like pinballs, so some light always scatters toward the satellite; therefore, the cloud looks bright. This is the same reason a choppy ocean with whitecaps looks brighter than a calm ocean. |
Coasts, Water | |||||||||||||||||||||||||||||||
| Register For An Account | Video - Find Data | |||||||||||||||||||||||||||||||||||
| Regrowth in Australia after Massive Bushfires | Image of the Week | burn scars, smoke | ||||||||||||||||||||||||||||||||||
| Remote Tundra | Earth As Art | lakes, tundra | Skeletal extensions of land reach like bony… | Skeletal extensions of land reach like bony fingers across a section of Liverpool Bay along the northern edge of Canada's Northwest Territories. Only small villages are thinly scattered in this remote and inhospitable region of Arctic tundra bordering the Beaufort Sea. The relatively flat landscape is dotted with shallow lakes during the extremely brief summer season. |
||||||||||||||||||||||||||||||||
| Reservoirs | Earthshots | lakes, reservoirs, urban growth | Calaveras Lake and Victor Braunig Lake are… |
Calaveras Lake and Victor Braunig Lake are artificial lakes that provide cooling water for nearby power plants. The lakes are also popular fishing and boating destinations. Two of the power plants can be seen in the images, in the crooks of the two larger lakes (Calaveras is on the right). By contrast, Mitchell Lake, west of Braunig Lake, is a natural lake. The shallow lake is on a migratory bird route and is used by over 300 species as a resting point. Because it is shallower than Braunig Lake and Calaveras Lake (average depth less than 8 feet), Mitchell Lake appears slightly blue in some images. You’ll also notice a major change just west of Mitchell Lake between the 2002 and 2013 images. The smattering of white along the western edge of the 2013 image is Toyota Motor Manufacturing Texas, a manufacturing plant for Toyota pickup trucks. The plant began operations in 2006. |
Cities | |||||||||||||||||||||||||||||||
| Residential Lakes | Earthshots | hydrology, lakes, national park, population, urban growth | A lot of the urban area consists of large… |
A lot of the urban area consists of large planned communities, often for retirees. Many of these communities incorporate artificial residential lakes. Digging out these lakes provided construction fill for roads and elevated low-lying land for development. The lakes also reduce the risk of urban flooding by capturing storm water runoff, and add aesthetic value. Comparing the images in this time series, the number of small water bodies increases substantially. The small dark shapes are scattered throughout the green shades that indicate residential areas, along with golf courses, which appear brighter green. The dark green in the lower left is the Loxahatchee National Wildlife Refuge. |
Agriculture, Cities, Mining, Water, Wetlands | |||||||||||||||||||||||||||||||
| Rhode Island | Shaded Relief | Shaded Relief Images of specific areas (generally… | Shaded Relief Images of specific areas (generally by state) have been selected from the National Elevation Dataset. For original data details, see NED. |
|||||||||||||||||||||||||||||||||
| Rhode Island | State Mosaics | The total area (land and water) of Rhode Island… | The total area (land and water) of Rhode Island is only 1,545 square miles. The state measures about 37 miles east-west, and about 48 miles north-south. |
|||||||||||||||||||||||||||||||||
| Richat Structure | Earth As Art | The so-called Richat Structure is a geological… | The so-called Richat Structure is a geological formation in the Maur Adrar Desert in the African country of Mauritania. Although it resembles an impact crater, the Richat Structure formed when a volcanic dome hardened and gradually eroded, exposing the onion-like layers of rock. |
|||||||||||||||||||||||||||||||||
| Rifts | Earthshots | ice shelves, icebergs, rifts | Ice shelves act as doorstops. They hold back… |
Ice shelves act as doorstops. They hold back the glaciers that flow to the ocean and slow them down. Even small ice shelves like Verdi help regulate the volume of ice that glaciers deposit into the ocean. Evidence of ice shelf instability can be seen in Landsat imagery. As ice shelves become thinner, rifts can form in the ice, a sign of structural weakening. In these images of Verdi, the rifts range in length from 2 to 4 kilometers. The entire shelf width is only about 10 kilometers. Landsats 8 and 9 can monitor Antarctic ice shelves with enough frequency to see if these rifts expand. The size of these rifts along with their rapid development suggests that Verdi is becoming increasingly unstable. Another characteristic of thinning seen in Verdi is ice front retreat: the result of this retreat is the front boundary of the shelf bows inward toward the center. The Verdi ice front retreated 1.5–2 kilometers from 1973 to 2001. It retreated another 2 kilometers by 2014. All of this evidence points to the real possibility of Verdi collapsing. |
Glaciers | |||||||||||||||||||||||||||||||
| Rifts & Rumples in Antarctica | Image of the Week | calving, chasm, crevasses, ice, ice rumples, ice shelf, icebergs, rifts, thermal | Landsat satellites have watched the Brunt Ice… | Landsat satellites have watched the Brunt Ice Shelf for nearly five decades. And now, Landsat 9 has joined in observing the changing surface. Major rifts have formed near a distinctive feature called the McDonald Ice Rumples. Ice rumples form when a rocky formation on the seabed impedes the flow of ice, causing pressure waves, crevasses, and rifts to form. Through this Landsat time series, the feature that causes the rumples remains stationary, while the ice shelf and its rifts flow west. In recent years, a prominent rift named Chasm 1 has approached close to the McDonald Ice Rumples. A large iceberg could form if it continues to lengthen. Estimates suggest it would cover about 17 hundred square kilometers, a little bigger than the island of Oahu. |
||||||||||||||||||||||||||||||||
| Rim and American Fires, California, 2013 | Image of the Week | national parks, smoke | ||||||||||||||||||||||||||||||||||
| Rising Water Changes Caspian Shoreline | Image of the Week | lakes, rivers | ||||||||||||||||||||||||||||||||||
| River and Ridge | Earth As Art | rivers | The Susquehanna River appears as a dark line… | The Susquehanna River appears as a dark line coursing through this scene in southeastern Pennsylvania. The cities of York, Lancaster, and Reading lie among agricultural lands. The State capital, Harrisburg, is positioned against the orange folds in the upper left of the image, along the edge of the Appalachian Mountain Ridge and Valley Province. |
||||||||||||||||||||||||||||||||
| Rivers and Rain | Earthshots | rivers | Phnom Penh lies just west of the four-river… |
Phnom Penh lies just west of the four-river intersection called the Chattomukh ("Four Faces"). From the northwest and northeast, respectively, flow the Tonle Sap and Mekong Rivers. These waters merge and split into the Basak River and the Mekong, which flow southeast to the South China Sea. The Mekong River is the 12th longest in the world, flowing 4,200 km from western China to the Mekong Delta in southern Vietnam. Every autumn, monsoon rains are too great for the Mekong to carry, and it floods a large area of Cambodia. This flood even reverses the flow of the Tonle Sab River, northward to the Tonle Sap ("Great Lake"), which can expand to ten times its normal size. This area receives 152 to 203 cm of rain annually, most of which falls during the southeast monsoons from mid-May to early October. Landsat images are effective for quantifying changes in surface water. The pair of images from 1995 shows the dramatic effect the annual flooding can have. |
Water | |||||||||||||||||||||||||||||||
| Riyadh, Saudi Arabia | Earthshots | airports, center-pivot, irrigation, population, urban growth | The modernization of Saudi Arabia has been a… |
The modernization of Saudi Arabia has been a recent and rapid phenomenon. Here we see two aspects of this transformation: explosive urbanization and center-pivot irrigation. Both are visible in and near Riyadh from 1972 to 2023. The growth of Riyadh, the national capital, is dramatic. Its population grew from about half a million in 1972 to over 7 million in 2022. Saudi Arabia experienced urbanization later than many other countries; in the early 1970s, its urban-rural ratio was still about 1:3. By 1990, that had reversed to about 3:1. The cities grew through in-migration from rural areas and from decreases in the death rate while the birth rate remained high. In the mid-1970s, Riyadh’s population was increasing by about 10 percent a year. The dark red squiggly line that winds through the western part of Riyadh is called the Wadi Hanifa, or the Hanifa Valley. This natural water course drains an area of over 4,000 square kilometers. Riyadh has been working to maintain the Wadi Hanifa as an environmental, recreational, and tourism resource. Located about 35 kilometers north of Riyadh, King Khalid International Airport opened in 1983, so it only appears in the images after that date. The two parallel runways are each 4,200 meters long. The airport occupies about 225 square kilometers. |
Cities, Deserts | |||||||||||||||||||||||||||||||
| Robinson Glacier | Earth As Art | ice | Lines and shapes etched into the surface of… | Lines and shapes etched into the surface of Antarctica's Robinson Glacier hint at the slow but inevitable movements of this giant river of ice. Patterns of lines may be icefalls, where a glacier cascades over rock, or a series of crevasses, massive cracks that form as different parts of a glacier move at slightly different speeds. Robinson Glacier flows down to the continent's coast, where glacial ice meets mammoth slabs of sea ice caught in the frigid embrace of the Southern Ocean. |
||||||||||||||||||||||||||||||||
| Rock Folding | Earth As Art | lakes, rock | This Landsat image shows how glaciers scoured the… | This Landsat image shows how glaciers scoured the landscape, gouging out depressions that formed linear lakes. The glaciers also exposed the complex folded rock layers that form the Labrador Trough of Quebec in Canada. Glacial action is evident in the fingerprint-like patterns. |
||||||||||||||||||||||||||||||||
| Rocky Mountain Trench | Earth As Art | clouds, valleys | What appears to be a stroke of thick red paint is… | What appears to be a stroke of thick red paint is actually a remarkable interplay of light and cloud in the Canadian Rockies. Angling through them is part of the Rocky Mountain Trench, a valley that extends from Montana, USA, to just south of the Yukon Territory. Low clouds filled a part of the Trench near the border between the Canadian provinces of Alberta and British Columbia. The light-reflecting nature of the clouds coupled with low sun elevation resulted in this startling effect. |
||||||||||||||||||||||||||||||||
| Rondônia, Brazil | Earthshots | logging, rain forest | The conversion of tropical rain forests to… |
The conversion of tropical rain forests to pasture and cropland is having dramatic effects on the environment. Particularly intense and rapid deforestation is taking place in the state of Rondônia, Brazil, part of which is shown in this series of Landsat images. About 30% (3,562,800 km2) of the world's tropical forests are in Brazil. The estimated average deforestation rate from 1978 to 1988 was 15,000 km2 per year. In Rondônia, 67,764 km2 of rain forest had been cleared through 2003—an area larger than the U.S. State of West Virginia. Systematic cutting of forest vegetation starts along roads and then fans out to create the "feather" or "fishbone" pattern, which begins to show in the eastern half of the 1984 image.
|
Deforestation, Forests | |||||||||||||||||||||||||||||||
| Roof of the World | Earth As Art | lakes | Central Asia's Tibetan Plateau is justifiably… | Central Asia's Tibetan Plateau is justifiably nicknamed "the roof of the world"-its average elevation is more than 4,500 meters (14,764 feet). It is the world's highest and largest plateau, covering an area roughly four times the size of Texas. Tectonic forces have long shaped the Tibetan Plateau's crumpled and uplifted mountain ridges. This scene also features some of the area's deep, glacier-fed lakes. The two largest lakes in this scene are Migriggyangzham near the upper left and Dorsoidong just below it. |
||||||||||||||||||||||||||||||||
| Rosso, Mauritania | Earthshots | desertification, highway, irrigation, sand dunes | The border area of Mauritania and Senegal in… |
The border area of Mauritania and Senegal in westernmost Africa is an example of both expanding irrigation and desertification. The international border between Mauritania and Senegal is the Senegal River, flowing westward and interrupting the arid lands to the north and south. The regional capital of southwestern Mauritania is Rosso, which is on the north bank of the river, and the town of Richard Toll ("Richard's Field" in the Wolof language) is on the south bank. The effects of a highway, which connects the regional capital Rosso to the national capital Nouakchott, on the desert is seen in the close-up images. |
Deserts | |||||||||||||||||||||||||||||||
| Rugged Terrain | Earth As Art | irrigation, rivers, streams | Hues of green and orange highlight the extreme… | Hues of green and orange highlight the extreme ruggedness of the mountainous terrain in eastern Afghanistan, near its border with Pakistan. The dark green areas on the right side along rivers indicate agricultural areas. Snow-fed streams allow sufficient irrigation to transform relatively arid soils into productive fields. |
||||||||||||||||||||||||||||||||
| Rural New York Flooding From Hurricane Irene | Image of the Week | flooding, hurricanes, storms, weather | ||||||||||||||||||||||||||||||||||
| Sabah Al Ahmad Sea City, Kuwait | Earthshots | beaches, breakwater, canals, estuary, lagoons, mangroves, marinas, marshland | In southeastern Kuwait, on the coast of the… |
In southeastern Kuwait, on the coast of the Persian Gulf, a fascinating transformation is underway. It looks kind of like what you always wished you could build when making sand castles at the beach—an intricate interconnected moat in the sand with perfect circulation to keep the water from becoming stagnant. Only this is on a grander scale. This is Sabah Al Ahmad Sea City, a city and marine ecosystem being built from scratch. Rather than build artificial islands in the sea to extend the country’s coastline, this project brings the sea to the desert. Many Kuwaitis aspire to waterside living, and Sea City will provide such opportunities, effectively doubling the length of the country’s coastline. The project’s goal is for most residents to have direct access to a beach. Planners want the city to be the seafront destination of choice for Kuwait. Sea City is eventually planned for a population of 250,000 and will have 200 kilometers of beaches. The city will also have yachting marinas and retail centers. When finished, Sea City will be about the size of Manhattan. To build the city, canals are excavated out of the salty marshland. The excavated sand is washed and then used to build up the land for residential development. In fact, the land is being built up above projected sea levels to protect people and property from flooding. This view also shows an expanding agricultural area along the Saudi Arabian border. In addition, other residential developments crop up in the inland desert areas over time. Just north of Sea City is the Al Zour thermal power plant. This gas-fired power plant and desalination plant were completed in late 2016. (Black stripes run through some of the images because of the Scan Line Corrector failure on Landsat 7 in May 2003.)
|
Cities, Coasts, Deserts | |||||||||||||||||||||||||||||||
| Sabotage | Earth As Art | rivers, volcanoes | Tranquil colors and patterns intermingle near… | Tranquil colors and patterns intermingle near Argentina’s Colorado River, which runs across the upper one-third of the image. The calming textures are interrupted by a violent splash in the center, the result of volcanic action from the Auca Mahuida Volcanic Field from long ago. |
||||||||||||||||||||||||||||||||
| Sahara Desert | Earth As Art | sand dunes | The mountainous outcrops of Jebel Auenat rise… | The mountainous outcrops of Jebel Auenat rise 6000 feet above the barren, uninhabited plains of the Libyan Desert. The frontiers of Libya, Egypt and Sudan meet amidst the rugged granite of Jebel Auenat. The mountains are remnants of an ancient granitic dome. Rivers of sand meander around them, swept across the desert pavement by northeasterly winds. |
||||||||||||||||||||||||||||||||
| Salar de Atacama, Chile | Earthshots | alluvial fans, delta, dry lakes, evaporation, evaporation ponds, lithium, salt, salt flat | If you like being connected to the world… |
If you like being connected to the world everywhere you go with a smartphone or other device, then you have a desolate salt flat in northern Chile to thank. The salt flat is the Salar de Atacama, one of the largest sources of lithium, a key ingredient in rechargeable batteries. The rectangular shapes in these Landsat images indicate where lithium mining is taking place. The increasing use of smartphones, laptops, and electric cars that use lithium-ion batteries ensures an ever higher demand for the soft, silvery metal. The salar is in Chile’s Atacama Desert, probably the driest place on the planet. Water leaves the salar only through evaporation, a process that leaves behind salts. The white color around the edge of the salt flat is clay and carbonate-rich material. The center of the salt flat consists of hard crusts of sodium chloride. Under this crust are brines that contain large amounts of lithium, potassium, magnesium, and boron. Not completely devoid of a water source, the northern part of the basin is the San Pedro River delta. The San Pedro is an ephemeral stream, delivering small amounts of surface water to the basin from the north. The water originates from the Andes Mountains after infrequent storms. These flows form alluvial fans, visible around the fringes of the salt pan. The scant vegetation appears red in these images, especially around springs at the northern edge of the salt flat. The salt flat itself covers about 3,000 square kilometers, almost the size of Yosemite National Park in California.
|
Deserts, Energy, Mining | |||||||||||||||||||||||||||||||
| Salmon River Reservoir | Image of the Week | hydropower, lakes, rain, reservoirs, water use, weather | ||||||||||||||||||||||||||||||||||
| Saloum River, Senegal | Earthshots | drought, estuaries, mangrove, rivers, tidal flats | The estuaries of the Saloum River, near the… |
The estuaries of the Saloum River, near the coast in Senegal, are surrounded by mangrove forest. These images show the forests dying between, turning from dark red to gray. The likely cause is a persistent drought, which may have increased the estuary’s salinity beyond the mangroves’ tolerance. However, there are recent indications of mangrove gain in the region. |
Coasts, Forests, Water | |||||||||||||||||||||||||||||||
| Salt and Farming | Earthshots | irrigation, lakes, rivers, saltwater, water use | Lake Urmia is a hypersaline lake. Rivers carry… |
Lake Urmia is a hypersaline lake. Rivers carry sediments and minerals to the lake, and as the lake water evaporates, the minerals remain. As a result, the salts in the lake become more concentrated and the water becomes increasingly more saline. As the lake’s water recedes, the salty lakebed is exposed. Light blue or pale shades fringe the lake’s shoreline in these images. These salt flats do not support agriculture, and this salty desert could cause windblown salt to damage nearby fields. A similar phenomenon is happening in the vicinity of the Aral Sea. Crops are grown near rivers that flow into Lake Urmia. Green fields mark these river deltas, such as the ones shown southeast of the lake. With little precipitation in this region, farming depends on irrigation from the rivers. An increasing population is putting more pressure on water resources. Much of the streamflow from these rivers no longer reaches the lake. |
Agriculture, Deserts, Water, Wetlands | |||||||||||||||||||||||||||||||
| Salt Glaciers | Earth As Art | salt | The patterns and colors in the Zagros Mountains… | The patterns and colors in the Zagros Mountains of Iran are interesting enough. For example, the infrared view provides a patina-like outline to the mountains. But something more happened to this unique landscape. Interrupting the mountain patterns are irregular dark patches called salt glaciers. What began as salt domes buried under the rock pushed up through the Earth, squeezing to the surface like toothpaste. |
||||||||||||||||||||||||||||||||
| Salty Desolation | Earth As Art | national parks, rain, salt pans | A vast, open expanse in Namibia is one of the… | A vast, open expanse in Namibia is one of the largest salt pans in the world. The pan is within Etosha National Park, protected since 1907. The horizontal line across the image is the national park fence. The wild patterns in this infrared interpretation are from numerous episodes of water evaporation following seasonal rains. The salt from the water is rearranged into new patterns every time the shallow water dries out. The surrounding blue shades are dry bushland savanna. |
||||||||||||||||||||||||||||||||
| Sampson Flat Fire, Australia | Image of the Week | burn scars | The Sampson Flat Fire started on January 2, 2015… | The Sampson Flat Fire started on January 2, 2015 near Adelaide, Australia. Hot, windy weather during the Australian summer caused the bushfire to spread quickly and move erratically. By January 7, it had burned over 120 square kilometers (46 square miles) of woodland and grassland within the steep and inaccessible terrain of the Mount Lofty Ranges. |
||||||||||||||||||||||||||||||||
| Samuel Dam, Rondonia, Brazil | Image of the Week | hydropower, reservoirs, rivers | ||||||||||||||||||||||||||||||||||
| San Antonio, Texas, USA | Earthshots | airports, highways, lakes, population, reservoirs, urban growth | These images show the metropolitan area of San… |
These images show the metropolitan area of San Antonio, Texas. According to the U.S. Census Bureau, the population of the San Antonio metropolitan area was 863,669 in 1970. By 1990, the population had grown to 1.41 million. That growth continued, with increases to 1.71 million in 2000, 2.14 million in 2010, and 2.60 million in 2021. The population change from 1990 to 2021 is an 84% increase, and in 2021, San Antonio ranked 24th in the country in population. |
Cities | |||||||||||||||||||||||||||||||
| San Cristóbal Volcano | Earthshots | volcanoes | In the lower right corner of the main images,… |
In the lower right corner of the main images, you can see Nicaragua’s San Cristóbal volcano, which shows some activity in two of the images. Ash can be seen in the 1987 and 2000 images thinly streaming from the summit. San Cristóbal is Nicaragua’s highest volcano—its summit is 1,745 meters above sea level. Small to moderate eruptions have been reported since the 16th century. You might also notice in the 2000 image another active volcano. Telica is southeast of San Cristóbal. The ash streaming from its peak is evidence of its recent activity. |
Aquaculture, Coasts, Natural-Disasters, Water | |||||||||||||||||||||||||||||||
| San Joaquin Valley, California, USA | Earthshots | evapotranspiration, irrigation, water use | Changes in land use, climate, and population… |
Changes in land use, climate, and population demographics are placing unprecedented demands on water supplies in the United States. Add frequent droughts to that list, and mapping water use in the western United States is becoming increasingly important. California’s San Joaquin Valley is one of the world’s most productive agricultural regions. Much of that productivity depends on the availability of water for irrigation. Recent prolonged droughts in California have underscored the importance of accurately monitoring changes and trends in water use in order to make well-informed water management decisions. Landsat images show some change to the farmland in this valley over time. Not visible is exactly how much water was used to irrigate those crops. That’s where evapotranspiration (ET) comes into play. ET is the combined effect of evaporation from the soil and transpiration from plants. ET is a major part of the hydrologic budget of a watershed. It varies with different climate, vegetation types, and land use. With ET estimates derived from satellite data, scientists at EROS estimated how much water is being used to water crops. They used a computer model that incorporates Landsat imagery, including the Landsat 8 thermal band, along with climate data to estimate ET for every Landsat scene of the San Joaquin Valley from 1984 to 2014. They then used the ET results along with precipitation and runoff data to create maps that show water use in the valley over that 31-year time period. The maps show seasonal crop water use in millimeters with enough detail to show individual fields and reveal which crops are using the most, or least, water. |
Agriculture | |||||||||||||||||||||||||||||||
| San Juan River | Earthshots | lakes, reservoirs, rivers | Farther upstream, the San Juan River flows… |
Farther upstream, the San Juan River flows into the Colorado River. In these narrower upstream portions of the rivers, more exposed riverbed appears in the later images. Follow the San Juan River upstream. It noticeably shrinks by 2005, and it becomes less dark in 2018. Shallower water has more sediment and that appears lighter. |
Dams, Water | |||||||||||||||||||||||||||||||
| San Julian | Earthshots | rain forest, soybeans | Taking a closer look at the San Julian… |
Taking a closer look at the San Julian settlements reveals the pattern of deforestation more clearly. Most of the settlers were from Bolivia’s western highlands, and the rest were poor farmers from the Santa Cruz department. A prolonged drought in the 1980s followed by an economic crisis led to further migration to the San Julian settlements. Settlement was much slower than expected. So even though the satellite images show rapid expansion, growth was planned to be even more rapid. The farmland is organized in a distinct pattern of nucleos. A nucleo is a square block of land, about 2,000 hectares in size. Two to four hectares in the center are designated as communal land, where a deep well for water is located. Some centers have school buildings, soccer fields, marketing centers, medical treatment posts, or cooperative stores. Planners recognized the importance of soccer by making the cancha, or soccer field, a part of the nucleo center layout in each settlement. The individual farm plots radiate outward from the central communal area and each covers just under 50 hectares. The major crops are maize, sunflowers, and soybeans. The nucleo pattern provides an area of concentrated social and economic interaction. |
Deforestation, Forests | |||||||||||||||||||||||||||||||
| San Luis, Argentina | Earth As Art | highways | Straight highways fan out like spokes on a wheel… | Straight highways fan out like spokes on a wheel from the Argentine city of San Luis. To the right of the city are croplands that resemble colorful confetti. Founded in 1594, San Luis lies at the tip of the Sierra de San Luis and is largely surrounded by flat-to-rolling fertile plains. |
||||||||||||||||||||||||||||||||
| Sand Waves | Earth As Art | erosion, rock, sand dunes | Resembling choppy waters in a rough sea, this… | Resembling choppy waters in a rough sea, this image is an infrared exposition of a sand sea in Namibia. Sand dunes surround a crescent-shaped rocky hill. This inselberg is hard rock that resisted the erosion that took place over time around it. The inselberg disrupts the deposition of sand, changing the dune pattern. |
||||||||||||||||||||||||||||||||
| Santa Cruz, Bolivia | Earthshots | rain forest, soybeans | In the 1960s, San Julian, Bolivia, was nearly… |
In the 1960s, San Julian, Bolivia, was nearly inaccessible, located deep in the thick Amazon forest. The few roads that existed were only passable during the dry season. The relatively flat lowlands make the region suited to farming. The land can be easily, and relatively cheaply, cleared with heavy machinery. The area also receives abundant rainfall and can support two growing seasons. With financial help from international organizations, Bolivia started a program to settle the area, to drive development and improve the economy. This development, however, has resulted in the deforestation of the rain forest. The San Julian settlements are conspicuous in the upper left of these Landsat images as one unique type of deforestation pattern. Other deforestation patterns emerge in the rest of the time series of images in the Bolivian department called Santa Cruz. The region has transformed from dense forest into a grid-patterned expanse of agricultural lands. Many of the fields are soybeans cultivated for export. Prices have been good for soybeans, and they are relatively easy to grow. |
Deforestation, Forests | |||||||||||||||||||||||||||||||
| Santiago, Chile | Earthshots | population, suburbs, urban growth | The rapid population growth of Santiago, Chile… |
The rapid population growth of Santiago, Chile’s capital, has brought a series of problems for the city, all of which were complicated by Chile’s unusual geography. One Landsat image spans the breadth of this narrow country, from the Pacific Ocean to Argentina. These images were taken near the end of the warm, dry summer; the mountains show only a dull red vegetation signature, and a fire appears in the 1989 image. But there are still patches of snow visible in the Andes Mountains, over 6,000 meters above sea level. In contrast, the Central Valley, between the Andes and the coastal range, shows a bright red signal from agriculture. Rivers feed into a network of canals irrigating vineyards, fruits, and vegetables. This Central Valley is the heartland of Chile and the home to 70–80% of its people. With rapid industrialization after World War II, Chile’s population urbanized earlier than many other countries, already 68% urban by 1960, 81% by 1980, and 89% by 2010. Santiago itself contains more than a third of all Chileans, and its share of the country’s economic activity is even greater. One result was some of the world’s worst air pollution. Santiago’s view of the mountains was often blocked by smog trapped in the valley by the mountains themselves. The government imposed carless Sunday mornings, regulation of the city’s 11,000 private buses, and other remedies. By the mid-1990s the air had improved. |
Cities | |||||||||||||||||||||||||||||||
| Santiago, Chile | Image of the Week | airports, land conversion, urban growth | ||||||||||||||||||||||||||||||||||
| Saudi Wheat Experiment Relied on Fossil Water | Image of the Week | center pivots, fossil water, groundwater, irrigation, land conversion, water use | In the mid-1980s, Saudi Arabia embarked on an… | In the mid-1980s, Saudi Arabia embarked on an ambitious agricultural plan to grow crops in its desert areas using ancient fossil water deep beneath the sand, and installed center-pivot irrigation systems in the barren Wadi As-Sirhan basin in the northwest part of the country. The water, which was once used to grow fruit, vegetables and wheat, was buried deep underground for thousands of years. |
||||||||||||||||||||||||||||||||
| Savanna Fires | Image of the Week | burn scars | ||||||||||||||||||||||||||||||||||
| Scorpion Reef | Earth As Art | coral | Is this a tiny creature on a microscope slide? No… | Is this a tiny creature on a microscope slide? No, but you are close. This is an image of a structure built by a multitude of small creatures. At about 21 kilometers (13 miles) wide, this feature is the largest coral structure in the southern Gulf of Mexico. The Arrecife Alacranes—or Scorpion Reef—supports wide biological diversity and is home to several endangered species. |
||||||||||||||||||||||||||||||||
| Sea Walls of Japan | Image of the Week | earthquakes, sea walls, tsunamis | An earthquake and tsunami in March of 2011… | An earthquake and tsunami in March of 2011 leveled cities and left 18,000 people dead along the east coast of Japan. The government responded with a plan to build hundreds of sea walls in hopes of protecting coastal communities from future disasters. Rikuzen-Takata was among the cities fortified after the tragedy. It was nearly destroyed by the tsunami, and that damage is clear when comparing Landsat 5 images from April of 2009 and April of 2011. False color images make the damage appear even more stark. Construction of a 41-foot-high sea wall to separate the city from Hirota Bay had begun by 2014, as seen in this Landsat 8 image from April of that year. In 2019, the completed structure stands between city and sea in the space occupied a decade ago by green trees and sandy beach. |
||||||||||||||||||||||||||||||||
| Search using Interactive Map Interface | Video - Find Data | |||||||||||||||||||||||||||||||||||
| Seasonal Changes | Earthshots | ice shelves | Landsat 8 has a 16-day repeat cycle. That… |
Landsat 8 has a 16-day repeat cycle. That means it images the same spot on the ground every 16 days. However, there is some overlap at the sides of the images, and that overlap increases at higher latitudes. Here in northern Greenland, at about 81 degrees north latitude, the repeat cycle of Landsat 8 is in reality much more frequent than every 16 days during spring, summer, and fall. Displayed in this section are several clear images available from Landsat 8 of Petermann Glacier from May 23 to September 19, 2014. As you can see by the acquisition dates, Landsat visits this spot more frequently than every 16 days. This was especially true in August and September, 2014, when there were more non-cloudy days. Seasonal changes are noticeable in this image series. For example, the high cliffs on the west side of Petermann Glacier cast longer shadows in September than on June 24, close to the summer solstice. The patterns in the ice also change throughout the year. The amount of ice in the water diminishes through September, and by the next May will be packed in again. On the ground, the amount of snow cover also decreases, but the ice fields remain. The snow cover does begin increasing again in the late September images indicating winter is returning. The later images are also darker as the sun approaches a lower angle in the sky as it gets closer to the autumnal equinox.
|
Glaciers, Water | |||||||||||||||||||||||||||||||
| Seasonal Flooding | Earthshots | floodplain, floods, river | During the flood season, the delta can grow to… |
During the flood season, the delta can grow to 20,000 square kilometers (7,700 square miles). During the dry season, it can shrink to 3,900 square kilometers (1,500 square miles). The flatness of the delta region—it drops only 8 meters (26 feet) over its entire length—leads to this large spread of water. In the images, dark blue to black areas represent open water. The water expands and then noticeably begins shrinking in December. Any bright green, which is actively growing vegetation, also begins to diminish by late December. Dark blotches in the June image are bare ground. And this is roughly what it will look like again the following June. These 2014 images show a flood level that was close to average. |
Water, Wetlands | |||||||||||||||||||||||||||||||
| Seasonal flooding in the lower Mississippi River Basin | Image of the Week | flooding, rivers | ||||||||||||||||||||||||||||||||||
| Seasonal Variations | Earthshots | islands, lake, rain, river | While the overall trend in this time series is… |
While the overall trend in this time series is a shrinking lake, the northern portion has some water in the later images, but it varies widely. Water levels there remained below the 1900–2010 mean and far below what it was in the 1960s. The region has a short rainy season, and changes in rainfall amounts can greatly affect the water supply. About 90% of the rain falls from June to September, but the lake doesn’t rise until November. This is the natural lag time of water flowing through the Chari River system. In this series of Landsat images from 2017–2018, the water rises through February and then tapers off slowly for several months. So the rise in water levels actually occurs during the dry season. Water displays as dark blue, and wetlands are green. The brighter speckles are sand dune islands. Landsat will continue to provide information about Lake Chad’s changes, its infrared imaging capability accurately delineating land, water, and wetland. |
Water, Wetlands | |||||||||||||||||||||||||||||||
| SeaWorld in San Diego | Image of the Week | buildings | ||||||||||||||||||||||||||||||||||
| Sedan Crater | Earthshots | aerial photos, craters, declassified | Historical images from the USGS… |
Historical images from the USGS EROS archive show the changing cratered landscape. A 1952 aerial photo shows that nuclear testing had already begun. A declassified satellite image from 1965 shows a more heavily cratered landscape and reveals the largest of them. A 104-kiloton nuclear device was detonated 635 feet underground on July 6, 1962. The explosion created a cavity that the surface soil collapsed into. The resulting crater, named Sedan crater, is 1,280 feet wide and 320 feet deep. Sedan crater was not the result of a weapons test, but a part of Operation Plowshare, which explored the use of nuclear detonations for peaceful purposes. The idea was to use them in the construction of canals, harbors, quarries, or other projects requiring excavation. Sedan was the second and largest Plowshare experiment. These tests went about as you would expect. A nuclear explosion could excavate a large amount of material pretty quickly, but the radiation left behind made it glaringly impractical. |
Deserts | |||||||||||||||||||||||||||||||
| Seeing Historic Route 66 from Above | Image of the Week | aerial photos, highways, national parks | Route 66 was established in November 1926. Named… | Route 66 was established in November 1926. Named “The Mother Road” by John Steinbeck, the route is a cultural icon of America, symbolizing mobility and freedom. We mark the route with this satellite mosaic and a combination of historical aerial photos and current aerial imagery from the USGS EROS Center archive. The starting point of Route 66 is in Chicago at the corner of Adams Street and Michigan Avenue. A classic landmark on the route near Amarillo, Texas, is Cadillac Ranch. The public art display consists of 10 Cadillacs lined up and half buried in the ground. The last stretch of Route 66 was decommissioned in 1984 when Interstate 40 was completed in Arizona. An aerial image shows the visitor center for Petrified Forest National Park in Arizona along I-40. The Landsat 8 image shows a broader view of the highway cutting across the desert. I-40 bypassed Winslow, Arizona, in 1977. The interstate loops around the town in the 2017 image. Cross-country travelers no longer slow down to go through the town. Route 66 then continued into California and its end point in Santa Monica. |
||||||||||||||||||||||||||||||||
| Selenga River Delta | Image of the Week | deltas, lakes, rivers | The Selenga River begins in Mongolia and flows… | The Selenga River begins in Mongolia and flows north into Russia where it empties into Lake Baikal, the world’s deepest lake. The river slows as it approaches the lake, dropping large amounts of sediment in a wide alluvial plain. The braided river flows past farm fields—the blocky shapes in the images—and to the lake. The river forms a unique delta as it carries sediment to Lake Baikal. These Landsat images show the delta in 1989 and 2015. While the overall shape of the delta has not changed significantly, a halo of sand bars surrounds the edge of the delta in the 2015 image. Varying lake levels and the river’s sediment load influence the changing shape of the delta and its sand bars. Landsat data are freely available to anyone interested in researching and monitoring changes happening to the Earth’s surface. |
||||||||||||||||||||||||||||||||
| Selkirk Island, Chile | Earthshots | clouds, islands, Karman vortex street | In September 1999, engineers at EROS were… |
In September 1999, engineers at EROS were reviewing Landsat 7 sensor output. An image grabbed their attention. Over Selkirk Island, about 500 miles off the coast of Chile, they noticed an unusual cloud pattern. They referred the image to EROS scientists, who identified the striking series of swirls as a “Karman vortex street,” a fluid flow pattern rarely seen so clearly outside of a laboratory. How did these Karman vortices develop? Selkirk Island is the tip of a volcanic peak, rising sharply from the ocean, its steep sides critical to the formation of these vortices. Though covering only 33 square miles, the island rises over a mile into the sky. On the day Landsat 7 acquired this image, the wind was carrying northward a layer of stratocumulus clouds (flat-bottomed puffballs). The mile-high island caused this cloud layer to slow about the island, while remaining fast farther out on either side. So on each “wing,” left and right, the air started rotating toward the inside—clockwise on the left, counter-clockwise on the right. The rotational momentum made each side swirl in on itself. The whorl-cores were clear because the swirling pulled dry, clear air (from above or below) into the wet layer, a bit like the funnel formed when you stir up a pitcher of orange juice. These clear, spinning pockets trailed off down the “street” from the island like soap bubbles from a toy wand—drifting downwind, weakening, filling with clouds, and breaking up. We ordinarily show as few clouds as possible in Earthshots because they block our view of the land, but in this case they do have scientific, as well as aesthetic, value. The American Meteorological Society featured the Selkirk image on the cover of their monthly bulletin. This image also became one of the earliest selections in the Earth As Art collection. |
Coasts, Water | |||||||||||||||||||||||||||||||
| Seno Plain, Mali | Earthshots | cattle, grazing, near-infrared | On the Seno Plain of Mali, the population has… |
On the Seno Plain of Mali, the population has more than doubled since 1972. In this wide view of the region, the Seno Plain sweeps from lower left to upper right. The feature to the left is the Bandiagara escarpment, with a rocky plateau to the west. The rocky surface on this plateau is not suitable for agriculture. So the plain, which is 200 meters lower than the plateau, is where there is increasing demand for agricultural land as the population grows. Growing vegetation is indicated by red tones in these Landsat images, which are visible and near-infrared composites. These images are from the dry season, so cropland is indicated by bright tones. Villages are scattered throughout the Seno Plain. They increase in size throughout the series of images. In the 1972 and 1986 images, the villages are the dark spots surrounded by a light color. Those light areas are cropland surrounding each village. In the 2016 image, the light-colored areas merge, and the dark spots stand out as the location of the villages. The population of these villages ranges from a few hundred to several thousand. |
Agriculture | |||||||||||||||||||||||||||||||
| Serene Expressions | Earth As Art | sediment | A serene gradient from red to smoky blue-gray… | A serene gradient from red to smoky blue-gray seems to mask a chaotic scene underneath, expressing a wide range of emotion. Looking like a NASA closeup of Jupiter, this image reveals sediment in the Gulf of Mexico off the Louisiana coast. |
||||||||||||||||||||||||||||||||
| Sesan River, Cambodia and Vietnam | Image of the Week | near-infrared, reservoirs, rivers | These Landsat images show the Sesan River (Tonlé… | These Landsat images show the Sesan River (Tonlé San), which runs through the boundary region between northeast Cambodia and Vietnam. The river forms an important tributary to the Mekong River, which lies to the west (not shown). The two images were acquired in 1989 (left) and again in 2014 (right).
|
||||||||||||||||||||||||||||||||
| Shanghai, China | Earthshots | aritificial islands, bridge, deltas, megacity, population, rivers, shipping ports, urban growth | A megacity is a region that has a population… |
A megacity is a region that has a population greater than 10 million. It seems the term was created for cities like Shanghai, China. In 2000, the fast-growing city was home to 16.4 million people. Shanghai’s population exceeded 24 million in 2023. It’s the 2nd largest city in China and 7th largest in the world. Shanghai sits on the Yangtze River delta along China’s eastern coast. Much of Shanghai’s growth has been in suburban and outlying districts. The Landsat imagery makes this clear as the smaller populated areas outside of Shanghai expand and then are absorbed by the urban expansion. Growth is also notable along transportation systems. Landsat data provides insight into urban planning and sustainable development. |
Cities, Coasts | |||||||||||||||||||||||||||||||
| Sharq El Owainat, Egypt | Earthshots | aquifer, calibration, center-pivot, irrigation, water use | The Landsat satellites were designed to detect… |
The Landsat satellites were designed to detect landscape changes over time. However, sometimes what Landsat needs to see on the Earth’s surface is no change at all. This is the story of a key Landsat calibration test site that is being retired as a test site because of the extensive land use change taking place in that area. |
Agriculture, Deserts | |||||||||||||||||||||||||||||||
| Shasta Lake, California | Image of the Week | burn scars, drought, lakes, reservoirs, water use | As a 3-year drought continues in the western… | As a 3-year drought continues in the western United States, water levels have been dropping in many California reservoirs, leading to emergency water use restrictions across the state. |
||||||||||||||||||||||||||||||||
| Shetland Islands | Earth As Art | islands | Like a many-faceted jewel fashioned in an indigo… | Like a many-faceted jewel fashioned in an indigo setting, the Shetland Islands lie 210 kilometers north of the Scottish mainland in the North Atlantic Ocean. Despite their 60 degree north latitude, the Shetlands enjoy a relatively temperate climate thanks to the warming influence of the Gulf Stream. |
||||||||||||||||||||||||||||||||
| Shifting Shapes | Earth As Art | Extensive farmland in northeastern China shows a… | Extensive farmland in northeastern China shows a predictable pattern of vertical shapes. But on closer inspection, the shapes begin to look more random, with variances everywhere. Look closely to be surprised by patterns and broken patterns. |
|||||||||||||||||||||||||||||||||
| Shiyan, China | Earthshots | canals, land leveling, population, reservoirs, rivers, urban growth | The population of China has been urbanizing at… |
The population of China has been urbanizing at a rapid rate. In 1978, less than 20% of China’s population lived in cities. In 2015, more than 55% of the population of China was urban, and that rate is climbing. By 2030, the country’s urbanization is projected to reach 70%. That will be about 1 billion people living in cities in China. The Shiyan Municipality, Hubei Province, presents an interesting example of urbanization. The population of Shiyan increased from 333,089 in 1990, to 724,016 in 2010, and to 879,000 in 2021. To accommodate the increased urbanization in the Shiyan region, as in other regions of China, engineers have found an innovative way to create more land for building—flattening mountaintops. This Landsat series of images shows the rapid development occurring on leveled land around Shiyan, along with changes seen to the Danjiangkou Reservoir nearby. |
Cities | |||||||||||||||||||||||||||||||
| Shoal Complex | Earth As Art | coral, islands | The main feature here, near Eleuthera Island in… | The main feature here, near Eleuthera Island in the Bahamas, is the Schooner Cays shoal complex. The tidal sand ridges, parabolic bars, and intervening channels explode in a blue rhythm. The Bahamas have the third most extensive coral reef in the world. |
||||||||||||||||||||||||||||||||
| Shoemaker Crater | Earth As Art | craters, lakes | Resembling splotches of yellow and green paint,… | Resembling splotches of yellow and green paint, salt-encrusted seasonal lakes dot the floor of Western Australia's Shoemaker impact structure. The structure was formed about 1.7 billion years ago and is currently the oldest known impact site in Australia. |
||||||||||||||||||||||||||||||||
| Shoreline Retreat Corpus Christi, Texas | Image Comparison Sliders | hurricanes, rain, storms, weather | ||||||||||||||||||||||||||||||||||
| Shrimp Farming | Earthshots | mangrove, salt flats, shrimp, shrimp farms | The area around the Gulf of Fonseca is ideal… |
The area around the Gulf of Fonseca is ideal for shrimp farming. Shrimp thrive in the warm temperatures, and extensive salt flats provide the space needed for the shrimp farms. The farms are actually holding ponds, which appear as rows of rectangles in these Landsat images. The ponds are stocked with either wild shrimp (shrimp fry) brought in from the gulf or shrimp raised in a hatchery. The vivid colors in the images reveal the varying land covers and what’s in the holding ponds. Green represents vegetation—the bright green along the coast and along waterways indicates the salt-tolerant mangrove forests. Water absorbs light, so it appears dark in these images. When active and filled, the ponds appear dark. When drained, the ponds are pink. Pink and bright white also indicate the locations of salt flats in the 1976 image. Throughout the 1980s, the Honduran government provided tax incentives to stimulate the industry and make shrimp farming profitable. This policy, along with water quality degradation, led to conflicts between the shrimp farmers and fishers. Initially, shrimp farms may have displaced some fishers. Regulation of the industry helped alleviate conflicts: agreements controlled growth of the shrimp farm industry and established protected areas. In the 1990s, expansion of the shrimp industry slowed and measures were implemented to make the industry more sustainable. Wildlife refuges were declared in many of the remaining mangrove areas. These sites help to protect the wildlife, biodiversity, and water quality of the region. |
Aquaculture, Coasts, Water | |||||||||||||||||||||||||||||||
| Shrinking Lake Meredith | Image of the Week | drought, lakes, reservoirs, rivers, water use | ||||||||||||||||||||||||||||||||||
| Siberian Ribbons | Earth As Art | lakes, rivers | Vivid colors and bizarre shapes come together in… | Vivid colors and bizarre shapes come together in an image that could be an imaginative illustration for a fantasy story. This labyrinth of exotic features is present along the edge of Russia's Chaunskaya Bay (vivid blue half circle) in northeastern Siberia. Two major rivers, the Chaun and Palyavaam, flow into the bay, which in turn opens into the Arctic Ocean. Ribbon lakes and bogs are present throughout the area, created by depressions left by receding glaciers. |
||||||||||||||||||||||||||||||||
| Sierra de Velasco | Earth As Art | Shimmering blues and greens accentuate the… | Shimmering blues and greens accentuate the textures of the Sierra de Velasco Mountains of northern Argentina. The urban area (pinkish circle) near the lower left part of the mountain range is La Rioja, the capital of the province of La Rioja. Follow the foothills to the upper right, where the city of San Fernando del Valle de Catamarca lies near extensive vineyards and fruit-growing areas (blue blocky shapes). |
|||||||||||||||||||||||||||||||||
| Singapore | Earthshots | airports, harbors, islands, land creation | “Buy land,” a wise man once said. “They’re not… |
“Buy land,” a wise man once said. “They’re not making any more.” Not so in Singapore. These images show the physical growth of this island city-nation just off the mainland of Southeast Asia. Between 1973 and 2018, the island expands where Singapore created new land for airports, shipping, and oil refineries. In all, the government of Singapore has planned to increase the island’s original area by as much as 25 percent. In these images, vegetation is green and water is blue-black. Bare soil and pavement look almost pale or pink. Singapore is often cloudy; these images, some of them with popcorn clouds, are among the clearest in the archive. Singapore was rainforest, fringed by mangrove swamps, with about 150 people when the British acquired it as a colony in 1819. It soon thrived as a trading city because it lay sheltered from storms, right at the bottleneck where ships passed from the Pacific to the Indian Ocean. In 1965, when it became independent, Singapore had almost 2 million people, crowded slums, negligible natural resources, and an economy dependent on shipping. But Singapore’s one-party government used this sense of crisis to build a wealthy, modern city by using strict controls. They lowered the birth rate, moved nine of ten Singaporeans into new high-rise condominiums, and developed new banking and manufacturing business while expanding shipping (2) even more. By 2019, Singapore had almost 5.7 million people and a high standard of living. |
Cities, Coasts | |||||||||||||||||||||||||||||||
| Sioux Falls | Earthshots | highways, population, suburbs, urban growth | The Big Sioux River flows through Sioux… |
The Big Sioux River flows through Sioux Falls, with Skunk Creek joining on the west and a diversion channel for flood control on the north. New residential and retail areas expand most noticeably to the west, south, and east. After 2000, Sioux Falls urban growth expanded outward and developed suburbs. The Tea, Harrisburg, and Brandon communities grew rapidly in population during this time. The U.S. Census Bureau estimates the 2022 population of the Sioux Falls metro area, which includes four counties, at 289,592. A quick comparison to the Dallas–Fort Worth, Texas, metro area, which is much larger, shows Sioux Falls’ population growing at a faster rate since 1970.
In these Landsat images, Landsat’s near-infrared imaging capability identifies growing vegetation in shades of red. Rural areas surrounding Sioux Falls are cropland, pastures, and small patches of forest by rivers and parks. Landsat’s near-infrared imaging makes the contrast between cropland and urban development more apparent. What’s fueling the growth? In 1980, the State of South Dakota removed a cap on interest rates. That attracted credit card companies to Sioux Falls, the state’s largest city. During the 1980s, the city’s population expanded with the growth of the financial services industry. Later, the health care industry grew into a major pillar of the Sioux Falls economy. |
Cities | |||||||||||||||||||||||||||||||
| Sioux Falls, South Dakota, USA | Earthshots | highways, population, suburbs, urban growth | A half-section of land 10… |
A half-section of land 10 miles north of Sioux Falls, South Dakota, surrounded by corn and soybean fields, is the home of the USGS Earth Resources Observation and Science (EROS) Center—and the Landsat archive. EROS has been archiving and distributing Landsat and other land data for 50 years. In that time, Landsat reveals a half-century of growth in Sioux Falls as it expands into agricultural areas. The vast EROS archive also includes historical and current aerial photography. A sample of those photos shows EROS’ location. The building opened in 1973, with an addition completed in 1996. The ponds beside the building are wastewater ponds, originally for the large amount of photo and film processing that took place at EROS up until 2005. You can also see the water tower and its shadow. Two radomes, which protect the antennas that receive data from the Landsat satellites and send commands, also sit on the property. Receiving data from the orbiting Landsat satellites is one of the main reasons EROS is located where it is. The Sioux Falls area is near the center of North America. The antennas inside the radomes can receive data from the Landsat satellites as they pass anywhere over the 48 conterminous states. With the recent launch of Landsat 9, and Landsat Next targeted for launch in 2030, EROS will remain the archive and distribution center for Landsat data for years to come. |
Cities | |||||||||||||||||||||||||||||||
| Siren, Wisconsin, USA | Earthshots | lakes, storm, tornado, weather | This Earthshots page looks at the northwestern… |
This Earthshots page looks at the northwestern corner of Wisconsin, in the crook of the St. Croix River, before and just after a tornado cut a west-to-east swath half a mile wide and more than 20 miles long. These images are shown in simulated natural color; green fields and forests are interspersed by glacial lakes, country roads, and a few popcorn clouds in the May 18 image. (The lakes look much brighter on June 19 than on May 18, most likely from the sun glinting off waves.) |
Natural-Disasters | |||||||||||||||||||||||||||||||
| Slessor Glacier | Earth As Art | ice | Slessor Glacier in Antarctica flows between the… | Slessor Glacier in Antarctica flows between the angular promontory Parry Point on the top left of the image and the Shackleton Range on the lower right. The purple highlights are exposed ice. Strong winds blow away the snow cover and expose lines that indicate the glacier flow direction. Rock outcrops next to the glacier also exhibit some of this bare ice. |
||||||||||||||||||||||||||||||||
| Sloppy Paint Job | Earth As Art | irrigation | What appear to be smatterings of paint on a wall… | What appear to be smatterings of paint on a wall represent an amalgam of human-made and natural features in southwestern Iran. The dark red shape in the center of the image is Shadegan Pond, which is the northern part of the larger Shadegan Wetlands. Red areas depict actively growing vegetation, and the rectangular shapes in the upper left reveal irrigated farmland. |
||||||||||||||||||||||||||||||||
| Snowfall, Sunshine, or Warm Air? | Earthshots | ice, snow, volcanoes | Why have these glaciers been shrinking? One… |
Why have these glaciers been shrinking? One factor is snowfall. We don’t have weather measurements from the peak until very recently, but scientists have reconstructed a general picture. In the 1880s, the East African climate became much drier. Glaciers started shrinking, and lake levels started dropping. And since the early 1900s, at three weather stations on Kilimanjaro’s southern foothills, rainfall has decreased by 27 to 39 percent. Glaciers need fresh snow for at least two reasons: to feed them with fresh ice and to provide a bright white shield between the ice and the sun. Sunshine can melt ice, even when the ambient air temperature is below freezing, by warming the surface of the ice. The same decrease in clouds that meant less snow for the glaciers also meant more sunshine. Even in 2000–2002, as scientists witnessed “strong melting” on Kilimanjaro, weather stations verified that the temperature never exceeded –1.6 degrees C. The glaciers’ sharp edges and vertical walls (2) (3) also suggest that the melting is from sunshine, not above-freezing air temperatures. Warm air is a “rounder,” melting evenly everywhere; sunshine is a “sharpener” that strikes selectively. Clear and cloudy seasons, solstices and equinoxes, and afternoon cloudiness all affect where the sun hits the ice. |
Glaciers, Mountains | |||||||||||||||||||||||||||||||
| Sockeye Fire, Alaska | Image of the Week | rivers, smoke | The afternoon of Sunday June 14, Alaskan… | The afternoon of Sunday June 14, Alaskan authorities were notified of a 40-acre fire in Willow, AK. Named the Sockeye Fire for the street where the fire began, the fire moved quickly through the black spruce forested area due to flat topography and hot, dry, windy weather. In only 48 hours, the burned area grew to about 6,500–7,000 acres. Strong north winds are expected to drive the fires to the south, threatening populated areas. Smoke could affect Anchorage, 80 miles to the south.
|
||||||||||||||||||||||||||||||||
| Solai Dam Tragedy in Kenya | Image of the Week | flooding, near-infrared, rain, shortwave infrared, weather | Heavy spring rains and widespread flooding has… | Heavy spring rains and widespread flooding has killed more than 150 people and displaced thousands in Kenya this year. The deadliest single event took place on the night of May 9, when a private dam burst open near the Rift Valley town of Solai. The dam collapse sent millions of gallons of water rushing through the fields of a 3,000-acre commercial coffee farm and into the homes downstream. More than 45 people were killed. Images built using Landsat 8’s shortwave infrared (SWIR) and near-infrared (NIR) bands highlight the water’s destructive path. The first image, acquired on May 25, 2017, shows the dam as a white speck surrounded by green vegetation and soil, which appears pink through the combination of infrared bands. The second image, captured on May 12, 2018, shows the trail of mud left behind by the dam break as it snakes west through the countryside. The farm is located 190 kilometers (118 miles) northwest of the Kenyan capital of Nairobi. Satellite imagery can be used to monitor flooding and natural disasters across the globe. |
||||||||||||||||||||||||||||||||
| Solar | Earthshots | solar, solar energy, solar power | After 2010, solar farms began spreading out in… |
After 2010, solar farms began spreading out in various places across the desert. The region has plenty of clear, sunny days, so solar energy makes its mark on the landscape (and energy grid) along with wind power. As of 2018, about 1.7 million photovoltaic panels are spread across the valley, with a combined generating capacity of 579 megawatts. Many of the locations of the solar plants are on land that had been farmed with irrigated water for decades and was unlikely to revert to its natural desert state. Nearby, the city of Lancaster is working to install solar panels on the rooftops of all municipal buildings and schools in the city. In 2013, the city council took that idea a step further. They voted to require all new homes to have a basic solar energy system. At the end of 2018, a new California state law was approved—effective 2020, all new homes statewide will have to include solar panels. |
Cities, Energy | |||||||||||||||||||||||||||||||
| Solar Park | Earthshots | artificial islands, islands, lagoons, land creation, solar panels, solar power, urban growth | Starting in the 2015 image, dark shapes cover… |
Starting in the 2015 image, dark shapes cover the desert several kilometers south of Dubai. This set of millions of photovoltaic solar panels is set to become the largest solar power plant in the Middle East, Mohammed Bin Rashid Al Maktoum Solar Park. Once finished, the $13.6 billion project could power 1.3 million homes. It is scheduled to be completed in 2030 and generate 5 GW of power. Just north of the solar park is a series of lagoons in Al Qudra. Two of the lagoons are in the shape of intertwined hearts, named Love Lake. The heart shapes are clearly visible in Landsat imagery. What is not visible with Landsat is planted trees that spell out the word “love.” |
Cities, Coasts, Deserts, Energy | |||||||||||||||||||||||||||||||
| Solovetsky Islands | Image of the Week | islands | ||||||||||||||||||||||||||||||||||
| Sor Kaydak | Earth As Art | lakes, marshes, roads, salt flats | The intricate lines angling and criss-crossing… | The intricate lines angling and criss-crossing over the landscape are roads in extreme southwestern Kazakhstan. The turquoise areas to the left are salt flats and marshes, some parts of which are submerged (dark blue). The water body is Sor Kaydak, which was once a gulf of the Caspian Sea. As water levels have dropped, curious patterns in the landscape emerged that reveal old tributaries. |
||||||||||||||||||||||||||||||||
| South America | Earth As Art | South America stretches more than 7,500… | South America stretches more than 7,500 kilometers from the warm Caribbean Sea almost to Antarctica. Waters from the eastern slopes of the Andes Mountains drain into mighty rivers, such as the Amazon, that traverse rain forests, grassy plains, and dry plateaus to eventually reach the Atlantic Ocean. |
|||||||||||||||||||||||||||||||||
| South Carolina | Shaded Relief | Shaded Relief Images of specific areas (generally… | Shaded Relief Images of specific areas (generally by state) have been selected from the National Elevation Dataset. For original data details, see NED. |
|||||||||||||||||||||||||||||||||
| South Carolina | State Mosaics | Fort Sumter National Monument in Charleston… | Fort Sumter National Monument in Charleston harbor marks the site of the first hostilities of the Civil War in April, 1861. |
|||||||||||||||||||||||||||||||||
| South Dakota | Shaded Relief | Shaded Relief Images of specific areas (generally… | Shaded Relief Images of specific areas (generally by state) have been selected from the National Elevation Dataset. For original data details, see NED. |
|||||||||||||||||||||||||||||||||
| South Dakota | State Mosaics | South Dakota is home to the fabled “Black Hills… | South Dakota is home to the fabled “Black Hills.” Seen from a distance, these pine-covered hills, rising several thousand feet above the surrounding prairie, appear black. |
|||||||||||||||||||||||||||||||||
| South Dakota’s Unplanted Acres of 2019 | Image of the Week | flooding, NDVI, rain, rivers, weather | Abnormally high spring rainfall and subsequent… | Abnormally high spring rainfall and subsequent flooding in the Midwest in 2019 had a season-long impact on cropland production. Growing vegetation is green and unplanted fields are in pink hues in these Landsat images from 2018 and 2019 of southeastern South Dakota. By August 22, the U.S. Department of Agriculture reported 3.9 million “prevented planting” acres in South Dakota, more acres than any other state. Reporting acres as prevented planting is a signal to crop insurance providers that fields were too flooded to plant the crop by a certain date. Besides the unplanted fields, the 2019 image also shows the James River still flowing out of its banks. Landsat’s near-infrared and red bands can also calculate the Normalized Difference Vegetation Index (NDVI), a measure of green healthy growing vegetation. In this case, NDVI clearly illustrates the difference in cropland caused by the wet conditions in 2019. |
||||||||||||||||||||||||||||||||
| Southeast US Tornado Paths | Image of the Week | storms, tornadoes, weather | ||||||||||||||||||||||||||||||||||
| Southeastern Suburbs | Earthshots | freeways, golf courses, population, streets, suburbs, urban growth, water use | The southeastern suburb of Chandler is the… |
The southeastern suburb of Chandler is the residential area near the center of these images. It was once separated from the other suburbs—in the 1972 image, it’s completely surrounded by agriculture. Agriculture still dominates the 1984 and 1991 scenes, but by 2001, Chandler is no longer distinguishable from the rest of the rapid suburban expansion. In most of the residential areas, streets are laid out in roughly a square pattern. Most of the squares are 1 square mile in size. This pattern ends abruptly in the lower left of the images (especially noticeable beginning in 2011). This area marks the boundary of the Chandler city limits and the Gila River Indian Reservation. New freeways and freeway interchanges can also be tracked as they are built over the time series. The large interchange on the west side of the 2011 image marks the intersection of Interstate 10 and Loop 202 (the Santan Freeway). In the 2001 image, construction of the interchange and part of Loop 202 can be seen. Also prominent is the addition of several golf courses. The green grass of the fairways shows up as bright red patterns that look like sausage links, especially across the southern part of these images.
|
Cities, Deserts, Water | |||||||||||||||||||||||||||||||
| Southern California Wildfires Update | Image of the Week | burn scars, near-infrared, shortwave infrared, smoke | Santa Ana winds rapidly spread wildfires through… | Santa Ana winds rapidly spread wildfires through shrubland, tall grasses, and brush in southern California in December 2017. As of January 2, 2018, the Thomas Fire has burned 281,893 acres since starting on December 4. The fire is almost entirely contained, but not before becoming the largest fire in California’s modern history. In the Landsat 8 image acquired on December 9, smoke is carried west by strong winds, which also continued to spread fire through the dry terrain, mountain passes, and canyons. The diagonal lines are an airplane contrail and its shadow cast on the ground. Landsat 8’s December 25 image reveals the burn scar and shows how close the fire burned near Santa Barbara. The fire was 92 percent contained on January 1. Landsat’s 30-meter resolution allows detailed mapping of burn extent and severity. Its shortwave infrared (SWIR) and near-infrared (NIR) bands combine to clearly show the distinction between burned and unburned vegetation. |
||||||||||||||||||||||||||||||||
| Southern California Wildfires, December 2017 | Image of the Week | burn scars, near-infrared, shortwave infrared, smoke | Santa Ana winds rapidly spread wildfires through… | Santa Ana winds rapidly spread wildfires through chaparral shrubland, tall grasses, and brush in southern California in December 2017. The Thomas Fire burned 237,500 acres from the time it started on December 4 through December 13. A pair of images from Landsat 8 shows the area before and during the fire near Ventura, northwest of Los Angeles. Extremely dry, strong winds spread the fire aggressively and increased as they gusted through mountain passes and canyons. On the south edge of the burn scar, developed and agricultural areas slowed the spread of the fire. At the time this image was acquired, the major concern was with the northwest portion of the burned area, where the wind was carrying the fire toward other populated areas. Landsat’s 30-meter resolution allows detailed mapping of burn severity. Its shortwave infrared (SWIR) and near-infrared (NIR) bands combine to provide an accurate distinction between burned and unburned vegetation. The diagonal lines in the second image are an airplane contrail and its shadow cast on the ground from a plane that flew past just before the image was acquired. The image from the Advanced Spaceborne Thermal Emission and Reflection Radiometer (ASTER) on NASA’s Terra satellite complements Landsat imagery. The combination of visible and near-infrared bands from ASTER shows vegetation as red and the burned area as gray. Its 15-meter resolution shows the area in slightly more detail. |
||||||||||||||||||||||||||||||||
| Southern California Wildfires, USA - 2006 | Image of the Week | fire scars | ||||||||||||||||||||||||||||||||||
| Southern Coast of France | Earth As Art | port | France's famed Provence region meets the… | France's famed Provence region meets the Mediterranean as a gentle curve intricately sculpted into sheltered bays and fringing peninsulas. The ancient port of Marseilles, the country’s second largest city, nestles in the large bay at the lower left corner of the image. |
||||||||||||||||||||||||||||||||
| Southern Delta | Earthshots | floodplain, floods, river | The Inland Niger Delta lies in the transition… |
The Inland Niger Delta lies in the transition between a seasonally wet-and-dry climate in the south and a mostly dry climate at the edge of the Sahara. Therefore, the northern and southern parts of the delta have different characteristics. The southern portion of the delta is a vast alluvial plain. The floodplains fill during the flood season. The water level rises between June and November. The water then flows north and the floodplains empty by early the next year. The rainy season here begins in July and continues through October. The mean annual precipitation is 600 mm (23.6 inches). (Black stripes run through the 2011 image because of the Scan Line Corrector failure on Landsat 7 in May 2003.) |
Water, Wetlands | |||||||||||||||||||||||||||||||
| Southern Expansion | Earthshots | highways, population, suburbs, urban growth | Since we’re comparing rate of change in… |
Since we’re comparing rate of change in population growth since 1970, Harrisburg, south of Sioux Falls, has an even more impressive number: a 2,400% increase since 1970. Construction of the current high school was completed in 2009. These Landsat images show new roadways being built to connect outlying communities to the main urban area. The bright straight line in the 2022 image is the widening of a road to connect Sioux Falls to Harrisburg. Landsat will continue to record the urban expansion of Sioux Falls and other cities around the world.
|
Cities | |||||||||||||||||||||||||||||||
| Southern Flevoland and Markerwaard | Earthshots | artificial islands, dikes, lake, land creation, land reclamation, polders | Southern Flevoland, the southernmost of the… |
Southern Flevoland, the southernmost of the polders, was the last to be diked and drained. In 1964, the area was still covered with water. By 1973, it had been drained and the soil was being cultivated to make it suitable for commercial agriculture. The 1987 image shows Southern Flevoland covered with active farming, virtually indistinguishable from the neighboring farmlands. The dike separating Markermeer from the rest of the IJsselmeer was complete by 1987. However, Markermeer was never drained and instead was left as a large basin of water and swirling silt. In 2016, a new project began to build artificial islands to clean up Markermeer and restore wildlife habitat. The Marker Wadden Restoration Project aims to build 100 square kilometers of new land. It will include an archipelago with marshes and mudflats built from the lake’s accumulated sediment. The project will create habitat for cormorants, osprey, white-tailed eagle, European beaver, European otter, and other wildlife. |
Agriculture, Coasts, Water | |||||||||||||||||||||||||||||||
| Southwestern Abstract | Earth As Art | plateaus | Abstract figures seem to appear on these South… | Abstract figures seem to appear on these South American plateaus. It is reminiscent of Southwestern artistic style with a modernist abstract twist. These farm fields are on the tops of plateaus in northeastern Brazil. Where the edges of the fields are ragged lines, the fields have been planted right up to the edge of cliffs. |
||||||||||||||||||||||||||||||||
| Southwestern Las Vegas | Earthshots | airport, golf courses, highways, population, suburb, urban growth, water use | Zooming in on the southwestern portion of the… |
Zooming in on the southwestern portion of the city reveals further urban and suburban changes. McCarran International Airport expanded in this timeframe to accommodate the population and tourism growth. One way to expand an airport is to pour a lot of concrete. Compare the 1986 and 1992 images. The addition of east-west runways can be clearly seen. You can also see the addition of a new terminal and gates in the 2000 image, located to the east (right) of the present terminal. These “D” gates opened in 1998. The 2010 image reveals additional expansion of the “D” gates, as they take on the final X shape. More new golf courses show up in this part of the urban area throughout the images. For example, the Rhodes Ranch Golf Club shows up in the 2000 image just south of where a new highway curves in the western part of the image. In the 2022 image, it’s surrounded by residential areas. Landsat data can help people in fast-growing cities plan for future growth. In the western part of the 2000 image, we see the newly completed highway, Clark County 215. Compare the 2000 image and the 2023 image: what effects do new highways have on a location? Suburbs often develop along main highways, and the growth of residential and retail areas near and along the new highway demonstrate that type of urban growth. |
Cities, Deserts, Water | |||||||||||||||||||||||||||||||
| Space Needle and Experience Music Project | Image of the Week | buildings | ||||||||||||||||||||||||||||||||||
| Spilled Paint | Earth As Art | salt marshes | Like poster paints run wild, this image reveals… | Like poster paints run wild, this image reveals an eclectic montage of landscapes in Iran's largest desert, the Dasht-e Kavir, or Great Salt Desert. The word kavir is Persian for salt marsh. The almost uninhabited region covers an area of more than 77,000 square kilometers (29,730 square miles) and is a mix of dry streambeds, desert plateaus, mudflats, and salt marshes. Extreme heat, dramatic daily temperature swings, and violent storms are the norm in this inhospitable place. |
||||||||||||||||||||||||||||||||
| Springfield | Earthshots | caterpillar, defoliation, drought, insect infestation, moth, tornado | The overall severity of gypsy moth defoliation… |
The overall severity of gypsy moth defoliation was less in 2018, but the impacts on forest condition are still evident as both new defoliation and tree mortality. Between Springfield, Massachusetts, and the Quabbin Reservoir, changes in forest condition resulting from three years of above-average gypsy moth activity is revealed by Landsat imagery. In fact, Landsat can detect both short-term and long-term forest disturbance of various causes. The gypsy moth outbreak is caused in part by an extreme weather event—drought. The pale horizontal line extending to the east from Springfield is the path of a tornado that touched down on June 1, 2011. Tornadoes are also an extreme weather event and unusual for this area. The gypsy moth caterpillar has a larger effect on dominant species like oak, which can cause large-scale shifts in the very composition of the forest. With Landsat data and the resulting maps of infested areas, researchers can better understand the long-term impacts of outbreaks on the health of forests. |
Forests, Natural-Disasters, Wildlife | |||||||||||||||||||||||||||||||
| St. Bernard Parish | Earthshots | canals, flooding, hurricane, lake, river, storm, weather | The Mississippi River Gulf Outlet (MRGO) was… |
The Mississippi River Gulf Outlet (MRGO) was built in the 1950s and 1960s as a shorter shipping route from New Orleans to the Gulf of Mexico. The 76-mile (122-kilometer) ship channel runs from northwest to southeast across these images. MRGO was one of the first levees to fail and flooded the neighborhoods visible in the upper left of the images. Sections of the MRGO levees crumbled early in the morning of August 29. Notice how MRGO and other levees to the north form a < shape. Floodwaters from the Katrina storm surge funneled along this route and into the city. A short time later, a second line of levees meant to protect St. Bernard Parish failed and floodwaters quickly filled those neighborhoods. The funnel effect amplified the storm surge by 20 to 40 percent. The resulting catastrophic flooding hit St. Bernard Parish and the Lower 9th Ward of New Orleans. |
Cities, Natural-Disasters, Water, Wetlands | |||||||||||||||||||||||||||||||
| Stapleton | Earthshots | airport, freeways, urban growth | Stapleton Airport near downtown Denver served… |
Stapleton Airport near downtown Denver served the city since 1929. By the 1980s, it was becoming overburdened and could no longer meet the needs of the growing city. Surrounded by urban development, it could not expand. Once the new airport went into operation 1995, Stapleton Airport closed. Eventually, all the buildings were demolished—except for one. The control tower still stands. It is now a restaurant, and visitors can enjoy great views of the city atop the 12-story tower. The rest of the land of the airport became part of one of the largest urban redevelopments in the country. Stapleton is now a growing master-planned community with a combination of residential, retail, commercial, and plenty of green space. The residential areas include apartments, townhomes, rowhouses, and larger single-family houses to make it a mixed-income region. Consisting of 12 neighborhoods, each with its own character, Stapleton’s population grew from 5,000 in 2006 to 28,000 in 2018. |
Cities | |||||||||||||||||||||||||||||||
| Station Fire, California | Image of the Week | burn scars, drought, smoke | ||||||||||||||||||||||||||||||||||
| Storm amid the Calm | Earth As Art | craters | Even with the calming blue tones, there is an… | Even with the calming blue tones, there is an unsettling feeling in the jagged marks that lead to a circular feature. This feature is Gweni-Fada Crater, a meteorite impact crater in the Ennedi Plateau of northern Chad. In addition to the tension between calm and storm, there is a sense that this scene could pass as a view on another planet. |
||||||||||||||||||||||||||||||||
| Storms | Earthshots | barrier islands, erosion, islands, sediment, storm surge, storms, weather | Ocean currents, and the sediments they… |
Ocean currents, and the sediments they transport, have constantly shifted the Cape Cod barrier islands over time. Some of the abrupt changes, however, can be linked directly to a storm. For example, a nor’easter in January 1987 cut a new inlet through North Beach and formed South Beach Island. South Beach connected to the mainland by 1993. Throughout the rest of the 1990s and early 2000s, South Beach reached southward toward South Monomoy and eventually connected to it. In 2007, a nor’easter cut another new inlet through North Beach. This storm also wiped out several beach houses. Another abrupt change happened in February 2013 when a storm cut a new inlet through South Beach. All of these changes can be seen in the Landsat image that corresponds to the year in which the storm occurred. |
Coasts, Water | |||||||||||||||||||||||||||||||
| Stream Restoration in Iowa | Image of the Week | aerial photos, creeks, land conversion, springs, streams | A small watershed restoration project proves that… | A small watershed restoration project proves that land farmed for half a century can be returned to a previous state. In 2002, a scientist from Minnesota bought 98 acres in northeastern Iowa, most of it annually tilled cropland. The land included the confluence of Duck Creek and Waterloo Creek. He observed soggy patches of ground during wet periods and marked the locations with flags. He then found an aerial photo from the 1940s, before the land was converted to cropland. It showed a short stream meandering across the land, matching where he had placed his flags. That spring-fed stream had been diverted to a ditch along a roadside. The water was diverted east to Duck Creek to make way for the crops. By 1975, hardly a trace of the original stream is evident. In 2002, a color-infrared view shows the tilled crop field, with growing vegetation shaded red. By 2004, the spring, which pours out a gallon of cold clear water each second from a deep aquifer, turned back to its original course. Volunteers planted prairie cord grass to stabilize its banks. The area near the stream was also seeded with additional species of native grasses. Recent photos show a newly healthy stream, now named Brook Creek, and restored prairie with a new home within it. The EROS archive includes historical and current aerial photos, available for free download for anyone at https://earthexplorer.usgs.gov/. |
||||||||||||||||||||||||||||||||
| Studying Phenology with Patrick Hostert | Video - Landsat | |||||||||||||||||||||||||||||||||||
| Stump Lake | Earthshots | flooding, floods, lakes, rivers | East of Devils Lake is Stump Lake. It becomes… |
East of Devils Lake is Stump Lake. It becomes part of Devils Lake at a water level of about 1,447 feet (441 meters) above mean sea level. By the 2011 image, a channel connects the two water bodies. When Devils Lake reaches a level at which it overflows, 1,458 feet (444.4 meters) above mean sea level, water would spill from Stump Lake through Tolna Coulee into the Sheyenne River. The U.S. Army Corps of Engineers completed a control structure at Tolna Coulee in 2012. The Tolna Coulee control structure is essentially a dam designed to prevent uncontrolled overflow from Stump Lake. An uncontrolled overflow could cause significant flooding damage downstream. Furthermore, water in Stump Lake has more sulfates than the water in western Devils Lake. Large volumes of water flowing uncontrolled through Tolna Coulee could cause water quality problems for communities downstream. |
Dams, Water | |||||||||||||||||||||||||||||||
| Submerged Dunes | Earthshots | lakes, sand dunes, water use | These close-ups of one of the larger lakes… |
These close-ups of one of the larger lakes show how the formation and reduction of the lakes affected sand dunes.
|
Agriculture, Deserts, Water | |||||||||||||||||||||||||||||||
| Sugar Plantations | Earthshots | electricity, hydropower, irrigation, lakes, reservoirs, rivers, sugar plantations | About 160 kilometers downstream from the dam… |
About 160 kilometers downstream from the dam are large irrigated sugar plantations. Made possible by the dam, land clearing for these plantations began in 2012. In the imagery, the plantations are the blocky shapes near the Omo River. According to one source, 100,000 hectares of land are planned for sugar plantation development. Sugarcane has a high water requirement. These plantations and associated agro-chemicals for this irrigation and the plans to build two more dams on the Omo River have many concerned about the long-term effects on Lake Turkana and the livelihoods of people who rely on the water supply to the lake provided by the Omo River. Tribal communities in the lower Omo and Lake Turkana region rely on traditional farming, herding, and fishing, activities that depend on the water and nourishing floods from the Omo River. Landsat helps communities track landscape change and the effects of large hydroelectric and irrigation projects, wherever they are in the world. |
Agriculture, Dams, Energy, Water | |||||||||||||||||||||||||||||||
| Sulaiman Mountains | Earth As Art | The Sulaiman Mountains are a major geological… | The Sulaiman Mountains are a major geological feature of Pakistan and one of the bordering ranges of the Indian subcontinent. |
|||||||||||||||||||||||||||||||||
| Summer Fires Rage Across California | Image of the Week | burn scars, infrared, smoke | As fire season continues in the western United… | As fire season continues in the western United States let's look back at a number of incidents tracked by officials across California in August. These fires were captured during the day by Landsats 7 and 8, in natural color bands of the visible spectrum. Landsat sensors also record infrared wavelengths revealing burn scars and active fires. Natural color images show smoke, wind direction, and fire proximity to nearby communities. Infrared scenes emphasize each fire's growing footprint. Landsat 8 also captured a number of nighttime infrared images. Only active flames and hot spots are visible in these scenes. The LNU Complex Fire was primarily ignited by lighting in areas with very little rainfall. The fire had scorched more than 356,000 acres by the time this imagery was collected. The SCU Complex Fire south of San Francisco had burned more than 300,000 acres by August 18th. Many of California's summer fires appear as dark burn scars in this image, a wide area capture from the Indian Space Resource Organization's Resourcesat. Satellite records like these continue to play an important role in the observation and management of wildfires across the planet. |
||||||||||||||||||||||||||||||||
| Summer Pools Appear in Antarctica | Image of the Week | ice shelf, meltwater | Landsat recently captured the most widespread… | Landsat recently captured the most widespread meltwater pooling ever recorded on Antarctica's George VI Ice Shelf. Some melting is expected during the Antarctic summer, but the sheer extent of the stunning aqua ponds that have appeared amid the continent's warmest summer on record is remarkable. Ponds appeared two years earlier in some of the same locations, but most of the ice shelf remained frozen. In 2020, the pools stretched across some 90 miles by January 19th. NASA scientists noted that the image represented the most extensive ponding captured across the nearly 50 year Landsat record. |
||||||||||||||||||||||||||||||||
| Sundays River Valley, South Africa | Image of the Week | irrigation, water use | Near the southernmost tip of Africa lies the… | Near the southernmost tip of Africa lies the Sundays River Valley, an agricultural area rich in citrus fruit production. Urban settlements and orchards in the subtropical climate are aided by a well-developed irrigation system that was established in the early 1920s with the construction of a dam upstream of the area shown in these images. |
||||||||||||||||||||||||||||||||
| Super Pit | Earthshots | airport, gold, open pit, ore, tailings ponds | The … |
The Super Pit, the largest open-pit gold mine in Australia, is 2.2 miles long, a mile wide, and 2,000 feet deep. Active 24 hours a day, 7 days a week, huge trucks haul over 200,000 tons of rock and dirt out of the pit every day. The ore is crushed and water added to form a mud-like slurry, which is pumped to flotation cells. Air is added to the slurry and a froth forms on the surface, which contains all of the gold. The waste is called tailings and is discharged into ponds, visible as the polygons east and north of the Super Pit in the Landsat images. Large quantities of ore need to be moved to get to the gold. This is done with blasting, but with Kalgoorlie-Boulder so close to the mine, techniques are used to minimize the impact of the blasting on the population. Blasting is generally done only at certain times of day, and wind direction and speed are considered before a blast. Additionally, smaller blasts are used, a strategy that takes more time to remove the desired amount of rock, but minimizes dust, vibration, and “fly rock.”
|
Mining | |||||||||||||||||||||||||||||||
| Surveying the Mangrove Forests of Pohnpei | Video - EROS | |||||||||||||||||||||||||||||||||||
| Svalbard, Norway | Earthshots | fjord, islands | Fourteen tidewater glaciers flow into Hornsund… |
Fourteen tidewater glaciers flow into Hornsund Fjord, on the southern tip of Spitsbergen, the largest island of the Svalbard Archipelago, located about 700 kilometers north of mainland Norway in the Arctic Ocean. During the past few decades, these glaciers have retreated substantially. In 1984, four glaciers formed a single terminus at the eastern end of Hornsund: Storbreen, Hornbreen, Svalisbreen, and Mendelejevbreen. By 2010, the glaciers had retreated far enough to each have a separate terminus into the fjord. The main driver of this glacial retreat is increasing average temperatures. The melt season in Svalbard grew two weeks longer between 1912 and 2010. The near-infrared imaging from Landsat clearly shows changes to these glaciers. The long record from Landsat is especially crucial to tracking the changes and projecting what may happen to the glaciers in the near future. |
Glaciers | |||||||||||||||||||||||||||||||
| SvalSat | Earthshots | islands | Nearby on Spitsbergen is an extensive… |
Nearby on Spitsbergen is an extensive satellite ground station. Located just 1,200 kilometers south of the North Pole and established in 1996, the Svalbard Satellite Station, or SvalSat, was chosen for its extreme northern location. It is the only commercial ground station that can support polar orbiting satellites every time they orbit the Earth, about 14 passes per day. It’s an advantageous place for satellite control and downloading data. When polar-orbiting satellites pass within range of the SvalSat station, data is downlinked directly from the satellite. The antennas receive data for about 15 minutes; then the fast-moving satellites pass out of range. Currently, the facility has more than 40 antennas to support several satellite missions. SvalSat is a valuable member of Landsat’s International Cooperators network. SvalSat provides more contact opportunities with polar-orbiting satellites and more frequent download opportunities of data from Landsat as well. Landsat data can be sent electronically from SvalSat to its primary archive at the USGS Earth Resources Observation and Science (EROS) Center in Sioux Falls, SD, in a matter of hours. Fiber optic cables under the ocean provide the data link from Svalbard to the satellite station at Tromsø, a city on the northern mainland of Norway, and then on to EROS. In this way, SvalSat is a valuable safety net for receiving Landsat data and providing flexibility during potential down times at other ground stations. The Landsat 8 image showing SvalSat takes advantage of long hours of daylight in the summer at this extreme northern location by collecting sunlit nighttime images. This image was acquired at 8:10 p.m. local time in Svalbard. A 10-m resolution image from the European Space Agency (ESA) Sentinel-2A satellite, which also sends data to SvalSat, shows the ground station in slightly higher resolution |
Glaciers | |||||||||||||||||||||||||||||||
| Swan Hills, Alberta Canada Clear Cutting and Oil Field Development | Image of the Week | burn scars, land conversion, logging, oil | ||||||||||||||||||||||||||||||||||
| Sydney, Australia | Earthshots | airports, harbors, lakes, Olympics, ports, reservoirs, urban growth | Sydney, Australia, is a growing cosmopolitan… |
Sydney, Australia, is a growing cosmopolitan city. Besides its recent growth, however, these images show that Sydney takes advantage of the natural beauty of its mountains and harbours. Except for the shoreline to the east, Sydney is surrounded by green on all sides. The deep green south of Sydney includes national parks, recreation areas, and a military reserve. These areas prevent urban development from moving that direction. Royal National Park is located along the coast of the Tasman Sea just south of Sydney. Over the past several decades, Sydney’s expansion has been mostly westward, toward the Blue Mountains.
Fact: Australia is the 6th largest country in the world. But it has the 3rd lowest population density with just under 3 people per square kilometer. About one-fifth of the country’s population lives in Sydney. |
Cities, Coasts | |||||||||||||||||||||||||||||||
| Taconite | Earthshots | aerial photos, iron ore, open pit, tailings ponds | The mines on the Mesabi Range historically… |
The mines on the Mesabi Range historically extracted hematite, a rusty-red gravel-like ore. Hematite contained 50–70% iron and could be dug out of the ground and shipped right out to be made into steel. From 1890 to about 1980, 2.5 billion tons of this ore was mined here, but these “natural ores” were largely depleted by the 1980s. Landsat images acquired after 1984, however, show continued expansion of the open-pit mines. The rock being mined now is a lower grade ore called taconite, which has about 25–30% iron content. Taconite is a hard, dense rock containing a mixture of silicates and magnetite and is abundant on the Mesabi Range. New processing methods developed in the mid-20th century made taconite mining profitable. After it’s mined, the taconite is crushed into a fine powder. The magnetite is separated with magnets and agglomerated into marble-sized pellets. The finished pellets contain over 65% iron. These pellets are shipped to steel mills. Because only about one-third of the magnetite is used in the taconite production process, large amounts of tailings are generated. While the open-pit mines are visible in Landsat images, it’s the large pink/purple areas—the tailings basins—that really stand out because they take up more area. Tailings flow as slurry into these basins, which are bounded by earthen dikes. Taconite tailings particles range from the size of clay to sand. Some of the tailings may be mined again as technology develops to remove any remaining iron. The USGS aerial photo from 1953 includes a portion of the area shown in this Landsat series. The urban areas are the towns of Virginia and Eveleth. The historical aerial photos extend the imagery record back at least two decades further than the Landsat scenes. Using these photos from the collection at EROS, we can see the mining activity and associated land changes even earlier than the Landsat record. |
Mining | |||||||||||||||||||||||||||||||
| Tantibus | Earth As Art | elevation | Tantibus is Latin for nightmare. This image does… | Tantibus is Latin for nightmare. This image does appear to be a creepy, foggy, haunted scene. But there is nothing to worry about—it is just science data. The elevation data shown here, recorded by space shuttle Endeavour in 2000, are from the Rocky Mountains of Utah and Colorado. Dark areas are low elevation, and the brightest spots are the highest elevations, here representing mountaintops. |
||||||||||||||||||||||||||||||||
| Tapestry | Earth As Art | faults | Soft colors contrast with harsh terrain in… | Soft colors contrast with harsh terrain in southwestern Saudi Arabia, near the border with Yemen. Calming blues and purples seem to collide with an angry orange in this rich tapestry of colors, which are the result of the region’s complex geology. The wild shapes in this busy landscape lie in a region known as the Asharah fault zone. |
||||||||||||||||||||||||||||||||
| Tehran | Earthshots | urban growth | In the lower right of the main images is… |
In the lower right of the main images is Tehran, the capital and largest city in Iran. The plain Tehran lies in is like a bowl. High mountains are to the north, and the hills of Kahrizak are to the south. Tehran is far from any major river and relies on water supplies located at a distance from the city. In this series of images, the expansion of the city extends in all directions, especially north toward the mountains. Tehran’s population in 1986 was about 6 million. It has grown to almost 13.8 million in 2021. |
Agriculture, Cities, Mountains | |||||||||||||||||||||||||||||||
| Tennessee | Shaded Relief | Shaded Relief Images of specific areas (generally… | Shaded Relief Images of specific areas (generally by state) have been selected from the National Elevation Dataset. For original data details, see NED. |
|||||||||||||||||||||||||||||||||
| Tennessee | State Mosaics | Tennessee has had several nicknames, but the most… | Tennessee has had several nicknames, but the most popular is the “Volunteer State.” The nickname originated during the War of 1812 when volunteer soldiers from Tennessee displayed marked valor in the Battle of New Orleans. |
|||||||||||||||||||||||||||||||||
| Terkezi Oasis | Earth As Art | oasis | A series of rocky outcroppings are a prominent… | A series of rocky outcroppings are a prominent feature of this Sahara Desert landscape near the Terkezi Oasis in the country of Chad. |
||||||||||||||||||||||||||||||||
| Tessera Mosaic | Earth As Art | rivers | The Tietê River snakes across this tessera mosaic… | The Tietê River snakes across this tessera mosaic of multicolored shapes near Ibitinga, Brazil. Fields of sugarcane, peanuts, and corn vary in their stages of development. Lavender, purple, and bright blue indicate actively growing crops. Light yellow or white indicate little or no vegetation growth. The splotches of dark mustard yellow are urban areas. |
||||||||||||||||||||||||||||||||
| Texas | Shaded Relief | Shaded Relief Images of specific areas (generally… | Shaded Relief Images of specific areas (generally by state) have been selected from the National Elevation Dataset. For original data details, see NED. |
|||||||||||||||||||||||||||||||||
| Texas | State Mosaics | Six flags have flown over Texas: Spain, France,… | Six flags have flown over Texas: Spain, France, United Mexican States, Confederate States of America, the Republic of Texas, and the United States of America, with eight changes of government. |
|||||||||||||||||||||||||||||||||
| Texas Oil Field Expansion, 1984 to 2013 | Image of the Week | oil, oil wells | ||||||||||||||||||||||||||||||||||
| Texas Wildfires, USA | Image of the Week | burn scars, oil, oil wells | ||||||||||||||||||||||||||||||||||
| The "Little Desert" | Earthshots | fire scars | By the late 1800s, some Australians were… |
By the late 1800s, some Australians were trying to preserve natural lands, including the nationally symbolic “bush.” The Forest Act of 1907 established forest reserves, some on abandoned homesteads, including part of Wyperfeld in 1909. After the Second World War, the increasingly mobile and urban population desired more parks. In the 1960s, the government proposed a partial development of the “Little Desert” (visible south of the “Big Desert”); in the backlash of public outcry the plan was canceled, the Little Desert National Park was greatly expanded, and a national conservation agency was created. |
Fires, Forests | |||||||||||||||||||||||||||||||
| The 1986 Filchner Calving | Earthshots | calving, crevasses, ice, ice shelf, icebergs | Crevasses often form in ice shelves, due to… |
Crevasses often form in ice shelves, due to hinging, forward “creeping,” and other forces. The annotated 1973 image shows such a crevasse, called the Grand Chasms. In 1957, the Grand Chasms were 53 m deep, with water and ice at the bottom. They were 5 km wide in 1957, 11 km wide in 1973, and 19 km wide in 1985. (As a comparison, the Grand Canyon is up to 29 km wide.) As expected, it was at the Grand Chasms that the shelf finally broke off into icebergs in 1986. It is not completely understood how and when icebergs calve from Antarctic ice shelves. Besides hinging and creeping, calving may also be caused by storms, ocean swells, and collisions with large icebergs. The Filchner Ice Shelf may calve only once or twice a century the way it did in 1986, with little loss in between these major calvings. It moves about 1.3 km/year—fast for an ice shelf—and in the 1986 calving it shed about 40 years’ worth of advancing ice. The calved ice broke into three large icebergs, named A22, A23, and A24. A24 was about 90 km by 95 km in area and about 400 m thick. All three soon grounded in the shallow sea floor just off shore. But the wind, currents, and tide kept slowly dragging the icebergs, gouging out underwater tracks that were visible by ships’ sonar. In early 1990, A24 left its siblings behind and broke free into the deep ocean. The map of Antarctica shows its path. Because it was 400 m deep, it was less affected by wind and surface currents and more affected by deeper currents, which are harder for oceanographers to track. The Weddell Sea Gyre is such a current, running clockwise around the Weddell Sea at about 2.5 to 3 km below the surface. (A gyre, pronounced “jire,” is a circular or spiral movement.) A24 was carried by the Weddell Sea Gyre through 1991. Most icebergs would then continue with the currents eastward, along a submarine ridge which runs from the Antarctic Peninsula to the South Orkney Islands and on toward South Africa. But there are gaps in this ridge, and water “jets” through them; one of these jets carried A24 through a gap and north into the Atlantic Ocean. By shooting through the gap, A24 had left the cold waters that circle clockwise around Antarctica (the Circumpolar Current). The warmer waters of the Atlantic doomed A24; as it passed the Falkland Islands the melting, wind, and waves broke it into four pieces, which continued along the coast of South America. Smaller icebergs like these can actually be more dangerous to ships because they are harder to detect on radar. everal countries operated on the Filchner during the 20th century, building bases such as the Ellsworth, General Belgrano, and Shackleton. Druzhnaya 1 was the last, operated by the Soviet Union each austral summer from 1975 to 1986. When the A23 iceberg calved and floated off that winter, Druzhnaya 1 was still on it. In February 1987, the Soviets visited one last time, approaching the offshore iceberg in the ship Kapitan Kondrat’ev and collecting their equipment from the abandoned base. |
Glaciers, Water | |||||||||||||||||||||||||||||||
| The 1996 Rechanneling | Earthshots | delta, levees, peninsula, rivers, sediment, shrimp farms | While the river’s course and delta have… |
While the river’s course and delta have changed naturally over time, people have also caused a lot of change. More water upstream is being used for irrigation. Dams and reservoirs on the river and its tributaries reduce the amount of sediment that reaches the delta. Seawalls have been built to reclaim land for the oil industry and for shrimp and salt farms. Additionally, levees now keep the main river from branching out at the delta. People have caused the latest shift in the river that has affected the delta’s shape. In 1996, Chinese engineers blocked the main channel, making the river empty into the sea to the northeast instead of directly to the east. We see in the 1999 image where the new peninsula has formed from this shift, and where the old peninsula is beginning to retreat. |
Aquaculture, Cities, Coasts, Water | |||||||||||||||||||||||||||||||
| The Accuracy of Landsat with Jeff Masek | Video - Landsat | |||||||||||||||||||||||||||||||||||
| The All-American Canal | Earthshots | canal, irrigation, lake, river, water use | The All-American Canal (visible as the dark… |
The All-American Canal (visible as the dark line in these close-ups) is now the Imperial Valley's main source of water. It carries 26,155 cubic feet of water per second from the Colorado River to allow irrigation of more than 2,000 km2 of agricultural fields. Also noticeable in these two images is Interstate 8, which runs along the canal and occasionally crosses it. In the 2011 image, a subtle change is a road that runs along the U.S.-Mexico border—the road is part of border fence construction efforts. One clear change in these images is an area of new irrigated fields in Mexico (green circles and rectangles in the lower left). |
Agriculture, Cities, Water | |||||||||||||||||||||||||||||||
| The Aral Sea | Image of the Week | irrigation, lakes, rivers, water use | ||||||||||||||||||||||||||||||||||
| The Bay of Gibraltar | Image of the Week | ports | ||||||||||||||||||||||||||||||||||
| The Beetles Attack | Earthshots | insect infestation, mountain pine beetle, ponderosa pine | Mountain pine beetles, which are native to the… |
Mountain pine beetles, which are native to the pine forests of western North America, live most of their lives just beneath the bark of living pine trees. They usually only kill a few trees per year that are already weakened. Healthy trees have defenses that can defeat the beetles. They resist the beetles by releasing pitch, which helps prevent beetles from boring into the tree. This works when it’s only a few beetles on the tree. But the current epidemic is overwhelming their defenses. Once a pine beetle is on a host tree, it communicates to other beetles by emitting a pheromone that attracts other beetles to mass-attack. They overwhelm the tree’s defenses and tunnel under the bark. Although the tunneling injures the tree by disrupting the movement of food and water from the needles to the trunk and roots, its needles initially remain green, which makes the early stages of infestation difficult to see from the air. A year after the flow of water and nutrients has been cutoff, the tree dies and its needles turn red. A year later the dead trees take on a greyish color as the dead needles fall to the ground. An outbreak like this begins in dense, and sometimes overcrowded, forest. Climate also plays a role as warm, dry summers are good for beetle development and dispersal, while mild winter temperatures allow more larvae to survive. Successive years of favorable summer and winter weather can lead to widespread damage, which has been the case in the Black Hills. A more close-up look at the affected region shows a pronounced decrease in the amount of green forest cover between 1992 and 2018. In 2018, precipitation in the Black Hills was above normal, and the beetles have remained at normal levels. The damage is done, however, and current Landsat imagery still shows the degraded forest. Recovery in the pine forest is very gradual. |
Forests, Mountains, Wildlife | |||||||||||||||||||||||||||||||
| The Belo Monte Dam Complex, Brazil | Image of the Week | canals, hydropower, reservoirs, rivers | In northern Brazil, the Belo Monte Dam complex on… | In northern Brazil, the Belo Monte Dam complex on the Xingu River, a major tributary of the Amazon, has changed the course of the river and surrounding landscape. Construction began in 2011, and the complex began producing hydropower in 2016. When fully operational in 2018, it will have a maximum capacity of 11 gigawatts and be the world’s fourth largest hydropower plant. However, its annual average will be lower, about 4.5 gigawatts, because of seasonal low river flows. Landsat’s shortwave infrared (SWIR) bands distinguish water and land. This band combination displays the rain forest as green, and faded green is deforestation. In the 2015 image, bright areas indicate construction of the dams, canal, and dikes to contain the reservoir. The primary dam, Pimental, creates a reservoir along the river course, and a canal from that reservoir diverts 80 percent of the Xingu’s flow into another reservoir. The Belo Monte Dam and hydropower turbines are at the north end of this reservoir. At the same time, these dams have caused the original flow path of the river to dry up, affecting fish and turtles that are unique to that stretch of the river. The thousands of people who live along the river and who depend on fishing for their livelihoods have also been affected by the river’s redirection. |
||||||||||||||||||||||||||||||||
| The Causeway | Earthshots | algae, flooding, lakes, salt, saltwater, water use | One of the first flood-control measures… |
One of the first flood-control measures involved the railroad causeway, a solid raised roadway cutting east to west across the lake. The first transcontinental railroad, completed in 1869, had to go around the lake and over the Promontory Mountains to the north. In 1902, the Southern Pacific Railroad constructed a new line directly across the lake so that engines would not have to climb over the mountains. For 12 miles, this route crossed a trestle, like a low bridge, made of 28,000 wooden pilings. In 1957–1959, this trestle was replaced by the causeway—a solid raised roadway made of 50 million cubic yards of rock, sand, and gravel. This causeway was safer and allowed faster speeds. But unlike the trestle, which allowed water to circulate freely underneath for 12 miles, the causeway had only two 15-foot culverts. The causeway was constructed of semipermeable material, which reduced north-south flow and split the lake into two parts. The south part received most of the lake’s inflow from rivers, so it became higher than the north part. The northern part also became saltier, causing different types of algae and bacteria to grow, which made it look pink, while the southern part of the lake remained bluer. You should be able to see this subtle difference in the 1972 Landsat image (in this image, reflectance in the visible-red range is represented by green). By July 1, 1984, after two years of above-normal precipitation, the south part of the lake was 3.7 feet higher than the north, the highest difference it would ever reach. By August 3 of that year, a 300-foot section of the causeway was replaced by a low bridge, allowing water to flow underneath. Within 2 months, the difference between the south and north fell to 0.75 feet, and within a year it was only 0.5 feet. Although this was done as a flood-control measure, it also had the effect of reducing the difference in salt concentration. By 1987, the north-south difference visible in Landsat images was reduced. Once the levels began dropping again, a clear color distinction between the north and south arms of the lake returned. |
Water | |||||||||||||||||||||||||||||||
| The Colorado River | Image of the Week | drought, rain, rivers, water use | ||||||||||||||||||||||||||||||||||
| The Crater’s Size | Earthshots | crater, declassified, erosion, permafrost | The Landsat image series shows the gash… |
The Landsat image series shows the gash widening from a narrow channel in 1991 to a crater with steep-sided cliffs by 2022, at a resolution of 30 meters. Sentinel-2A’s 10-meter resolution in the natural color bands provides a more detailed look at the crater. Declassified satellite images from 1965 and 1975 show the spot as a mere gully. Now about 1 km long, 800 m wide, and 50 m deep, the crater also features a 70-m vertical ice wall on the southwestern edge. Covering about 81 hectares, the crater’s area has increased by three times from 1991 to 2018, with the fastest expansion taking place between 2010 and 2014. Incidentally, here's how Batagaika Crater compares in size with Meteor Crater in Arizona. How did this start? The permafrost under the warmer layer of soil began to thaw. Once the ice was exposed to warmer temperatures, the melting sped up. At Batagaika, a gully eventually formed and cut into the ice-rich permafrost. Once this process begins, it cannot be stopped. |
Forests | |||||||||||||||||||||||||||||||
| The Dardzha Monster | Earth As Art | sand dunes | Looking like a monstrous ogre with something… | Looking like a monstrous ogre with something gooey in its mouth, the Dardzha Peninsula in western Turkmenistan lies among the shallow coastal terraces of the Caspian Sea. Strong winds create huge sand dunes near the water, some of which are partly submerged. Further inland, the dunes transition to low sand plains. |
||||||||||||||||||||||||||||||||
| The Dead Sea | Image of the Week | evaporation ponds, lakes, rivers, saltwater, seas, water use | ||||||||||||||||||||||||||||||||||
| The Dhofar Difference | Earth As Art | rain | Much of Oman is desert, but the Arabian Sea coast… | Much of Oman is desert, but the Arabian Sea coast in the Dhofar region represents a startling difference in climate. This coastal region catches the monsoon rains, or khareef, during the summer months. Drenching rains fall primarily on the mountainous ridge that separates the lush, fertile areas along the coast from the arid interior, recharging streams, waterfalls, and springs that provide plentiful water supplies in the fertile lowlands for the remainder of the year. |
||||||||||||||||||||||||||||||||
| The Dike's Effects | Earthshots | algal blooms, dike, fishing, land creation, red tide, seas, seaweed, tidal flats | The Ariake Sea is famous for its nori, a type… |
The Ariake Sea is famous for its nori, a type of seaweed that is dried and pressed into dark sheets. It is used as the outer wrapping of rolled sushi or chicken nori. The Ariake Sea provides about 40% of Japan’s seaweed. The Ariake Sea has a high tidal range—about 7 meters in the spring. This range creates vast tidal flats. The tidal flats in Isahaya Bay created oxygen for the entire Ariake Sea, purifying the water. The dike has prevented this purification function from happening. This degradation of the water quality, along with changes in tidal flows, has reduced the sea’s fish population, harming the fishing industry. Failure of the former tidal flats to help purify the sea may also have led to poor seaweed crops. Farmers claim that not just quantity but also the quality of the product has been affected. Studies have found that the dike reduced current tidal mixing (stagnating the water), which could lead to increased red tide events (algal blooms). Large colonies of algae grow out of control and can be toxic to fish and marine mammals. The phenomenon is called red tide because the blooms often turn the water red. As a result, these harmful algal blooms are damaging to the fish and seaweed industry. In one study, extensive measurements of the tides and currents concluded that the dike changed the tidal system in the rest of the Ariake Sea. These weaker tidal currents led to abrupt changes in the marine environment. A red tide that occurred during winter of 2000–01 could be related to the completion of the dike. This red tide was damaging to the seaweed crop because the algae took nutrients from the water during the harvest season. Conservation organizations have been protesting the project since before construction began and are now recommending that the gates be opened to restore the health of the sea. The dike’s gates were set to open December 2013, which would have concluded a 3-year moratorium designed to allow time to determine whether opening the gates would flood key coastal areas. The intention behind opening the gates is to carry out studies to determine the effects of the dike on tidal flows and water quality in the sea. That deadline passed with no action. A long legal battle ensued, and finally, in July 2018, a court ruled that the gates should remain closed. |
Agriculture, Coasts, Water | |||||||||||||||||||||||||||||||
| The Eruption | Earthshots | ash, eruption, lakes, mudslides, rivers, volcanoes | The volcanic blast on May 18, 1980, devastated… |
The volcanic blast on May 18, 1980, devastated more than 150 square miles of forest within a few minutes. In the following nine hours, volcanic ash rose more than 15 miles into the air, later to land in troublesome amounts as far away as Montana. Sixty people were dead or missing, including one USGS volcanologist, David Johnston, who was monitoring the mountain from nearby. Before the eruption, Mount St. Helens towered about a mile above its base, but on May 18, 1980, its top slid away in an avalanche of rock and debris. When measured on July 1, 1980, the mountain's height had been reduced from 9,677 feet to 8,364 feet—a difference of about 1,300 feet. Look at the zoomed-in images. Forested areas appear red. Ash, mudslides, and mud-laden rivers are grayish blue. Water looks black. Ice and snow are white. Several changes can be seen in these images:
View an animation of a time series of Landsat images from the eruption and through gradual forest regrowth. |
Forests, Mountains, Natural-Disasters | |||||||||||||||||||||||||||||||
| The Evaporation Basin | Earthshots | flooding, lakes, salt, saltwater, water use | In June 1986, the State of Utah began… |
In June 1986, the State of Utah began construction of a system to pump excess water from the lake onto the Bonneville Salt Flats, creating the Newfoundland Evaporation Basin. This project included a pumping station at Hogup Ridge, inlet and outlet canals, four trestles, almost 25 miles of dikes, a 37-mile natural-gas pipeline, and a 10-mile access road between Lakeside and the pumping station. Pumps ran from April 1987 until June 1989, by which time the lake had dropped almost 6 feet. The pumping caused about 2 feet of that drop. In the first year, about 1.5 million acre-feet of water was pumped into the evaporation basin (an acre-foot is a volume that would cover one acre with one foot of water). A dike was built at the southeast end of the basin to control the basin’s water level and let salt-rich water flow back into the lake. If the level of the basin rose high enough, some water would travel all the way around the Newfoundland Mountains and back into the lake. Over the course of the project about 264,000–283,000 acre-feet of water actually did so. |
Water | |||||||||||||||||||||||||||||||
| The Everglades and Miami, Florida, USA | Earthshots | canals, hydrology, lakes, levees, limestone quarries, national park, nuclear power, population, rivers, thermal infrared, urban growth | Referred to as the “River of Grass,” the… |
Referred to as the “River of Grass,” the Florida Everglades is one of the world’s largest wetlands. However, they were once much larger. Throughout the 20th century, the region was drained for agriculture and development, and canals and levees were built to manage the water. The area that is protected as a national park, established in 1947, is a fraction of the original extent of the Everglades. The Everglades is essentially a wide, slow-moving sheet of shallow water, hence the name River of Grass. The water originates at the Kissimmee River in central Florida, drains into Lake Okeechobee, then out into the Everglades. A rich variety of plant and animal habitats occupy this very flat terrain—even small water level changes significantly impact these communities. Much of the development in the Everglades started long before the Space Age, but notable land changes occurred within the satellite era. This series of Landsat images shows the urban development of the Miami metropolitan area, agriculture, and the extent of land protections of southeastern Florida. |
Agriculture, Cities, Mining, Water, Wetlands | |||||||||||||||||||||||||||||||
| The Glaciers of Kilimanjaro | Earthshots | ice, snow, volcanoes | As the 2000 image was being taken,… |
As the 2000 image was being taken, climatologist Lonnie Thompson was camped on the glacier ice, drilling out samples for analysis and preservation. When a year later he publicly stated that the glaciers might disappear between 2015 and 2020, he raised these glaciers to a new level of public and scientific debate. For better or worse, Kilimanjaro became a poster child for global warming. Kilimanjaro’s glaciers have been shrinking since at least the 1880s. (Scientists measure the glaciers, not the fluctuating snow cover. Ground measurements are required in addition to aerial/satellite imagery, since the glaciers may be covered by snow or ash.) The ice has retreated both vertically and horizontally, but the loss of area has been more dramatic. Vertically, the glaciers don’t appear to have lowered dramatically between 1880 and about 1960, but stereo aerial photographs indicate that from 1962 to 2000 they lowered almost 0.5 m per year. One member of Thompson’s 2000 party described the melting he observed: “By day, water streamed off the top of the glacier and down its steep sidewalls. . . In some places, the rivulets wandering along the surface had converged to form streams, which catapulted in waterfalls off the top” (Bowen, 2005). Area of Kilimanjaro’s glaciers, 1880–2016
|
Glaciers, Mountains | |||||||||||||||||||||||||||||||
| The Grand Canyon | Image of the Week | canyons, erosion, national parks, rivers, sediment | This image of the Grand Canyon in the… | This image of the Grand Canyon in the southwestern United States is a mosaic of two Landsat 8 scenes acquired October 31 and November 9, 2013. Designated as a national park in 1919, the Grand Canyon has breathtaking views and unique geological formations that attract over 5 million visitors each year. Archaeological artifacts have been found in the park that are nearly 12,000 years old. Recent high-flow releases of water from the Glen Canyon Dam (northeast of this image) have moved sand along the Colorado River and into the canyon. These sediments are helping to establish sandbars for fish and wildlife habitat and to protect archaeological resources. The Landsat 8 satellite, launched in February 2013, is providing high-quality worldwide images of the landscape on a daily basis. Landsat serves as a valuable tool for all interested in monitoring the characteristics of the earth’s surface. |
||||||||||||||||||||||||||||||||
| The Great Sand Dunes National Park | Image of the Week | center pivots, irrigation, national parks, rivers, sand dunes, water use | ||||||||||||||||||||||||||||||||||
| The Hamoun Wetlands | Earthshots | drought, irrigation, lake, salt flats, saltwater | The Lake Hamoun area is classified as… |
The Lake Hamoun area is classified as freshwater wetlands. Because Hamoun is a closed basin, it’s more of an inland delta. About 60,000 hectares of the wetlands in the Hamoun region in Iran are protected under the Ramsar Convention. The Hamoun region on the Afghanistan side is not protected under the Ramsar Convention even though it represents more area that is permanently inundated and vegetated. The Hamoun wetlands have a normal wet and dry cycle. The water level typically rises in the spring and falls from April to January. Large areas dry up regularly. But during prolonged dry periods, birds migrate elsewhere, and fishing is not possible. The annual precipitation in this extremely dry basin is only about 50 millimeters. The average depth of the lake, even at its highest water level, is only 3 meters. That means the area is vulnerable to major changes in water level that happen naturally. When in addition people alter the water flow, the changes are more pronounced. Irrigation expansion has made the lakes more vulnerable to drought. The once thriving wetlands are now mostly lifeless salt flats. |
Deserts, Water, Wetlands | |||||||||||||||||||||||||||||||
| The Importance of Landsat with Curtis Woodcock | Video - Landsat | |||||||||||||||||||||||||||||||||||
| The Initial Irrigation Idea | Earthshots | canals, irrigation, rivers | From 1975 to 1978, Cambodia was governed by… |
From 1975 to 1978, Cambodia was governed by Pol Pot. His regime was known as the Khmer Rouge ("Red Khmer"). In their desire to radically transform Cambodia, the Khmer Rouge emulated both contemporary Communist China and the Khmer "golden age" of the 11th–13th centuries, both of which used irrigation. The historic canals around China's Yangtze River delta harnessed rainy-season floodwaters, carrying them out to the surrounding lowlands where in the dry season people lifted the water up into their rice fields. Historical and archeological documents also indicate a local irrigation system in the 12th-century Khmer state, possibly storing and distributing water so that rice could be grown year-round, two or more crops per year. But the Khmer Rouge irrigation system followed the Chinese plan more closely than the historic Khmer state plan. And in doing so, they made many miscalculations including ignoring the amount of human labor needed to lift the water up to the fields. Where one square kilometer of Yangtze River lowlands in China needs the support of 1,500 laborers, only 300 laborers were available to work the Mekong uplands in Cambodia. |
Water | |||||||||||||||||||||||||||||||
| The Island Changes | Earthshots | islands, land creation | Landsats 1 through 8 recorded these post-… |
Landsats 1 through 8 recorded these post-independence changes, starting with the city’s growth. For one and a half centuries, Singapore remained tightly packed in the southeastern corner of the island, but around the time of independence the city and island governments merged, and the population spread out into a new metropolis covering the whole island. The Second World War taught Singapore how dependent it was on others for food, since it obviously had little room to grow its own. Since independence, farmland has shrunk from around a quarter of the island to about 5 percent. The many tiny Chinese-style family farms based on intensive labor were replaced by a few large production centers with greenhouses. Amid all the building, the government saved tiny remnants of the pre-1819 tropical rainforest. Bukit Timah Nature Reserve, in only 185 acres, contains more tree species than all of North America. Forest patches stand out in the Landsat images (most clearly in 2002 and 2009) as brighter green, surrounding and working with the central reservoirs to trap as much water as possible. The Japanese took Singapore partly by cutting off its water supply, and even with these central reservoirs Singapore still needs to import water from Malaysia. |
Cities, Coasts | |||||||||||||||||||||||||||||||
| The Island Expands | Earthshots | harbors, islands, land creation | The British started the expansion of Singapore… |
The British started the expansion of Singapore within days of landing in 1819. The expansion was begun by moving soil into small areas around the old port town that flooded at high tide. As Singapore became more important to Britain’s economy and military, they invested more in the port, including more extensions of land. This activity peaked between the World Wars, when Britain built the port into its naval stronghold in East Asia, and it ended with the Second World War, after which development quieted. From the mid-1800s to 1960, the city’s coastline had moved about 500 meters seaward. In the decades following self-government in 1959, Singaporeans have created much more land than the British did in 140 years. The 1973 and 1990 images show this transformation underway; new ground was created either by flattening nearby hills or by scooping up underwater sand to deepen navigation channels. By 2000, you can identify the new recreation areas, stretching east along the coast and on southern Sentosa Island, by the green color of their vegetation, with golf fairways appearing as bright strips. The harbor channel is flanked by the gray areas of loading facilities. In the later images, you can see ships of different colors and sizes swarming in the water. |
Cities, Coasts | |||||||||||||||||||||||||||||||
| The Island Nation of Nauru | Image of the Week | islands, land conversion, near-infrared, phosphate | Nauru is the world’s smallest island country,… | Nauru is the world’s smallest island country, with only 21 square kilometers (8 square miles) of land area. Since the early 1900s, the tiny island has been mined for its rich phosphate reserves. By 2000, most of the phosphate deposits had been exhausted, and the strip mining and associated activities had denuded up to 80% of Nauru’s surface. The mining left extensive damage to Nauru’s surface and ecology, but in recent years there have been efforts to rehabilitate the affected areas. These two Landsat images are false-color composites. The red tones indicate a strong signal from Landsat's near-infrared (NIR) band, which is used by landscape scientists to monitor the presence and condition of vegetation and forested areas. In this type of image, a deep red color indicates actively growing vegetation and forest, while non-vegetated or poorly vegetated areas will have less red tone. The 1999 Landsat image (left) shows the bright mine scars along with dull, mixed color tones across the landscape, indicating a generally poor condition for the island’s vegetation. The deep red colors throughout the 2015 image (right) suggest an overall increase in vegetation and forest cover. Landsat imagery can be a valuable tool to help document the history of the mining impacts and track the progress of restoration activities as Nauru works to revitalize their island nation. |
||||||||||||||||||||||||||||||||
| The Lake's Formation | Earthshots | canal, irrigation, lake, river, water use | For thousands of years, the Colorado River… |
For thousands of years, the Colorado River flowed above and to the east of the valley, on its way to the nearby Gulf of California. The river was higher than the valley, but it was hemmed in by its own natural levees, land barriers on either bank built up over years from silt left behind by floods. With each flood, these levees grew a bit higher and harder to breach. But once in a while, the Colorado would break out and pour down into the Salton Basin, partly filling it. Then the levee break would fill with silt, the river would revert to its normal channel, and the basin would dry up again. Dams and channels on the river now prevent these cycles. European American settlers saw that the Imperial Valley had good soils for agriculture, except for being extremely dry. In 1901, the Colorado Development Company began diverting Colorado River water into the valley for irrigation, similar to what the Colorado had done naturally thousands of times. In 1905, the company lost control of the river during a flood, and the Colorado broke through the half-finished headgate of an irrigation ditch. The river kept widening the ditch, until almost the entire river was flowing into the sink rather than toward the Gulf of California. It took engineers and work crews until 1907 to return the river to its proper course, by which time a considerable lake had formed. |
Agriculture, Cities, Water | |||||||||||||||||||||||||||||||
| The Lakes Form | Earthshots | lakes, water use | The Aswan High Dam on the Nile River was… |
The Aswan High Dam on the Nile River was completed in 1970 for flood protection and to store water during dry years. The dam formed Lake Nasser, the third largest reservoir in the world by volume. A small portion of this lake is visible in the lower right corner of the images. In 1978, a spillway and channel were built as a precaution against any unexpected increase in Lake Nasser’s water level. The channel can divert water from the reservoir to the Toshka basin, which is located outside the Nile basin. This design reduces pressure on the dam and protects downstream areas from massive flooding. In 1998, excess rainfall in the Ethiopian highlands tested the flood control plan. The huge reservoir reached its maximum stage of 183 meters above sea level in September. The overflow water streamed through the spillway and into the Toshka basin forming the Toshka lakes. Around 32 to 98 million cubic meters of water per day poured into the basin during September and October. The lakes reached their maximum collective size in August 2001. Their area remained fairly stable through August 2003. The water supply from Lake Nasser continuously replaced water lost through evaporation. As the level of Lake Nasser subsided, the water supply from the reservoir stopped and the lakes started diminishing. |
Agriculture, Deserts, Water | |||||||||||||||||||||||||||||||
| The Lakes of Eastern Day County, South Dakota | Image of the Week | flooding, groundwater, lakes | ||||||||||||||||||||||||||||||||||
| The Lakes Shrink | Earthshots | lakes, water use | The only two places for water in this arid… |
The only two places for water in this arid region to go are into the air or into the ground. The underlying limestone prevents much ground infiltration. In the Toshka region, annual precipitation averages a meager 1.5 millimeters, and the potential evaporation rate is 14–15 millimeters per day. With no natural outlet and reduced water input to these lakes from Lake Nasser, the water evaporated quickly. Starting in 2019, flooding rains in Sudan once again brought excess water to Lake Nasser, and water once again flowed into the Toshka basin. |
Agriculture, Deserts, Water | |||||||||||||||||||||||||||||||
| The Landsat Program | Earthshots | Landsat | Since 1972, the Landsat satellites have… |
Since 1972, the Landsat satellites have been imaging Earth’s land areas. Landsat represents the world’s longest continuously acquired collection of space-based moderate resolution land remote sensing data. Landsat imagery provides a unique resource for those who work in agriculture, geology, forestry, regional planning, education, mapping, and global change research. Landsat images are also invaluable for emergency response and disaster relief. Landsat satellites image the Earth’s surface along the satellite’s ground track in a 185-kilometer wide (115-mile wide) swath as the satellite moves in a descending orbit (moving from north to south) over the sunlit side of the Earth. Landsats 8 and 9 are the two newest Landsat satellites. They are in a polar orbit 705 kilometers (438 miles) above the Earth’s surface. They complete one orbit every 99 minutes, for 14 ½ orbits per day. This means it takes 16 days for each satellite to obtain imagery over the entire globe. Together, these two Landsats image Earth's landmasses every 8 days. The images you see in Earthshots span the Landsat archive. The images from Landsats 1–3 used a sensor called the Multispectral Scanner (MSS). Its image resolution, the size of the smallest region on the Earth’s surface (known as a “pixel”) that can be observed by the instrument, was about 80 meters. On Landsats 4–5, the improved Thematic Mapper (TM) sensor provided a resolution of 30 meters. The Enhanced Thematic Mapper Plus (ETM+) onboard Landsat 7 and the Operational Land Imager (OLI) on Landsats 8 and 9 also provide 30-meter resolution. The images of Las Vegas, Nevada, show the difference between these two resolutions. Landsat Program History
|
||||||||||||||||||||||||||||||||
| The Long Dark Winter | Earthshots | solstice | Compare the two Landsat images from June 24,… |
Compare the two Landsat images from June 24, 2014, and September 19, 2014. At this high latitude, the sun angle becomes very low later in the year. The June 24 image is close to the summer solstice. The September 19 image is close to the autumnal equinox, when the sun angle is much lower in northern Greenland. This lower sun angle is very noticeable in the longer shadows. The shadows also provide hints about the height and shape of the mountain peaks along the glacier. Landsat does not acquire images this far north during winter. In the Northern Hemisphere’s winter, it becomes too dark for satellite imaging. |
Glaciers, Water | |||||||||||||||||||||||||||||||
| The Lorian Swamp | Earth As Art | deltas, lava, rock | Water flowing out of this inland delta rarely… | Water flowing out of this inland delta rarely reaches the ocean; instead, it seeps into the semiarid plains of northeastern Kenya. The dark feature in the upper left, which looks like a black eye, is hard basaltic rock from an ancient lava flow. |
||||||||||||||||||||||||||||||||
| The Lower Mississippi River | Image of the Week | rivers | ||||||||||||||||||||||||||||||||||
| The Majuro Atoll with Dean Gesch and Jeff Danielson | Video - EROS | |||||||||||||||||||||||||||||||||||
| The Mining Process | Earthshots | coal, open pits, overburden, reclamation | The mining process that takes place in the PRB… |
The mining process that takes place in the PRB is called surface mining. First, the topsoil is removed. The material above the coal (overburden in mining jargon) is then removed to expose the coal. The overburden is placed into a previously mined pit. The exposed coal is then scooped out. Rocks, ash, sulfur, and other contaminants are cleaned out of the coal. Blasting and crushing reduces the coal to smaller pieces that can be loaded onto trains for transport. Trains bring the coal to power plants throughout the country. The Surface Mining Control and Reclamation Act (SMCRA) requires mining companies to reclaim the mined land. The mined land is filled in with overburden, and the topsoil is replaced. Native seeds are planted on the reclaimed land. The whole process is overseen by environmental engineers and state and federal agencies to ensure compliance with laws. Lands disturbed by coal mining must be restored to a condition that can support the uses it could support before mining (or even make the land better). In the close-up images, the mined land seems to move over time. As the mining and beginnings of the reclamation process take place, we can see the digging and backfilling occurring. (See the animations in the subsection called "Animations" to see more images and to see this process happen over the 30-year time period.) |
Energy, Mining | |||||||||||||||||||||||||||||||
| The Mining Process | Earthshots | gold, open pits | Gold is found in the Yanacocha Mine in… |
Gold is found in the Yanacocha Mine in microscopic bits. One hundred tons of earth need to be removed for every ounce of gold extracted. The large volumes of material are dumped onto a lined leach pad, and cyanide solution is sprayed over it. The cyanide binds with the gold and causes a solution enriched with gold to settle at the bottom. The gold can then be extracted from that solution. Environmental risks of large-scale open pit mining are complex and uncertain. One impact is the potential risk of cyanide contamination on soil and water. Satellite data along with ground studies can help show the land change effects of mining operations, such as groundwater quality and watershed changes. |
Mining | |||||||||||||||||||||||||||||||
| The Mississippi River Delta Basin | Image of the Week | deltas, rivers, sediment | ||||||||||||||||||||||||||||||||||
| The Optimist | Earth As Art | center pivots, irrigation, sand dunes | On the edge of the Kalahari Desert in Namibia,… | On the edge of the Kalahari Desert in Namibia, sand dunes are encroaching onto once-fertile lands in the north. Healthy vegetation appears red in this image; in the center, notice the lone red dot. It is the result of a center-pivot irrigation system, evidence that at least one optimistic farmer continues to work the fields despite the approaching sand. |
||||||||||||||||||||||||||||||||
| The Progress of Landsat Sensor Technology | Image of the Week | ice, shortwave infrared | Landsat sensor technology has come a long way… | Landsat sensor technology has come a long way since the days of the Return Beam Vidicon cameras on the first three Landsat satellites. Known as the RBV, it was originally intended to be the satellites’ primary sensor. But the Multispectral Scanner, or MSS, became the more stable and superior instrument. Compare these images of glaciers in Alaska’s Chitina River Valley from 1980. There is more background noise in an RBV image than there is in an MSS image. The RBV on Landsat 3 had a slightly higher spatial resolution, but the low signal-to-noise ratio makes it harder to pull out surface detail. The 2018 image from Landsat 8’s Operational Land Imager has even better signal-to-noise ratio and higher resolution than both early sensors. The image reveals more detail about the roughness and flow of the ice. Landsat 8’s shortwave infrared bands provide a better distinction between ice and rock or soil. Although Landsat sensor technology has improved, RBV data still play an important role in this long-term record of changes on the earth. |
||||||||||||||||||||||||||||||||
| The Salton Sea | Image of the Week | lakes, rivers | ||||||||||||||||||||||||||||||||||
| The Sea's Populations | Earthshots | irrigation, lake, river, saltwater, sea, water use | Several cities are visible within the area of… |
Several cities are visible within the area of irrigated agriculture in the valley, which is surrounded by the natural desert. The close-up images show the growth of El Centro, California, and the urban area of Mexicali/Calexico on the border. These cities' populations have grown rapidly over the last few decades:
The Salton Sea's resources include fish, migratory birds, and recreation, and several endangered species rely on the sea for habitat. These resources are threatened by how the sea may change in the future. Because the sea has no outlet (other than evaporation), dissolved salts are left behind and salinity gradually rises each year. If water levels drop, air quality could be affected; the exposed lakebed could increase the intensity of dust storms. This area already has the highest childhood asthma rate in California (U.S. Department of the Interior, 2007). Furthermore, recent water transfer agreements will reduce agricultural inflows into the sea by an estimated 30% by 2018, which will cause the Salton Sea to recede. To address these problems, evaporation basins are under consideration to extract some of the salt. Wetland impoundments are proposed to maintain wildlife habitats. Pumping saltwater to the Gulf of California might also be attempted. |
Agriculture, Cities, Water | |||||||||||||||||||||||||||||||
| The Selenge River Delta | Image of the Week | |||||||||||||||||||||||||||||||||||
| The Siren Storm | Earthshots | storm, tornado, weather | The tornado touched down on a Monday evening,… |
The tornado touched down on a Monday evening, June 18, 2001, about 5 miles west of Siren, a town of about 900 people. This tornado was later classified as severe, an F3 on a scale from F0 to F5, its winds of 158–206 mph placing it among the 10 percent most damaging tornadoes. As a lakeside town, Siren had many houses without basements, and it had short warning that night since lightning had knocked out its tornado siren about a month earlier. The tornado hit the town at about 8:20 p.m., damaging or destroying about 200 houses (2) (3) and 40 businesses. No one died in Siren, but 16 people were injured that night, and three people were killed east of Siren in the small town of Dewey. This was Wisconsin’s deadliest tornado since 1984. Just before noon the next day, as recovery crews poured into the area, Landsat 7 passed overhead, getting a nearly cloudless image. The Environmental Remote Sensing Center at the University of Wisconsin rush-ordered this scene from the USGS and produced a “change” image comparing May 18 to June 19. This image gave recovery workers a more synoptic view of the damaged area than attempts to map it by airplane, helicopter, or ground survey. Thanks to Dr. Thomas Lillesand, Marcia Verhage, and Nancy Podger of the Environmental Remote Sensing Center of the University of Wisconsin, Madison, for assistance. |
Natural-Disasters | |||||||||||||||||||||||||||||||
| The Storm's Cost | Earthshots | hail, hailstorm, storm, weather | The storm cost EROS over $1.2 million in… |
The storm cost EROS over $1.2 million in damage. Vehicles were smashed, branches broken, foliage shredded, windows broken, and ground pockmarked. The hail destroyed an array of 512 solar panels, which had heated 60% of the photo lab’s water. Many skylight panels were broken, and the roof sprang leaks. The hail broke concrete paving stones on the roof. The antenna for Landsat 7 (which launched in 1999) was only a month old; the electronics were smashed and the dish had over 2,000 dents. Luckily, no one was injured. About EROS The EROS mission is to collect and archive data from Earth-observing satellites, primarily the Landsat satellites. The Center also archives data from other Earth-observing satellites and aerial imagery dating back to the 1930s. EROS is a science center, too; scientists there use the data for research on climate change, landscape dynamics, natural hazards, and many other uses. What’s EROS doing out there in the middle of cropland anyway? First, it was placed in the center of the continent to receive data from satellites coast-to-coast. So that’s what brought EROS to South Dakota. EROS was built out of town to avoid radio and TV interference and to give the receiving antennas a clear view from horizon to horizon. |
Agriculture, Natural-Disasters | |||||||||||||||||||||||||||||||
| The Syrian Desert | Earth As Art | Between the fertile Euphrates River valley and… | Between the fertile Euphrates River valley and the cultivated lands of the eastern Mediterranean coast, the Syrian Desert covers parts of modern Syria, Jordan, Saudi Arabia, and Iraq. |
|||||||||||||||||||||||||||||||||
| The Vanishing Aral Sea | Image of the Week | irrigation, lakes, rivers, water use | ||||||||||||||||||||||||||||||||||
| The Villages, Florida | Image of the Week | golf courses, lakes, land conversion, population, urban growth | ||||||||||||||||||||||||||||||||||
| The Watcher | Earth As Art | craters, volcanoes | A volcanic landscape in the Tibesti Mountains of… | A volcanic landscape in the Tibesti Mountains of Chad shows some mysterious shapes. However, science can explain mysteries in satellite images. The octopus-shaped feature consists of ancient volcanic flows. In the crater below it, what looks like a face is bright salt deposits. |
||||||||||||||||||||||||||||||||
| The Water Returns | Earthshots | canals, marshes, rivers, water use | After the large-scale draining throughout the… |
After the large-scale draining throughout the 1990s, the Mesopotamian Marshes went through another major change. After 2003, some Marsh Arabs returned to the wetlands, and the dams, dikes, and levees were demolished. Water flowed once again from the rivers into the marshlands. It’s still unclear whether the area has achieved successful restoration. Although returning water to marshlands to restore them seems simple, the water releases were spontaneous and uncontrolled. There is still high soil and water salinity, stemming from the many years the land was dried out. The wetlands that exist now are disconnected, which affects species diversity. Water also now pours into the marshes from sewer pipes. Sustained freshwater input is needed to maintain water extent. But that depends on how the water is used upstream. The Ataturk Dam in Turkey, on the Euphrates River, began filling in 1990. That and other dams in Turkey, Syria, and Iran have reduced the volume of the Tigris and Euphrates rivers. The reduced flow from the rivers leads to saltwater intrusion from the Gulf. The marshland extent is still less than half of what it was in the time frame of the earliest images shown here. That reduced extent makes the area more vulnerable to year-to-year changes in precipitation. Interannual variation in the water levels is evident in the images. Drought in 2018 caused water levels to drop. But spring 2019 and 2020 had above average rainfall, and the marshes’ water coverage expanded. However, in the latest images shown here, a drying trend has returned. Regional drought is forcing many to abandon their farmland. The marshes will likely never be the same as they once were, even as recently as the 1960s. It’s unclear how long re-inundated areas will stay that way, considering changing climate and upstream dam projects. |
Water, Wetlands | |||||||||||||||||||||||||||||||
| The Wildflower Superbloom in California from Landsat’s Perspective | Image of the Week | drought, wildflowers | After 5 years of drought, California finally got… | After 5 years of drought, California finally got relief during the winter of 2016–2017 with much needed precipitation. One result of this additional moisture was a springtime abundance of wildflowers. There were many places to see this wildflower “superbloom” in southern California. This pair of images from Landsat 8 offers an example of a large area of massive wildflower displays just north of Los Padres National Forest. These natural color images show the difference in vegetation from March 2016 to March 2017. The latest image is overall much more green, but what really stand out are the brilliant shades of yellow-green scattered throughout the Caliente Range north of the Cuyama River. Countless wildflower species carpeted the hillsides on both sides of the river. The flowers are especially brilliant just south of the river on the slopes of the Sierra Madre Mountains. The fact that Landsat picked up the flowers with its 30-meter resolution validates the vast extent of this wildflower bloom. But it’s also evidence of Landsat’s value at monitoring the condition of vegetation at a broad scale. |
||||||||||||||||||||||||||||||||
| The World | Earthshots | artificial islands, islands, land creation, urban growth | Another impressive artificial archipelago best… |
Another impressive artificial archipelago best appreciated from above is “The World.” These 300 private islands are in the rough shape of a world map. Each island ranges from 23,226 to 83,613 square meters (250,000 to 900,000 square feet), with 50 to 100 meters (164 to 328 feet) of water between each island. The total area of these islands is about 9 kilometers (5.4 miles) long and 6 kilometers (3.6 miles) wide. An oval-shaped breakwater surrounds it, which provides shelter for the islands from sea waves. This breakwater actually completes the globe-like shape. Individual islands are named after countries, regions, and cities. No bridges will connect the islands—the only transportation between islands will be by airplane or boat. The islands took shape roughly between 2004 and 2008, but the financial crisis also slowed development on these islands. However, development on the islands is starting up again on a collection of six islands called the “Heart of Europe.” The plan for these islands is to accommodate 16,000 tourists for luxury vacations. |
Cities, Coasts, Deserts | |||||||||||||||||||||||||||||||
| Theewaterskloof Reservoir, South Africa | Image of the Week | drought, lakes, reservoirs, water use | A three-year drought is threatening to cause city… | A three-year drought is threatening to cause city officials in Cape Town, South Africa, to shut off the tap water. The growing city of nearly 4 million relies mostly on reservoirs for its water supply. While drought is part of the cause of the current crisis, an increasing population is also straining water resources. The view from data acquired by Landsat 8 brings the crisis in Cape Town into focus. The January 2014 image shows the largest reservoir in its water supply system, Theewaterskloof, at full capacity. In January 2018, it is easy to see how much the surface area of the lake has diminished after three years of drought. The Western Cape Government lists the reservoir’s water capacity at just 13 percent. Smaller reservoirs do not appear to change much compared to Theewaterskloof, but Cape Town only gets a small fraction of its water from them. In 2015, rainfall in the area measured 325 mm (12.8 inches)—normal annual rainfall there is 515 mm (20.3 inches). After that, the drought only got worse. Rainfall totaled just 157 mm (6.2 inches) in 2017. Rainfall this low for three straight years is extremely rare. Even with water use restrictions, the city could run out of water by mid-April 2018. If the rainy season, which is from April to September, brings adequate rainfall, then Landsat can help monitor the extent of the reservoir as it begins to refill. |
||||||||||||||||||||||||||||||||
| Three Decades of Lithium in Chile | Image of the Week | evaporation ponds, lithium | If you're watching this video, you're probably… | If you're watching this video, you're probably using a lithium battery. Smartphones, tablets and laptops all rely on lithium metal to store energy. It comes from surface mines or brine ponds, found in places like Australia, China and the United States. One of the leading sources for this increasingly valuable resource is the South American nation of Chile. On the Atacama Desert, brine is pumped from underground deposits into ponds where it evaporates over many months, concentrating the "white gold" for extraction. This animation strings together 400 Landsat scenes to show change on the Chilean landscape at approximately 1 frame per month since 1985. The imprints of future ponds, roads, wells and brine-pumping pipes also appear on the surface over time, sketching out the landscape's fate in rectangles of pushed earth. The ponds ripple in royal blue as the months pass signaling the churn of lithium from the evaporating brine creating a visual experience akin to a hypnotic, high-speed Tetris game. U.S. firms plan to pull lithium from pit mines at Thacker Pass in northern Nevada, and to expand evaporative extraction at the Silver Peak mine in southern Nevada. Our visit to the Chilean mines may offer a glimpse into their future. |
||||||||||||||||||||||||||||||||
| Three Gorges Dam Brings Power, Concerns to Central China | Image of the Week | hydropower, lakes, reservoirs, rivers | The construction of the Three Gorges Dam on the… | The construction of the Three Gorges Dam on the Yangtze River in central China offers an interesting glimpse into the balancing act borne from humanity’s changing of the natural landscape. Images from Landsat 5 in 1993 and Landsat 8 in 2016 show a river transformed after the completion of the largest hydroelectric power plant in the world in 2012. The Yangtze appears light blue in these scenes because of heavy sedimentation in the water as it passes through the Qutang, Wu, and Xiling gorges in this mountainous region. Tributaries with less sediment appear darker blue. Forested areas are red because of Landsat’s near-infrared imaging capability. Hydropower as an alternative energy source to coal is a valuable output from the dam. Three Gorges’ power plant has a generating capacity of 22,500 megawatts, over 3 times that of the Grand Coulee Dam and 20 times that of Hoover Dam. Besides hydropower, the dam has also made river navigation easier, eased flooding, and provided an ample water supply for irrigation. |
||||||||||||||||||||||||||||||||
| Three Gorges Dam, China | Earthshots | flooding, hydropower, lakes, reservoirs, rivers | The Three Gorges Dam in the Hubei province of… |
The Three Gorges Dam in the Hubei province of China is a huge but highly criticized project. It’s difficult to deny the value of hydropower as an alternative energy source to coal, but the project has possibly caused unintended consequences. The Three Gorges Dam is about 594 feet (181 meters) tall and 7,770 feet (2,335 meters) long. The Three Gorges Reservoir extends 370 miles (600 kilometers) along the Yangtze River upstream from the dam. At full capacity, the reservoir has a surface water area of over 417 square miles (1,080 square kilometers). The name “Three Gorges” refers to the narrow gorges that the Yangtze River flows through in this mountainous region: the Qutang, Wu, and Xiling gorges. Construction began in 1992, and the reservoir began filling in June 2003. In 2012, it became the world’s largest hydroelectric power plant, with a generating capacity of 22,500 megawatts, over 3 times that of the Grand Coulee Dam and 20 times that of Hoover Dam. Landsat imagery displays the construction of the dam, and the reservoir filling behind the dam. |
Dams, Energy, Water | |||||||||||||||||||||||||||||||
| Three Gorges Dam, China | Image of the Week | hydropower, lakes, reservoirs, rivers, water use | Moving water holds potential for generating… | Moving water holds potential for generating electricity, and hydroelectric power currently generates over 16 percent of the world’s electricity.
|
||||||||||||||||||||||||||||||||
| Tides in the Bay of Fundy | Image of the Week | intertidal zones, tides | The Bay of Fundy in Canada has a unique geography… | The Bay of Fundy in Canada has a unique geography funneling the Atlantic Ocean into some of the world's highest tides. At some points the water level can rise and fall over forty feet. The water's edge at Minas Basin shown in these Landsat 8 images changes dramatically depending on the day and time. Because Landsat 8 passes over quickly, the imagery cannot reveal the continuous progression of any single tide event. However, tidal movement can be simulated by resequencing the data like this. Intertidal zones can then be mapped with this technique. In the north, Shepody Bay also experiences substantial tidal changes, and again when imagery from Landsat's deep archive is rearranged, it's possible to generate a simulated flood and ebb cycle, in this case pulling back from the high water line almost 2 miles. Tools like Earth Explorer open the entire Landsat archive to everyone interested in studying tides across the globe. |
||||||||||||||||||||||||||||||||
| Time Travel by Permafrost | Image of the Week | craters, permafrost | In Russia's extreme north, a widening chasm known… | In Russia's extreme north, a widening chasm known as the Batagaika Crater provides a unique opportunity to study the past. Early declassified satellite images recorded the crater's growth in the 1960s and 1970s followed by multispectral sensor imagery captured by Landsat and Sentinel satellites, building a continuous view over the last 60 years. But the gash in the ground offers an opportunity to study much further back in time. Each exposed layer of the crater wall is like a geological snapshot, helping scientists understand the past climate of the permafrost. The layers at the bottom could be as old as 650,000 years. Declassified satellite imagery, Landsat, and Sentinel imagery are available for free download at the USGS EarthExplorer website. |
||||||||||||||||||||||||||||||||
| Tioga | Earthshots | natural gas, oil | Tioga is a small town in northwestern North… |
Tioga is a small town in northwestern North Dakota that has also seen rapid growth. The visible changes in the image series are oil production infrastructure surrounding the town. Just east of the town is the Hess Corporation Tioga Gas Plant. Just west of Tioga is a rail facility for loading trains with oil. Seven miles south of Tioga, the clearing that can be seen in the image series is the Energy Transfer Partners Facility, a pipeline transfer facility.
Tioga has also seen the same type of income and home value increases as other nearby towns.
|
Cities, Mining | |||||||||||||||||||||||||||||||
| Topaz Solar Farm, California | Image of the Week | land conversion, solar panels, solar power | The Topaz Solar Farm is one of the largest solar… | The Topaz Solar Farm is one of the largest solar farms in the United States. Located in central California, the 550-megawatt power station consists of 9 million solar panels across 9.5 square miles (24.6 square kilometers). Construction began in 2012 and was completed in late 2014, and the site can now produce enough electricity to power 160,000 homes.
|
||||||||||||||||||||||||||||||||
| Torn Apart | Earth As Art | fissures, lava, lava flows, volcanoes | A frantic-looking scene in northeastern Ethiopia… | A frantic-looking scene in northeastern Ethiopia shows the location of three tectonic plates shifting away from each other. In this region, Earth’s crust is rifting at 1 to 2 centimeters per year. New fissures opened in the Erta Ale shield volcano in January 2017, and this image from March 2017 shows the locations of the fresh lava. The shapes streaking away from the center are previously erupted, cooled, and solidified lava flows. |
||||||||||||||||||||||||||||||||
| Tornado in Arkansas, US | Image of the Week | storms, tornadoes, weather | A tornado that touched down in central Arkansas… | A tornado that touched down in central Arkansas on April 27, 2014, proved devastating and deadly. |
||||||||||||||||||||||||||||||||
| Tornadoes Devastate the Southeastern United States | Image of the Week | storms, tornadoes, weather | ||||||||||||||||||||||||||||||||||
| Toshka Project, Egypt | Earthshots | center pivots, irrigation, lakes, sand dunes, water use | In southern Egypt, the sandy desert has turned… |
In southern Egypt, the sandy desert has turned into a lakes region. Beginning in 1998, lakes quickly appeared and almost as quickly disappeared from Egypt’s Sahara Desert. Then, in late 2019, they appeared again. Landsat and Sentinel-2 satellites captured these remarkable changes. These images also show the progress of the Toshka Project. Originally intended to relocate millions of Egyptians from overcrowded cities into a “New Nile Valley,” the project includes plans for hundreds of thousands of hectares of irrigated farmland. Like the lakes that formed in this region, this irrigation project relies upon water from the Nile River. |
Agriculture, Deserts, Water | |||||||||||||||||||||||||||||||
| Tracking Water Changes | Video - Landsat | |||||||||||||||||||||||||||||||||||
| Tree Islands | Earthshots | canals, hydrology, lakes, levees, national park | A unique feature of the Everglades is the dark… |
A unique feature of the Everglades is the dark green teardrop-shaped forms scattered throughout the region. Referred to as hummocks, or “tree islands,” these biodiversity hotspots provide food, cover, and critical nesting sites for numerous species. The patches of woody vegetation range in size from 0.01 to 70 hectares, and they stand out from the sawgrass and marsh landscape 0.6–1.2 meters (2–4 feet) above the slough bottom. The teardrop shape generally points in the direction of the flow of water. Tree islands can have as much as 10 times the nutrient phosphorus as the surrounding Everglades. They soak up both phosphorus and nitrogen, allowing these spots to flourish and provide habitats for plants, invertebrates, amphibians, reptiles, mammals, and resident and migratory birds, increasing overall biodiversity. As these islands store up phosphorus, they keep phosphorus low in the surrounding marsh. When the phosphorus concentrations in the rest of the marsh goes up, cattail invades, which affects fish and wading bird populations. The number and areal extent of tree islands have been reduced over the past 75 years with the changes in hydrology caused by the levees and canals. |
Agriculture, Cities, Mining, Water, Wetlands | |||||||||||||||||||||||||||||||
| Trinity River Flooding, Texas | Image of the Week | flooding, rain, rivers, storms, weather | Heavy rains fell over Texas, Oklahoma, Arkansas,… | Heavy rains fell over Texas, Oklahoma, Arkansas, and Louisiana in late May 2015. Many lakes and rivers filled and overflowed their banks, causing widespread flooding in both urban and rural areas. These rains provided much-needed moisture for this area of the southern Plains, and may help to suspend a multiyear drought in the region. However, the rapid rate of the rainfall has been excessive for many areas. |
||||||||||||||||||||||||||||||||
| Truman Sports Complex | Image of the Week | stadium | ||||||||||||||||||||||||||||||||||
| Tubarjal | Earthshots | center pivots, irrigation, water use | The increasing use of center-pivot irrigation… |
The increasing use of center-pivot irrigation matches the population growth of the city of Tubarjal. The city expands spatially in these images, and its current population is over 40,000. The 2013 and 2016 images show that more highways and roads have been built to accommodate this growth. The highway that runs toward the northwest leads to the smaller town of Al’Isawiyah. |
Agriculture, Deserts, Water | |||||||||||||||||||||||||||||||
| Tucson, Arizona | Image of the Week | population, urban growth | ||||||||||||||||||||||||||||||||||
| Tulare Basin | Earthshots | evapotranspiration, irrigation, water use | In the southern portion of the San Joaquin… |
In the southern portion of the San Joaquin Valley is the Tulare Lake Basin, which covers a significant portion of the valley. Tulare Lake was once the largest freshwater lake west of the Mississippi River. The lake used to appear naturally every winter as rainfall and snowmelt from the nearby Sierra Nevada Mountains flowed down and filled the basin. By the 1920s, the basin was drained and today remains largely dry. Rivers that once flowed into the basin are diverted to agriculture. Agricultural drainage is sometimes stored in several evaporation ponds. These ponds are visible as the dark shapes in many of the Landsat images. Some fields are flooded after harvest to remove salts accumulated during irrigation, control crop disease, and provide soil moisture for the next planting. For these purposes, water sits in the field for a week or less and is then drained. In some cases, a locally common fungal cotton pest needs to be controlled and a deeper and longer duration flood treatment is used. Water sits for over a week or many weeks and is then pumped out or drained by cutting through a levee. These flooded fields provide valuable habitat for waterfowl. |
Agriculture | |||||||||||||||||||||||||||||||
| Tulare Basin Refills | Image of the Week | flood, irrigation, lake, rain, snowmelt | A winter of heavy rain causes flooding in… | A winter of heavy rain causes flooding in California's Tulare Basin, threatening cropland. The basin was once the site of a large lake that appeared naturally every winter as rainfall and snowmelt from the nearby Sierra Nevada mountain range flowed down and filled the basin. It was even known as the largest lake west of the Mississippi River. But more than a century ago, when irrigation systems were developed to water area crops, the spring runoff wasn't enough to reach the basin anymore, and it dried up. This winter's heavy rains are filling it up again, and the snow has yet to melt from the mountaintops. A series of images from Landsat show the extent of the floodwaters in dark blue or black. Growing vegetation appears green, revealing gridded farm fields. Tan colored fields show bare soil where nothing is growing. Landsat satellites continue to provide valuable monitoring for water levels and potential flooding around the world. |
Agriculture, Natural-Disasters, Water | |||||||||||||||||||||||||||||||
| Turkey Point | Earthshots | canals, nuclear power, population, thermal infrared | There is a notable shape southeast of… |
There is a notable shape southeast of Homestead on the coast of the Bay of Biscayne. The top right corner of this shape is the location of the Turkey Point Nuclear Plant. In operation since 1972, the plant generates enough power for 900,000 homes annually. The rest of the large area is the plant’s system of cooling canals. Water in this closed loop of canals is used to keep equipment in the plant cool. The water passes through the plant to remove excess heat then goes back into the canal system. The water cools as it travels through the canals. Landsat’s thermal infrared imaging capability reveals the temperature of the water in this system. The brighter red in that image indicates warmer water. The water becomes cooler away from the plant and coolest on the right side nearest the plant where the water reenters the plant. Other warmer surfaces appear in a red hue as well, such as highways, airport runways, and other less vegetated surfaces of Homestead. |
Agriculture, Cities, Mining, Water, Wetlands | |||||||||||||||||||||||||||||||
| U.S. Harvest Nears Completion | Image of the Week | harvest | As 2014 comes to an end, so does the growing… | As 2014 comes to an end, so does the growing season in the northern U.S. heartland. Millions of acres of corn, soybeans, alfalfa, and small grains have been harvested from the land in recent weeks.
|
||||||||||||||||||||||||||||||||
| Ugab River | Earth As Art | river | Elusive, but ecologically vital, Namibia's Ugab… | Elusive, but ecologically vital, Namibia's Ugab River only flows above ground for a few days each year. The subterranean waters underlying this ephemeral river, however, are shallow enough in places to fill hollows and sustain a wildlife population that includes the rare desert elephant. |
||||||||||||||||||||||||||||||||
| Unfriendly Landscape | Earth As Art | center pivots, irrigation | In this region, called the Valley of the Moon in… | In this region, called the Valley of the Moon in Jordan, steep-sided granite mountains alternate with sandy valleys. It may be an unfriendly landscape, but it makes nice textures for an art print. An intriguing interruption of those textures is provided by a few center pivot irrigation fields. |
||||||||||||||||||||||||||||||||
| United States from Space | Image of the Week | Landsat mosaics | These Landsat image products were created using… | These Landsat image products were created using hundreds of individual Landsat scenes. The images have been mosaicked to show the topography and landscapes across the United States. The main image shows the Rocky Mountains and other mountain ranges that dominate the western United States. The central portion of the image consists mainly of rolling plains and farmland. The right portion of the main image shows the mountain ranges and coastal plains that make up the eastern U.S. seaboard. The Alaska and Hawaii mosaics show the predominant features of those landscapes as well. An individual Landsat state mosaic has been prepared for every one of the 50 U.S. states plus Puerto Rico. All of the Landsat image mosaics are available in poster-ready format and may be viewed and downloaded via the USGS Earth Resources Observation and Science (EROS) Center Image Gallery (http://eros.usgs.gov/imagegallery/landsat-state-mosaics). The imagery that is collected by the Landsat satellites can be useful for general visualization of large areas and landscapes, and is often used in combination with other datasets (such as elevation) to create image products such as these. This Landsat 8 mosaic of the contiguous U.S. was created by Descartes Labs (www.descarteslabs.com) and used with permission.
|
||||||||||||||||||||||||||||||||
| University | Earthshots | urban growth | Princess Nora Bint Abdul Rahman University… |
Princess Nora Bint Abdul Rahman University opened in 2011 just north of Riyadh. This change in land use is noticeable between King Khalid International Airport and the residential areas of Riyadh. The college sits along the highway that curves along the campus. With a capacity of 40,000 students, it is the largest women-only university in the world. The $5.3 billion (US) campus covers over 8 million square meters. |
Cities, Deserts | |||||||||||||||||||||||||||||||
| Update on Pine Island Glacier | Image of the Week | calving, icebergs, rifts | A massive iceberg broke off Pine Island Glacier,… | A massive iceberg broke off Pine Island Glacier, Antarctica, in September 2017. Instead of drifting out to sea after calving, sea ice impeded the iceberg’s movement, and it cracked up into countless pieces nearly on the spot. Even though it broke up relatively quickly for an iceberg, it is more of a slow-motion shattering. These Landsat images show the change at the end of the glacier. The September 21 image was acquired days before the iceberg broke off. A rift is visible running across the glacier almost 8 kilometers from the calving face. By January 2, 2018, the iceberg had broken into fragments of varying size. The dark feature is a polynya, an area of relatively warmer water, which likely caused the iceberg’s breakup. Landsat 8 has been acquiring observable images roughly every three days from early December to January because of its ability to acquire sunlit nighttime images during Antarctic summer. Frequent acquisitions aid in tracking the movements of the ice pieces and project future behavior of the glacier. |
||||||||||||||||||||||||||||||||
| Uravan, Colorado | Image of the Week | aerial photos, uranium | ||||||||||||||||||||||||||||||||||
| Urban and Agricultural Change in Cairo, Egypt | Image of the Week | irrigation, land conversion, rivers, urban growth, water use | Egypt’s capital city of Cairo lies in the fertile… | Egypt’s capital city of Cairo lies in the fertile Nile River Valley. Historically, Cairo and its agricultural areas have been geographically limited by natural desert borders, but these patterns are changing due to recent reclamation of surrounding desert land. These two images were acquired by the Landsat satellites in 1987 and 2014. During this time period, Cairo’s population has increased from an estimated 6 million in 1986 to over 15 million in 2014. The recent population growth has caused the city and its associated urban areas to expand into the surrounding desert, as seen in the second image. Within the main Nile River Valley, these two images also show an overall increase in developed urban area (grey/brown) versus previous agricultural land use (green). As new urban and agricultural areas are being developed in the desert, they require diversion of water supplies from the main Nile River Valley. This expanded irrigation is indicated by the numerous bright green areas throughout the second image. The Landsat data archive spans more than 40 years and provides a valuable record of changes on the Earth’s surface, including urbanization and agricultural land use change. |
||||||||||||||||||||||||||||||||
| Urban Development | Earthshots | population, urban growth | In 1900, southeastern Florida included a few… |
In 1900, southeastern Florida included a few small towns with a population of 3,592 people. Throughout the 20th century, Miami and other nearby towns steadily grew. According to the U.S. Census Bureau, the population of the Miami Metropolitan Statistical Area in 2016 was 6,066,387. In 1970, its population was listed as 1,267,792. In four and one-half decades, the population increased by over 378%. The urban area of Miami and surrounding suburbs stand out sharply against the dark green wetlands in the Landsat series. The urban areas lie on a slightly higher ridge, 2 to 7 meters above sea level, to form a “backbone” of the heavily urbanized coast. These images show urban development expanding on agricultural land north and west of Homestead. Homestead’s population grew from 13,674 in 1970 to 66,498 in 2015, an increase of 386%. |
Agriculture, Cities, Mining, Water, Wetlands | |||||||||||||||||||||||||||||||
| Urban Development in Bahrain | Image of the Week | airports, artificial islands, irrigation, islands, land conversion, urban growth | ||||||||||||||||||||||||||||||||||
| Urban Expansion | Earthshots | megacity, population, urban growth | Shanghai is expanding in every direction. The… |
Shanghai is expanding in every direction. The city is growing in a similar pattern to other cities around the world. Its population gain is mostly in suburban and exurban areas. Between 1997 and 2008, developed land increased by 219.5%, most of it converted from former cropland. That developed land includes more than just housing. Industry and colleges have also moved to the urban fringe because of more space and lower land prices. The Landsat images show this noticeable increase of development. |
Cities, Coasts | |||||||||||||||||||||||||||||||
| Urban Expansion of Shenyang, China | Image of the Week | population, urban growth | The city of Shenyang is one of the largest cities… | The city of Shenyang is one of the largest cities in northeastern China. Situated along the Hun River, the city is a major transportation hub. It is also an important industrial center, representing the core city of the Shenyang Economic Zone. Its urban and outlying areas are home to over 8 million people. |
||||||||||||||||||||||||||||||||
| Urban Growth | Earthshots | population, solar panels, urban growth | A population boom began in this region in the… |
A population boom began in this region in the 1980s with increases in defense spending—military and aerospace industries became the area’s primary employers. A recession in the early 1990s slowed this growth along with defense spending cuts. The population recovered and grew once again but slowed with the 2008 recession. The population has again since rebounded. Many residents of Antelope Valley now commute to the Los Angeles area. The cost of living is lower and many enjoy living in the smaller urban areas. Despite drifting with the ups and downs of economic trade winds, these Landsat images display this urban growth. These images use near-infrared and shortwave infrared imaging to emphasize the expansion of streets and buildings. Urban and residential areas are in purple hues. Dark green circles and rectangles are farm fields, while the blocky shapes on the left side of the 2020 image are solar panels. The two major cities visible in these images are Lancaster and Palmdale. Lancaster has seen a 252% increase in population since 1980. Palmdale has grown by a whopping 1,231% since 1980. Lancaster
Palmdale
|
Cities, Energy | |||||||||||||||||||||||||||||||
| Urban Growth | Earthshots | airport, freeways, land creation, land reclamation, roads, urban growth | This image series reveals more details about… |
This image series reveals more details about the expansion of Doha’s road network. Roads are arranged concentrically around the old city’s center. Low-rise urban development expands outward from that center, connected by new ring roads and large freeways. In the 1950s, the population of Doha was around 14,000. Increasing oil revenues enabled Qatar to expand economically, resulting in dramatic urban expansion of its capital. The price of oil rose in the 1970s and 1980s, and Doha’s growth increased along with it. Doha grew from around 500,000 people in the late 1990s to 1.5 million in 2011. The city's 2018 estimated population is around 1.7 million. After the turn of the 21st century, Doha’s growth involved adding land area. The amount of coastline increased greatly after 2001 with the additions of the new airport and the high-end residences and businesses of the Pearl-Qatar. |
Cities, Coasts, Deserts | |||||||||||||||||||||||||||||||
| Urban Growth | Earthshots | delta, urban growth | Cairo, shown as the large gray expanse in… |
Cairo, shown as the large gray expanse in these images, increased in population from 1.5 million to 6 million between 1947 and 1986. Its 2023 population was estimated to be just over 22 million. Urban expansion is also noticeable in the other parts of the delta, as indicated by the increased size of the smaller urban areas surrounding Cairo. So, where are the Great Pyramids? They are visible, but Landsat's 30-meter resolution is not designed to show that much detail. |
Agriculture, Cities, Deserts, Water | |||||||||||||||||||||||||||||||
| Urban Growth in Columbus, Ohio | Image of the Week | land conversion, population, rivers, urban growth | Ohio’s capital city, Columbus, is situated along… | Ohio’s capital city, Columbus, is situated along the Scioto River and is one of the fastest growing cities in the state. In 1986, the municipal population was estimated at 600,000. The latest population estimate for Columbus from the U.S. Census Bureau is over 820,000.
|
||||||||||||||||||||||||||||||||
| Urban Growth in Las Vegas, Nevada, USA | Image of the Week | land conversion, population, solar panels, urban growth | Decades of consistent data from Landsat help… | Decades of consistent data from Landsat help scientists monitor the growth of urban areas in a world where more than half of the population lives in cities. For example, Las Vegas, Nevada, one of the fastest growing metropolitan areas in the United States, has seen its population expand from 273,000 in 1972 to 2,204,079 in 2017. That’s an increase of over 700 percent since the launch of the first Landsat satellite. Urban development appears as green and purple in this series of Landsat images. On land covered by asphalt, concrete, rooftops, and other man-made constructs, rain water does not soak into the ground. Instead, it runs off. Landsat-based mapping of land cover and land use is valuable to urban growth studies and modeling to show how increased water runoff affects groundwater quality, as well as the pressure on resources caused by rapidly increasing populations. Also visible in the 2018 Landsat 8 image southeast of Las Vegas is the Nevada Solar One solar farm. The project, which covers 400 acres, generates 64 megawatts of power for 14,000 homes. |
||||||||||||||||||||||||||||||||
| Urban Growth in Morocco 1985-2011 | Image of the Week | earthquakes, urban growth | ||||||||||||||||||||||||||||||||||
| Urban Growth of Maracaibo, Venezuela | Image of the Week | oil, ports, urban growth | The city of Maracaibo, Venezuela, is located on… | The city of Maracaibo, Venezuela, is located on the western shore of a strait that connects Lake Maracaibo to the Gulf of Venezuela. The region is an important source of oil production for Venezuela, and Maracaibo serves as a major port for shipments of oil. This area is also known for its commercial fisheries, shrimp farming, and salt production. |
||||||||||||||||||||||||||||||||
| Urban Growth of the Montgomery, Alabama Area | Image of the Week | land conversion, population, rivers, urban growth | ||||||||||||||||||||||||||||||||||
| Urban Growth: The Minnesota Twin Cities | Image of the Week | population, suburbs, urban growth | ||||||||||||||||||||||||||||||||||
| Urban Heat Island | Earthshots | population, urban growth, urban heat island | Those constructed surfaces have another… |
Those constructed surfaces have another measurable effect. Construction materials like concrete and brick absorb heat. They then release the heat at night, increasing temperatures and creating an urban heat island. One study found that over 2001–2016, the land surface temperature rose in Pune in areas where there is reduced green cover. The outskirts of Pune especially experienced this increase in temperatures. An increase of 4–5 degrees Celsius is possible between the city and rural areas. The urban heat island effect can also mean warmer than normal nighttime temperatures. Besides the urban heat island effect, urbanization can also affect regional climate. Studies have observed that the change in temperatures can cause a change in local wind and precipitation patterns. The urbanization appears in the images as pink and lavender hues. Pink lines are roads that spider-web across the landscape. With the world population becoming increasingly urban, the need for assessment and monitoring of urban areas becomes more important. Decades of consistent data from the Landsat satellites make them effective for this kind of environmental monitoring. |
Cities | |||||||||||||||||||||||||||||||
| USA | Shaded Relief | Shaded Relief Images of specific areas (generally… | Shaded Relief Images of specific areas (generally by state) have been selected from the National Elevation Dataset. For original data details, see NED. |
|||||||||||||||||||||||||||||||||
| Utah | Shaded Relief | Shaded Relief Images of specific areas (generally… | Shaded Relief Images of specific areas (generally by state) have been selected from the National Elevation Dataset. For original data details, see NED. |
|||||||||||||||||||||||||||||||||
| Utah | State Mosaics | Utah mountain peaks, on average, are the tallest… | Utah mountain peaks, on average, are the tallest in the country. The average elevation of the tallest peaks in each of Utah’s counties is 11,222 feet–higher than the same average in any other state. |
|||||||||||||||||||||||||||||||||
| Uzbekistan, South Aral Sea | Earthshots | canals, declassified, fishing, irrigation, lakes, rivers, saltwater, seas, water use | Although using the dam to retain most of the… |
Although using the dam to retain most of the water from the Syr Darya in the North Aral Sea has had beneficial results in Kazakhstan, it means the water in the south is even more depleted. The Amu Darya, which flows through Uzbekistan into the South Aral Sea, is used now more than ever to irrigate crops, reducing the flow to the South Aral. Although improvements in irrigation efficiency could greatly reduce the amount of water used for irrigation, making these improvements has not been a high priority. While the North and South Arals were separating into their own water bodies, the larger South Aral also divided into two lakes: the deep western lake and a shallower eastern lake. An increasingly long channel connects the two water bodies. This channel flows either direction depending on the wind and the relative levels of the two basins. In the past, commercial fishing was also a major industry in the South Aral Sea. In the 1980s, as the salinity level in the Aral Sea was rising, flounder-gloss—a fish species with the ability to reproduce at salinities from 17 to 60 grams per litter—was introduced successfully into the Aral from the Sea of Azov. In the 1990s, it became the only commercial fish species available for catch in the Aral Sea. However, by the end of the 1990s, the salinity reached over 60 grams per liter, which made the South Aral uninhabitable for its last surviving fish species. The salinity level in South Aral is now over 100 grams per liter, and it has no fish. Recent images intermittently show water in the eastern lobe of the South Aral. While the 2014 image shows the eastern lobe of the South Aral as completely dry, the 2015 image shows the return of some water there. The presence of water in the eastern lobe depends on inflow from the Amu Darya and outflow from the North Aral. This cyclical drying and then refilling is expected to continue for some time, even with restoration efforts.
|
Agriculture, Dams, Water | |||||||||||||||||||||||||||||||
| Van Gogh from Space | Earth As Art | islands, phytoplankton | In the style of Van Gogh's painting "Starry Night… | In the style of Van Gogh's painting "Starry Night," massive congregations of greenish phytoplankton swirl in the dark water around Gotland, a Swedish island in the Baltic Sea. Phytoplankton are microscopic marine plants that form the first link in nearly all ocean food chains. Population explosions, or blooms, of phytoplankton, like the one shown here, occur when deep currents bring nutrients up to sunlit surface waters, fueling the growth and reproduction of these tiny plants. |
||||||||||||||||||||||||||||||||
| Vatnajokull Glacier Ice Cap | Earth As Art | ice caps, national parks | Valley glaciers appear as fingers of blue ice… | Valley glaciers appear as fingers of blue ice reaching out from the Vatnajokull Glacier in Iceland's Skaftafell National Park. The park lies on southern edge of Vatnajokull, Europe's largest ice cap. |
||||||||||||||||||||||||||||||||
| Verdi Ice Shelf, Antarctica | Earthshots | ice shelves, icebergs, rifts | Ice shelves surround about three-fourths of… |
Ice shelves surround about three-fourths of Antarctica’s coastline. These floating extensions of glaciers play an important role in stabilizing Antarctica’s mass balance of ice. Ice shelves both grow and shrink. They gain mass from the glaciers that flow into them over land, from snowfall, and from sea water freezing underneath them. They lose mass by calving icebergs or melting from below. Icebergs regularly break off the ends of ice shelves, but ice shelves can collapse—and this can happen quickly. For example, a large portion of the Larsen B ice shelf, located on the Antarctic Peninsula, collapsed in 2002. Over the course of about one month, 3,250 square kilometers of the ice shelf collapsed. The remains of the ice shelf are weakening. An ice shelf collapse can make the glaciers that flow into them more unstable, making them flow faster and recede faster. As glaciers accelerate and recede, more ice ends up in the ocean, contributing to sea level rise. A relatively small ice shelf named Verdi, also located on the Antarctic Peninsula, is showing signs of instability. The rapid development of the rifts seen in these Landsat images suggests that it may be on the verge of collapse. (Black stripes run through some of the images because of the Scan Line Corrector failure on Landsat 7 in May 2003.) |
Glaciers | |||||||||||||||||||||||||||||||
| Vermont | Shaded Relief | Shaded Relief Images of specific areas (generally… | Shaded Relief Images of specific areas (generally by state) have been selected from the National Elevation Dataset. For original data details, see NED. |
|||||||||||||||||||||||||||||||||
| Vermont | State Mosaics | Vermont was the first state admitted to the union… | Vermont was the first state admitted to the union after the original 13 colonies. Vermont’s capital, Montpelier, is the smallest state capital with a population of less than 8,000. |
|||||||||||||||||||||||||||||||||
| Virginia | Shaded Relief | Shaded Relief Images of specific areas (generally… | Shaded Relief Images of specific areas (generally by state) have been selected from the National Elevation Dataset. For original data details, see NED. |
|||||||||||||||||||||||||||||||||
| Virginia | State Mosaics | Sometimes called the “Mother State,” Virginia has… | Sometimes called the “Mother State,” Virginia has produced eight U.S. presidents (more than any other state): George Washington, Thomas Jefferson, James Madison, James Monroe, William Harrison, John Tyler, Zachary Taylor, and Woodrow Wilson. |
|||||||||||||||||||||||||||||||||
| Virtual Road Trip with Landsat | Image of the Week | national parks | Summer vacation plans changed for many in 2020.… | Summer vacation plans changed for many in 2020. Whatever your plans, Landsat can take you on a virtual road trip! Landsat 8, in its sun-synchronous polar orbit, views every national park in the U.S. every 16 days and gathers more photographic data than the most ambitious of tourists. National parks featured:
|
||||||||||||||||||||||||||||||||
| Visible Features | Earthshots | airport, canals, expressways, Inner City, urban growth | Beijing traditionally consisted of the square… |
Beijing traditionally consisted of the square, walled Inner City and the rectangular, walled Outer City to its south. The walls no longer stand, but in their place the Second Ring Road now outlines the Inner City, and canals outline the Outer City. These and the outer Third Ring and Fourth Ring Roads are partly visible in the Landsat images. The Capital Airport is the large runway complex northeast of the city. A new runway opened in 2007, and that expansion can be seen when comparing the 2000 and 2022 images. In 2000, the Capital Airport handled 21.7 million passengers. In 2011, it handled over 77 million passengers. In only 10 years, it moved from the 42nd busiest airport in the world to the 2nd busiest. |
Cities | |||||||||||||||||||||||||||||||
| Volcán de Fuego, Guatemala | Image of the Week | ash, lava flows, volcanoes | Volcán de Fuego in Guatemala erupted on January… | Volcán de Fuego in Guatemala erupted on January 31, 2018, and Landsat 8 acquired an image of the eruption a day later. A plume of ash rises from the mountain’s peak to an altitude of 6,500 meters (21,300 feet). Wind has carried the ash 40 kilometers (25 miles) to the west and southwest. The stratovolcano has erupted on and off for centuries. Evidence of previous eruptions can be seen in the Landsat 7 image from January 8, 2018. The spidery streaks coming from the volcano’s peak are previous pyroclastic and lava flows. A puff of steam casts a narrow shadow toward the northwest in that image as well. Just north of Volcán de Fuego is its twin Acatenango. The instruments onboard Landsat 8 have been spotting volcanic eruptions, floods, wildfires, and myriad other changes to the Earth’s surface since the satellite launched on February 11, 2013. After five years in orbit, Landsat 8 continues the Landsat Program’s unprecedented record of natural and human-induced changes on the global landscape. |
||||||||||||||||||||||||||||||||
| Volcanic Ashfall, Mount Tavurvur | Image of the Week | ash, eruption, volcanoes | Mount Tavurvur erupted on August 29, 2014,… | Mount Tavurvur erupted on August 29, 2014, sending ash over surrounding areas on Papua New Guinea’s New Britain Island. The stratovolcano is located along the eastern edge of the Rabaul Volcanic Complex, and its last major eruption was in 1994. |
||||||||||||||||||||||||||||||||
| Volcano on Spain's La Palma Island | Image of the Week | eruption, islands, lava flows, volcano | @media (min-width: 576px) { .field--name-field-… | Fissures opened on the Cumbre Vieja volcano on September 19. It's the first time it has erupted since 1971.
Landsat 8 shows the island of La Palma in Spain’s Canary Islands, home to more than 86,000 people. Thousands in the path of the lava flows were evacuated. Tall fountains poured lava downhill to the west. Lava up to 12 meters thick has destroyed hundreds of homes.
|
||||||||||||||||||||||||||||||||
| Volcanoes | Earth As Art | volcanoes | Steep-sided volcanic cones along the Chilean-… | Steep-sided volcanic cones along the Chilean-Argentinean border add texture to this "study in blues." Of approximately 1,800 volcanoes scattered across this region, 28 are active. |
||||||||||||||||||||||||||||||||
| Volga River Delta | Earth As Art | deltas, rivers | Where the Volga River flows into the Caspian Sea… | Where the Volga River flows into the Caspian Sea, it creates an extensive delta. The Volga Delta is comprised of more than 500 channels, and sustains the most productive fishing grounds in Eurasia. |
||||||||||||||||||||||||||||||||
| Von Karman Vortices | Earth As Art | clouds, islands | As air flows over and around objects in its path… | As air flows over and around objects in its path, spiraling eddies, known as Von Karman vortices, may form. The vortices in this image were created when prevailing winds sweeping east across the northern Pacific Ocean encountered Alaska's Aleutian Islands. |
||||||||||||||||||||||||||||||||
| Von Karman Vortices in the Atlantic | Image of the Week | Atlantic, clouds, EROS, fluid dynamics, Image of the Week, Landsat, Sandwich Islands, Von Karman | On March 3rd, near South Georgia and the South… | On March 3rd, near South Georgia and the South Sandwich Islands, Landsat 9 captured this dream-like image. This natural color view shows a weather pattern known as a “Von Karman vortex street," caused by prevailing winds from the southeast. A vortex street is a fluid dynamics pattern that describes the chain of swirling clouds created when air passes a volcano, mountain or island. These patterns are striking when found in Landsat imagery, but not especially rare. In fact this same Landsat pass contains another Von Karman chain about 80 miles to the south. Landsat’s 50 year archive contains many other examples. Scientists and communities around the world use Landsat images like these to study the Earth’s fluctuating surface. To learn more, visit eros.usgs.gov/image-of-the-week. |
Water | |||||||||||||||||||||||||||||||
| Vredefort Impact Structure, South Africa | Image of the Week | craters | The Vredefort Impact Structure is the oldest and… | The Vredefort Impact Structure is the oldest and largest known impact crater on Earth. The entire crater is believed to have been about 300 kilometers (186 miles) across and was formed when an asteroid struck the Earth over 2 billion years ago. The asteroid that produced the crater is thought to have been about 5–10 kilometers (3–6 miles) in diameter. The crater’s outline is now mostly hidden because of weathering and erosion. The only remaining visible feature is the crescent-shaped Vredefort Dome, shown in the center of this Landsat 8 image. The remnant dome is thought to have formed as a direct result of the impact. The southeastern portion of the dome has been covered over time by features that were formed later. The Vaal River cuts across the dome remnant and its different rock layers. The city of Parys sits along the Vaal River near the dome. The multicolored geometric shapes to the left and right of the dome are related to agricultural land use. The Landsat 8 optical sensor includes numerous spectral bands that can be used in various combinations, allowing users to accentuate and study specific features on the Earth's surface. This false color image uses a combination of visible and invisible (shortwave infrared) wavelengths to highlight the geological features of the area, in contrast to the surrounding agricultural and urban land use. |
||||||||||||||||||||||||||||||||
| Wadi As-Sirhan Basin, Saudi Arabia | Earthshots | aquifer, center pivots, groundwater, irrigation, water use | Oil and water don’t mix. But in the desert of… |
Oil and water don’t mix. But in the desert of Saudi Arabia, they do have something in common. They are both nonrenewable resources. Almost no agriculture is visible in the 1986 Landsat image of the barren Wadi As-Sirhan basin. Then, in each successive image, more green dots appear in the desert. Each green dot is an agricultural field watered by a center-pivot irrigation system. Water is pumped from an underground aquifer to irrigate the fields of fruit, vegetables, and wheat. Most of this aquifer, called the al-Disi aquifer, is located under the Saudi Arabian desert, but some of it extends northwest into Jordan. Water scarcity in this region brings the potential for conflict. |
Agriculture, Deserts, Water | |||||||||||||||||||||||||||||||
| Wallow Fire in Arizona | Image of the Week | burn scars, smoke | ||||||||||||||||||||||||||||||||||
| War Comes to the Marshes | Earthshots | irrigation, marshes, oil, rivers, water use | The marsh wetlands supported the traditional… |
The marsh wetlands supported the traditional lifestyles of an estimated half-million people. The Marsh Arabs, also known as the Ma’dan, lived for centuries away from outside pressure, a unique subculture based on fishing, harvesting reeds, and raising water buffalo. They were mostly isolated as recently as 1967. In the 1986 image, the wetlands began to be carved out for irrigated agriculture and oil drilling. But the Marsh Arab homeland changed even more when it became a frontline in the Iran-Iraq War. Military embankments were created at the southern end of the wetlands, affecting mostly the Al Hawizeh marshes. Evidence of those embankments is still present in recent imagery. The intriguing shapes and patterns that resulted are even featured in an Earth As Art image. In 1988, above normal rainfall briefly made the marsh extent greater than it had been. However, the marshes were about to experience an even greater shock that led to drastic declines in the supply of water.
1986 2022 |
Water, Wetlands | |||||||||||||||||||||||||||||||
| Washington | Shaded Relief | Shaded Relief Images of specific areas (generally… | Shaded Relief Images of specific areas (generally by state) have been selected from the National Elevation Dataset. For original data details, see NED. |
|||||||||||||||||||||||||||||||||
| Washington | State Mosaics | Mount St. Helens in southeast Washington erupted… | Mount St. Helens in southeast Washington erupted on May 18, 1980. The volcano and 110,000 acres of surrounding land are now part of the Mount St. Helens National Volcanic Monument. |
|||||||||||||||||||||||||||||||||
| Watching Wetlands | Earth As Art | fens | Wetlands have a unique beauty when viewed from… | Wetlands have a unique beauty when viewed from above. This natural color drone image shows the intricate interactions of forest and surface water in this high-altitude wetland called a fen in the Rocky Mountains of Colorado. Wetlands enhance water quality and provide habitats for diverse plant and animal species. Drones help with mapping fens for conservation and restoration studies. |
||||||||||||||||||||||||||||||||
| Water Level Changes | Earthshots | aerial photos, drought, flooding, migration | Even with water diverted from rivers into the… |
Even with water diverted from rivers into the Cheyenne Bottoms, little water makes it to the vast wetland during times of reduced streamflow. Expansion of center pivots in Kansas has led to a lower groundwater level and lower surface flows from streams. Decades of Landsat imagery demonstrate the water level changes over time. The Bottoms experienced flooding in 2007, then began to dry up in 2011. In 2013, the wetland dried up but filled again in late summer in time for the fall migration. The wetlands were wet again in 2016–2017, went through a short drought in 2018, then had a very wet year in 2019. In 2020, the drought returned, and that spun into severe drought in 2022. In addition to Landsat, the EROS archive contains aerial photos. A historical aerial photo from 1954 shows the wetland with the newly constructed dikes to divide it into five pools. The color aerial photo is from 2021 from the USDA NAIP program. A close up shows the location of the inlet canal from Wet Walnut Creek. An outlet channel allows water to drain during heavy rains. It carries water east into Little Cheyenne Creek and eventually to the Arkansas River. Flooding, however, was not the problem in 2022. |
Water, Wetlands | |||||||||||||||||||||||||||||||
| Water Level Fluctuations | Earthshots | islands, lake, rain, river | Lake Chad’s lakebed is flat and shallow, so… |
Lake Chad’s lakebed is flat and shallow, so small changes in water level greatly affect its surface water area. During an average rainy season, the water level in the lake is typically 5–8 meters deep, although it has gone through many wet and dry climatic regimes for thousands of years when water levels were much higher or lower than normal. Therefore, it may be more accurate to think of Lake Chad as a deep wetland than a lake. In fact, Lake Chad can now be divided into three distinct regions: the southern pool, the northern pool, and the Great Barrier. The southern pool is fed by the Chari River, which provides around 90% of Lake Chad’s water. The northern pool is irregularly flooded and contains a series of sand dune islands. The Komadougou-Yobe River, which has become a seasonal river, enters the northern pool but contributes to the lake only in rainy seasons. A ridge referred to as the Great Barrier separates the two pools. Water level fluctuations are not new to Lake Chad. In the last 1,000 years, according to fossil evidence, the lake probably dried out a half-dozen times. A chart shows levels since the 1870s, from actual measurements and from estimates based on Nile River discharge. This image series shows the location of the Chari River delta on the southern end of Lake Chad, along with increasing amounts of wetland. |
Water, Wetlands | |||||||||||||||||||||||||||||||
| Water Levels | Earthshots | drought, lakes, reservoirs, water use | Drought combined with water withdrawals has… |
Drought combined with water withdrawals has caused a drop in the lake’s water level. The reservoir finished filling in 1980. The highest water level recorded was in July 1983. The lowest was in April 2022, when the lake level was down about 185 feet from its high mark. On the chart, the numbers on the left indicate feet above sea level for the lake’s water level. A water level of 3,700 feet is the reservoir at full capacity.
Lake Powell Historical Water Level Data
Source: U.S. Bureau of Reclamation.
|
Dams, Water | |||||||||||||||||||||||||||||||
| Water Use with Molly Maupin and Gabriel Senay | Video - Landsat | |||||||||||||||||||||||||||||||||||
| Water, Gravity Carve Out Magnificent Canyonlands | Image of the Week | canyons, erosion, national parks, rivers | In September 1964, Interior Secretary Stewart… | In September 1964, Interior Secretary Stewart Udall successfully shepherded some of the most remote and rugged terrain within the continental United States into the jurisdiction of the National Park Service (NPS) with the creation of Canyonlands National Park in southeastern Utah. In this 100th anniversary year of the NPS, the Operational Land Imager (OLI) on Landsat 8 has acquired a stunning, false-color image that enhances the park’s irregular topography. No paved roads exist to join together the park’s three main districts—Island in the Sky, the Needles, and the Maze. The Horseshoe Canyon Unit is the detached part of the park in the upper left corner of the image. In the high desert of the Colorado Plateau, countless canyons, mesas, and buttes have emerged over millennia from the eroding forces of water and gravity across the park’s 1,365 square kilometers (527.5 square miles). Perhaps the most accessible district is Island in the Sky, a relatively flat mesa that rises 600 meters above the Green River to the west and the Colorado River to the east. The Needles District in the southeast corner of Canyonlands takes its name from the colorful spires of Cedar Mesa Sandstone that dominate the area. The least accessible district, the Maze, is a remote labyrinth of deep canyons set against a landscape of standing rocks above it. But Canyonlands’ colorful beauty doesn’t end there. Landsat imagery captures the deeply cut meanders and oxbows carved out by ancestral rivers in the national park. It also reveals the distinct, circular Upheaval Dome on the northern border of Canyonlands, a formation that geologists say was either created by a meteorite impact or by the movement of salt layers deep underground. |
||||||||||||||||||||||||||||||||
| Watering the Sahara | Earthshots | aquifer, calibration, center-pivot, irrigation, water use | One of the best test sites, named Egypt-2, was… |
One of the best test sites, named Egypt-2, was steadily reliable until around the late 1990s. In a vast expanse of Sahara Desert in southern Egypt, center pivot irrigation fields began appearing where there had only been sand just a few years before, changing the reflectance. Precipitation is extremely rare here, so how do they get water for all these crops? The region, called Sharq El Owainat, sits atop the Nubian Sandstone Aquifer System. Groundwater from the aquifer is pumped through wells to the surface and spread to the field via center-pivot irrigation sprinklers. The region now produces about a third of Egypt’s wheat crop, which is exported by way of the Sharq El Owainat airport. With all of that land use change happening in the region, Egypt-2 could not continue as a test site.
|
Agriculture, Deserts | |||||||||||||||||||||||||||||||
| Watering the Sahara | Image of the Week | calibration, center pivots, irrigation, land conversion, water use | In a remote part of the Sahara Desert in Egypt,… | In a remote part of the Sahara Desert in Egypt, center pivot irrigation fields fill the landscape. Thanks to the Landsat archive, we can see how dramatically this area has changed over the last 35 years. But until the growth in irrigation, this part of the world hadn't changed much from a satellite's perspective. That's why Landsat calibration engineers originally chose it as a test site to verify the accuracy of incoming surface reflectance data. Changes observed at calibration sites often indicate a shift in sensor response aboard Landsat. In this case, the change was on the land, making the area unsuitable for future calibration efforts. Fortunately, other reliable test sites exist, and engineers continue to rely on them, maintaining Landsat's accuracy, which is crucial in determining the precision of other Earth-observing satellites. Examples of these test sites are available in the EROS Cal/Val Center of Excellence (ECCOE) test site catalog. Read more at https://www.usgs.gov/center-news/calibration-test-site-becomes-agricultural-hotspot
|
||||||||||||||||||||||||||||||||
| Watford City | Earthshots | natural gas, oil | Another growing community is Watford City,… |
Another growing community is Watford City, which built a new high school in 2016, just east of town. In terms of percent increase, Watford City’s growing population is impressive: a 333% increase from 2000 to 2020.
Watford City has also seen the same type of income and home value increases as other nearby towns.
|
Cities, Mining | |||||||||||||||||||||||||||||||
| Wax Lake Delta, Louisiana | Image of the Week | canals, deltas, rivers, sediment | ||||||||||||||||||||||||||||||||||
| Waziristan Hills | Earth As Art | rivers | Deep purple and green hues enhance the Waziristan… | Deep purple and green hues enhance the Waziristan Hills, a mountainous region of northwest Pakistan near the Afghanistan border. A formidable landscape, the Waziristan Hills are a hodgepodge of steep, rugged hills split by narrow passes and deep gorges. Rivers coursing down from the mountains provide water for agriculture in a region of scanty rainfall. |
||||||||||||||||||||||||||||||||
| Weird Watercolor | Earth As Art | lava flows | Green shades seem to be bubbling up like a lava… | Green shades seem to be bubbling up like a lava lamp on the left side of this image from northeastern Kenya. The right side is like rusted metal. The dark green is the result of geologically recent lava flows, and the other colors are different types of soils. Even with few defined shapes, the piece has a strange beauty. |
||||||||||||||||||||||||||||||||
| West Africa Atlas Details Efforts to Manage, Preserve Okomu Forest | Image of the Week | land conversion, logging, oil palm, wildlife sanctuary | A new atlas named Landscapes of West Africa: A… | A new atlas named Landscapes of West Africa: A Window on a Changing World tells the story of transformations and trends across many lands in West Africa, including this look at the threat of human activities in the Okomu Forest Reserve in southern Nigeria. |
||||||||||||||||||||||||||||||||
| West Devils Lake | Earthshots | flooding, floods, lakes, rivers | One flood mitigation plan might be to… |
One flood mitigation plan might be to encourage excess water from Devils Lake to flow through its natural overflow point into the Sheyenne River before the level becomes too high. The problem with this idea is of water quality. As a closed basin lake, Devils Lake contains more sulfates than the Sheyenne River. Devils Lake water cannot simply be pumped into the river. Because the majority of the water enters the west end of the lake, the amount of dissolved solids increases toward the east part of the lake. So even though the natural outflow point is in Stump Lake in the eastern portion of the basin, the state of North Dakota built an outlet on the west side. This outlet can pump up to 250 cubic feet (7 cubic meters) per second into the river. It was built as an emergency outlet to mitigate the damage that could be caused by a natural spillover of the lake. However, when the Sheyenne River is high, the amount of water that can be pumped into it is limited. Landsat imagery is one of many data sources used to help solve the problems caused by the rising levels of Devils Lake. Monitoring the changes caused by the rising waters can help mitigate damage to farmland, roads, and structures. |
Dams, Water | |||||||||||||||||||||||||||||||
| West Fjords | Earth As Art | fjords | The West Fjords are a series of peninsulas in… | The West Fjords are a series of peninsulas in northwestern Iceland. They represent less than one-eighth the country's land area, but their jagged perimeter accounts for more than half of Iceland's total coastline. |
||||||||||||||||||||||||||||||||
| West Virginia | Shaded Relief | Shaded Relief Images of specific areas (generally… | Shaded Relief Images of specific areas (generally by state) have been selected from the National Elevation Dataset. For original data details, see NED. |
|||||||||||||||||||||||||||||||||
| West Virginia | State Mosaics | During the Cold War, the Emergency Relocation… | During the Cold War, the Emergency Relocation Center was built to house members of Congress in the event of a nuclear attack. It is located beneath the Greenbrier Resort in White Sulphur Springs, West Virginia. |
|||||||||||||||||||||||||||||||||
| West Virginia Surface Mining | Image of the Week | coal, land conversion, reclamation, streams | ||||||||||||||||||||||||||||||||||
| Western Asia | Earth As Art | Western Asia, the world's largest continent,… | Western Asia, the world's largest continent, occupies one-third of the Earth's landmass. Although divisions are somewhat arbitrary, Western Asia encompasses the Middle East and countries that surround the Caspian Sea, including Kazakhstan and Russia. |
|||||||||||||||||||||||||||||||||
| Western Fires | Image of the Week | burn scars | ||||||||||||||||||||||||||||||||||
| Western Side | Earthshots | reservoirs, urban growth | Urban growth in Sydney is seen on its western… |
Urban growth in Sydney is seen on its western side. The light greens and purples in this sequence of images are residential and retail areas, and they are expanding over the green and tan colors of a more vegetated landscape. Even with this population growth, natural areas are preserved. The lake that looks like the top of a rooster’s head is Prospect Reservoir. It’s been there since long before satellites. It was completed in 1888 to supply Sydney with water. The earthfill dam that formed the reservoir is 2.2 kilometers long and 26 meters high. The reservoir is surrounded by green in the images—the Prospect Nature Reserve. The purpose of the reserve is to offer environmental education, bushland conservation, and recreation such as walking and biking trails. The 2013 image reveals a new highway that runs in a north-south direction on the west side of Prospect Reservoir. The Westlink M7 toll road opened to traffic in December 2005. North of the reservoir, the highway turns sharply to the east. |
Cities, Coasts | |||||||||||||||||||||||||||||||
| Western Suburbs | Earthshots | airports, freeways, golf courses, population, rivers, stadium, streets, suburbs, urban growth, water use | Images of the western side of the Phoenix… |
Images of the western side of the Phoenix metro area show the city growing out to meet Luke Air Force Base. The base, which opened in 1941, is in the upper left of the images. Just east of the base is an example of the typical urban growth pattern. The 2001 image shows a large bright area, which is the ground being cleared for housing construction. The 2011 image then shows this same area as a new residential area. The Agua Fria River flows from north to south through the middle of these images. However, “flow” might not be the right word—the river is usually dry. North of Phoenix, the New Waddell Dam keeps much of its flow in the Lake Pleasant reservoir. The reach of the river seen in these images is below the dam, and the river flows only when water is released from the dam. A reliable marker of urban growth, freeway expansion, can be seen here as well. Although Interstate 10 does not exist in the 1973 image, it’s the main east-west route seen in the rest of the images. In 1991, a north-south route, the Agua Fria Freeway (Loop 101), is shown as under construction east of Luke Air Force Base. The freeway begins in the northern part of the 1991 image, and by the 2011 image, Loop 101 has connected up with Interstate 10. The 2023 image reveals even more freeway construction west and north of Luke Air Force Base. Loop 101 goes right by a new stadium, only visible in the 2011 and 2023 images. State Farm Stadium, which opened in 2006, is where the Arizona Cardinals of the National Football League play their home games. This retractable roof stadium can be seen as a bright white oval surrounded by dark colored parking lots. The natural grass field can be rolled outside to get sunlight, then rolled inside before a game. In a close-up of the 2015 image, the bright red pixels southeast of the stadium reveal that at the time the image was taken, the field was outside. An image from 2014 shows the stadium with the roof open and the field inside. High-resolution images also show the stadium both with the roof open and closed. An earlier image from 2004 even shows the stadium under construction. |
Cities, Deserts, Water | |||||||||||||||||||||||||||||||
| Western Urban Expansion | Earthshots | construction, golf courses, lakes, population, suburb, urban growth, water use | In these false-color images, bright green… |
In these false-color images, bright green indicates vegetation. As the city expands, you can see a sort of land cover succession as people build on the desert landscape.
|
Cities, Deserts, Water | |||||||||||||||||||||||||||||||
| Westward Expansion | Earthshots | highways, population, urban growth | Pronounced urban/suburban expansion is visible… |
Pronounced urban/suburban expansion is visible on the west edge of the city. The main outer loop highway visible in all images is 1604. New residential areas push westward to expand beyond this outer loop into the surrounding forests. Also noticeable is the addition of Highway 151, which runs from east to west. New retail development can be seen as the small bright white shapes just north of where this highway intersects with 1604. Can you also spot where a golf course was built in this time period? How about the progression of other new roadways? |
Cities | |||||||||||||||||||||||||||||||
| Wet-Dry Cycle | Earthshots | dust, hydrology, lakebed, lakes, playa, scarp, sediments, wind | As dry and dusty as the playa is when it comes… |
As dry and dusty as the playa is when it comes time for Burning Man in late summer, it’s often wet during winter and early spring. Mean annual precipitation in the playa is about 17 centimeters, but water also flows into the playa from melting snow in the mountains to form shallow lakes of varying size. The shortwave infrared and near-infrared bands on the Landsat sensors accentuate water and the land-water boundary. The silty water on the playa pops in bright aqua in the images. The frequent flooding and drying keeps the playa surface firm. It is possible, though rare, for lakes to stay through an entire calendar year, such as from fall 1983 to spring 1985. A September 16, 1984, Landsat image shows the playa as still wet. Most other years, the lakes dry up by midsummer. An image from May 4, 1993, shows an interesting effect. Water from that year’s temporary lake was blown out of its bed to the north by a strong south wind. A shallow scarp, only 20–40 centimeters high, curves around the north edge of the playa and often marks the edge of the lake. But the blue color washes over the scarp in this image. On the other hand, the playa occasionally does not flood at all. If that happens for a few years in a row, the surface can become soft and loose, as happened from 2002 to 2004 when the playa remained dry. After two springs (2005 and 2006) of lake formation and desiccation, flooding restored the surface to a hard and durable crust. If lake formation on the playa becomes less frequent in the future, it could become a source of dust emissions. In this relatively remote area, remote sensing with satellites provides an efficient means to monitor hydrologic conditions. |
Deserts, Water | |||||||||||||||||||||||||||||||
| What Do Landsat Satellites See? | Image of the Week | near-infrared, salt flats, thermal | ||||||||||||||||||||||||||||||||||
| What If the Glacier Dam Doesn't Break? | Earthshots | fjord, ice, lake | If the glacier permanently blocks Russell… |
If the glacier permanently blocks Russell Fjord, the fjord would turn into a 64-kilometer-long lake. This lake would eventually drain into the Situk River at the lake’s southern end. This would disrupt the river’s fisheries and potentially threaten the tourism and economy of Yakutat. A 2015 study found that, given the rate of the glacier’s advance over the past few decades, it’s unlikely that the channel will remain open by the end of this century. Since Hubbard Glacier has been continuously advancing since 1895, there’s good reason for concern over this possibility. The 2010 and 2015 images show an open channel from Russell Fjord to Disenchantment Bay. But notice that even when the channel is open, the opening is narrow. In the 2015 Landsat image, the channel is about 540 meters wide. The channel width also varies annually. If you would like a more scientific explanation of the phenomenon, read a short journal article written by two USGS scientists. And see the USGS press release describing the 2002 event. |
Glaciers, Water | |||||||||||||||||||||||||||||||
| What the Colors Mean | Earthshots | All of the colors in a satellite image,… |
All of the colors in a satellite image, similar to images on a TV or computer monitor, are made up of a combination of red, green, and blue light, or RGB for short. The sensors capture these images in grayscale. These grayscale images are assigned the color red, green, or blue, which display the brightness of each of these colors. When we combine the three images, we get a false color image. With all of the possible combinations of red, green, and blue values, this provides for a display system capable of providing over a million different colors. Each image shows a specific section of the electromagnetic spectrum, called a band. Landsats 1–3 collected data in four different bands. Landsat 5 collected seven different bands, and Landsat 7 collects eight different bands. Landsats 8 and 9 collect 11 different bands. Three of the bands are combined to form an image, each band assigned as red, green, or blue (in that order) to produce natural color, false color, or color-infrared images as demonstrated in the Mt. Vernon, Washington, images. |
Agriculture, Aquaculture, Cities, Coasts, Dams, Deforestation, Deserts, Energy, Fires, Forests, Glaciers, Mining, Mountains, Natural-Disasters, Water, Wetlands, Wildlife | ||||||||||||||||||||||||||||||||
| What the Satellite Images Show | Earthshots | migration | All these snow geese overgrazed their nesting… |
All these snow geese overgrazed their nesting grounds. Many of these shoreline "oases" were transformed to mudflats. Comparison of the 1973 and 1996 Landsat images shows the area of bright, bare shoreline spreading inland into the vegetation, although the tidal change makes it hard to tell how much. To make the changes easier to see, we simplified the Landsat images into one-dimensional "vegetation index" images, showing how much plant life there was in 1973 and 1996. Photosynthesizing plants reflect more infrared energy than visible energy; these images show that difference on a scale of –100 to +100. Green means growing plants, yellow means bare ground, and red means water (though we blacked out Hudson Bay and its inlets). Then, to make the changes even easier to see, we combined the vegetation images into a single change-image, in which green shows where vegetation increased from 1973 to 1996 and red shows where it decreased. There is a definite red swath north of the delta, inland from the beach, which indicates a sharp decrease in vegetation. The beach itself, like most of the image, shows a light yellow-green color, suggesting a slight increase in vegetative growth. This small change could be from an actual increase in vegetation, or just from sensor "noise." Scientists evaluating 1,200 miles of shoreline habitat along Hudson Bay said about a third was severely damaged and another third destroyed. Once the soil is bare the surface temperature increases, which increases evaporation, which leaves behind an accumulation of natural salts on the surface. This salty layer inhibits the recovery of plants. Erosion also damages the thin soil. At nearby La Perouse Bay, scientists built a pen around some bared ground to keep the birds out, and after 12 years there was only 5% regrowth. Despite the loss of forage, the geese keep homing back to the same area, and they keep reproducing using energy gained during migration. The goslings are not so lucky. Many snow goose families at La Perouse Bay walk up to 30 miles to find food, and only 10% of the goslings survive. But adults commonly live and reproduce into their teens, so the population keeps growing. Destroyed habitat could make the aged snow goose population collapse. Already, less-numerous species have been affected; at La Perouse Bay, the numbers of American wigeons, northern shovelers, yellow rails, stilt sandpipers, Hudsonian godwits, and short-billed dowitchers have fallen 90 percent since 1980. Diseases could also sweep through the crowded snow geese, and spread to other bird species. Even if the snow geese don't collapse, the population could sink to a low level of health and productivity. This is a new situation for wildlife managers, who worked for many years to increase population numbers. Many managers want more hunting along the migration flyways. Controlling the food supply is impossible, and reducing habitat on public lands could harm other species. It is also hard to use the nesting geese and eggs for food, since geese and people there live far apart. Government programs would be expensive to set up, and hunters already kill about a half million snow geese annually, which accounts for about two-thirds of adult snow goose mortality. Managers have proposed removing various restrictions on hunting and even subsidies or awards for hunting. Some believe that increased hunting is "too little, too late" to prevent destruction of the habitat and collapse of the population. |
Coasts, Wildlife | |||||||||||||||||||||||||||||||
| When a Glacier Is a Dam | Earthshots | fjord, ice, lake | Hubbard Glacier slides in from the north in… |
Hubbard Glacier slides in from the north in these images. Two bodies of water meet at the end of the glacier. Disenchantment Bay extends to the southwest into Yakutat Bay, which eventually connects to the Gulf of Alaska. Russell Fjord is the narrow body of saltwater extending southeast and is connected to Disenchantment Bay. In May 1986, Hubbard Glacier blocked the outlet of Russell Fjord, creating a dam that formed “Russell Lake.” That summer, the new lake filled with runoff; its water level rose 25 meters, and a decrease in salinity levels threatened its marine life. Around midnight on October 8, 1986, the dam began to give way. In the next 24 hours an estimated 5.3 billion cubic meters of water gushed through the gap, and the fjord was reconnected to Disenchantment Bay, returning to its previous level. |
Glaciers, Water | |||||||||||||||||||||||||||||||
| When a Glacier Is a Dam, Part 2 | Earthshots | fjord, ice, lake | Hubbard Glacier blocked the entrance to… |
Hubbard Glacier blocked the entrance to Russell Fjord again in 2002. The blockage started in June and raised the level of the lake to 18.5 meters above sea level. On August 14, the ice dam broke free, and for the next day and a half, the channel was full of fast-moving ice chunks and debris. By the morning of August 15, the lake level had dropped to 4.8 meters above sea level. |
Glaciers, Water | |||||||||||||||||||||||||||||||
| When Snowfall Takes Sides | Image of the Week | snow, storm, weather | In 2019, a December storm dropped around five… | In 2019, a December storm dropped around five inches of snow over northeast China near Baicheng. If conditions on the ground are right, a snow pattern can reveal a storm's path with remarkable detail. Landsat 8 captured this image of the area, revealing a distinct division between snow cover and clear ground. This stark divide is rare when trees and mountains are present, but not uncommon on flat, harvested croplands. A similar pattern appeared in the midwestern U.S. after a major storm system moved through on the day after Christmas in 2018. The storm left behind a miles-wide trail of white connecting New Mexico and Nebraska. In this Sentinel-2A view, the defined edge breaks around the hilly, forested features near the Cimarron River. The lack of snow could be attributed to those features, but also to slightly warmer temperatures near the river. |
||||||||||||||||||||||||||||||||
| Where Is the Water? | Earthshots | canals, irrigation, rivers, water use | The first question people have when seeing… |
The first question people have when seeing these images of the Aral Sea over time is, Where did the water go? The images that go along with this section show where a lot of it is going. These images are from a Landsat scene south of the Aral Sea, upstream along the Amu Darya. The urban area in the center of the close-up image is Urgench, Uzbekistan. Both images show extensive irrigated cropland along the Amu Darya. Canals can be seen stretching across the region, along with several pools of stored water. There is still plenty of water in the rivers that feed the Aral, it’s just being used before it can get there. |
Agriculture, Dams, Water | |||||||||||||||||||||||||||||||
| Whirlpool Cloud | Earth As Art | clouds | A giant whirlpool cloud, coaxed into shape by… | A giant whirlpool cloud, coaxed into shape by high-altitude winds, swirls above the sea between Spain and Morocco. |
||||||||||||||||||||||||||||||||
| Whirlpool in the Air | Earth As Art | clouds, ice | This image shows a spinning formation of ice,… | This image shows a spinning formation of ice, clouds, and low-lying fog off the eastern coast of Greenland. |
||||||||||||||||||||||||||||||||
| Whitewater Baldy Complex Fire, New Mexico | Image of the Week | burn scars | ||||||||||||||||||||||||||||||||||
| Why does the GEDI orbit footprint look the way it does? | Video - LP DAAC | |||||||||||||||||||||||||||||||||||
| Wildfire Forces Evacuations in Fort McMurray, Alberta | Image of the Week | burn scars, burn severity, near-infrared, shortwave infrared | A massive wildfire burning near Fort McMurray in… | A massive wildfire burning near Fort McMurray in Alberta, Canada, fueled by dry conditions and high winds, has destroyed 1,600 structures and forced more than 88,000 people to evacuate the area so far. |
||||||||||||||||||||||||||||||||
| Wildfires Burn in the Shadow of Mount Rushmore | Image of the Week | wildfire | In late March of 2021, just four miles from the… | In late March of 2021, just four miles from the edge of South Dakota's second-largest city, two wildfires sparked by human activity burned through a section of the Black Hills. The Schroeder fire began on March 29. It was fueled by high winds and dry conditions, spreading rapidly across more than 2000 acres, forcing the evacuation of neighborhoods and businesses. Europe's Copernicus Sentinel-2 satellites and the USGS Landsat 7 satellite captured imagery before, during, and after the weeklong event. A smaller fire began at the same time a few miles to the southwest. The fire was dubbed the “244 Fire,” named for the highway leading to Mount Rushmore National Memorial. It burned 136 acres before containment on April 2, closing off access to the mountain’s famous faces for two days. |
||||||||||||||||||||||||||||||||
| Wildfires Devastate California Wine Country | Image of the Week | burn scars, drought, near-infrared, shortwave infrared, smoke | Residents had little warning when wildfires that… | Residents had little warning when wildfires that ignited late Sunday night, October 8, 2017, were fanned by wind gusts of 50 miles per hour and blasted across California’s wine country. More than 100,000 acres have burned as of October 11, with less than 6 percent of the fires contained. Many homes and businesses have been destroyed in the series of blazes, and many more remained threatened at the time Landsat 8 acquired the October 11 image. Evacuation orders continue. A drought lasting more than 5 years left the region parched. Last winter’s abundant rainfall was welcomed, but it stimulated vegetation growth, which then dried out after a hot, dry summer and became fuel for these fires. Early fall is typically hot and dry in this part of northern California, and winds blowing over the mountain ranges are quickly spreading the wildfires. Gray patches are populated areas in the valleys, though some are obscured by smoke in the October 11 image. Bright green is vegetation, and burned areas are maroon. Landsat’s 30-meter resolution allows detailed mapping of burn severity. Its shortwave infrared (SWIR) and near-infrared (NIR) imaging provide an accurate distinction between burned and unburned vegetation. |
||||||||||||||||||||||||||||||||
| Wildfires In Alberta, Canada | Image of the Week | burn scars | ||||||||||||||||||||||||||||||||||
| Wildfires in Oklahoma | Image of the Week | burn scars, drought, grassland | ||||||||||||||||||||||||||||||||||
| Wildfires in Oregon, USA | Image of the Week | burn scars, lakes | Dry conditions have made this year another busy… | Dry conditions have made this year another busy one for wildfires in the western United States. For example, responders in east-central Oregon are currently fighting several separate fires that were started by lightning near Malheur Lake on July 14, 2014. The combination of high winds, low humidity, and high temperatures has been making the firefighting work difficult. These Landsat images were acquired on July 1, 2014 (left), and again on July 17, 2014. Malheur Lake is in the center of both images. The large fire scars visible in the second image show the area burned within the Buzzard Complex as of July 17. The bright orange areas also show where the fires were continuing to burn at the time the second image was collected. Landsat imagery can be an important tool to help evaluate the areas damaged and destroyed by fire, and can assist in response planning and identifying areas of further risk. Future images from Landsat will also be helpful for monitoring the land recovery after major fires such as this. |
||||||||||||||||||||||||||||||||
| Wildfires Ravage Central, South-Central Chile | Image of the Week | burn scars, fire scars | Wildfires fueled by dry conditions, high… | Wildfires fueled by dry conditions, high temperatures, and strong winds are scorching central Chile at a level Chilean officials say they haven’t seen in decades. Landsat 8 Operational Land Imager (OLI) mosaics on the left from January 24 and February 2 show multiple fire scars growing across the Chilean landscape. The fires, which had consumed roughly 1,060 square miles as of late January, include a large burn area that threatened the city of Empedrado. The two images to the right capture the explosive growth of the fire around the city. On January 24, the burned land can be seen primarily south of Empedrado, with blue smoke and orange flames visible from an active fire on the periphery of the scar. By February 2, the burn scar expanded to completely surround the city, and extends north all the way to and beyond the Maule River. Satellite data have shown smoke from the Chile fires traveling hundreds of miles, reaching areas in the Central South Pacific. As of February 2, 123 active forest fires were registered in Chile by the National Forest Corporation (CONAF). In all, more than 20,000 people, including firefighters and experts from over a dozen countries, helped battle the wildfires, CONAF officials said. |
||||||||||||||||||||||||||||||||
| Wildfires Scorch Large Swaths Along Oklahoma-Kansas Border | Image of the Week | burn scars, grasslands, near-infrared, shortwave infrared | Grasslands made lush by summer rains in 2015 have… | Grasslands made lush by summer rains in 2015 have turned into a tinderbox along the Kansas-Oklahoma border after a dry winter and gusty spring winds transformed the withering vegetation into fire fuel. |
||||||||||||||||||||||||||||||||
| Wildfires Scorch Pampas Region of Argentina | Image of the Week | burn scars, drought, smoke | Since mid-December 2016, roughly two dozen… | Since mid-December 2016, roughly two dozen wildfires in the Pampas region of Argentina have consumed almost 2.5 million acres while unleashing giant plumes of dense smoke above the rural landscapes. |
||||||||||||||||||||||||||||||||
| Wildlife | Earthshots | accident, exclusion zone, nuclear power plant, radiation | The exclusion zone is not officially a… |
The exclusion zone is not officially a wildlife preserve, but with virtually no human intervention in the 1,600-square-mile zone since the accident, wildlife is prospering. Studies with automated cameras have spotted bison, boars, wild horses, beavers, badgers, red foxes, deer, moose, and wolves. Gray wolves are especially abundant. The density of gray wolves there is higher than it is even in Yellowstone National Park. If there are radiation effects on animal populations in the exclusion zone, they are overshadowed by the lack of human intervention in the zone. In short, animals are free to thrive when there are no humans hunting them, building on the land, or hitting them with cars. |
Agriculture, Wildlife | |||||||||||||||||||||||||||||||
| Wildlife | Earthshots | flooding, lakes | Lake Thompson is a crucial habitat for… |
Lake Thompson is a crucial habitat for migratory birds. The simultaneous presence of open water, shallow mudflats, cattail marshes, and wet meadows offers a diverse landscape for shorebirds, waterfowl, wading birds, and gulls. Herons and egrets use the shallow water and mudflats on the lake’s fringes. Pelicans, gulls, terns, and ducks thrive in the open water. The dead trees that remained standing were perfect nesting habitat for cormorants, eagles, herons, and egrets. Eventually, the dead trees collapsed, and the habitat changed again. Besides affecting farmland and wildlife habitats, the expanding lake has flooded several roads. For example, 218th Street, also known as Oldham Grade, crosses the southern part of the lake. It was closed for much of the 1990s. It is open again, but the area’s roads often need repair from the high water. Landsat data can be used to map these changes and help organizations like South Dakota Game, Fish, and Parks understand the interaction between lake levels and wildlife populations. |
Agriculture, Water, Wildlife | |||||||||||||||||||||||||||||||
| Wildlife Refuge | Earthshots | freeways, prairie, urban growth, wildlife refuge | There is a noticeable area of undeveloped land… |
There is a noticeable area of undeveloped land in all that urban growth. Just west of the new airport is open land that is now protected from development. The former area of farmland and grazing land became a chemical weapons manufacturing facility during World War II. Chemical weapons manufacturing ended in 1969, and Shell Oil Co. began using the facility to produce agricultural chemicals. This continued until 1985. Referred to as the most contaminated place in America, environmental recovery efforts at the site began in the 1980s and continue today. The area became Rocky Mountain Arsenal National Wildlife Refuge in 1992. The valuable prairie, wetland, and woodland habitat is a sanctuary for bison, deer, bald eagles, owls, and many other species. The refuge reached its current size of 15,000 acres in 2010 and offers visitors fishing, hiking, and wildlife viewing. USGS aerial photos from 1953 and 1971 show these facilities. Many of the structures are no longer there in recent high-resolution images. |
Cities, Wildlife | |||||||||||||||||||||||||||||||
| Will my workflow be supported? | Video - Find Data | |||||||||||||||||||||||||||||||||||
| Williston | Earthshots | airport, drilling, highways, oil, oil platforms, well pads | Located on the north side of a bend in the… |
Located on the north side of a bend in the Missouri River, Williston is one of the larger cities in the center of the oil boom in North Dakota. The city’s population has more than doubled since the 2000 census.
While pad drilling reduced the impact of necessary infrastructure, more roads are still needed when urban areas expand. A prominent four-lane highway now loops around Williston’s west side—Highway 85. Just to the northwest of where that new highway curves, a new, larger airport was built to meet the needs of the rapidly growing city. Williston Basin International Airport opened in 2019. |
Cities, Mining | |||||||||||||||||||||||||||||||
| Wind | Earthshots | wind, wind power, wind turbines | The open spaces and high winds make the… |
The open spaces and high winds make the northern part of Antelope Valley an ideal wind energy center. It’s also close to Los Angeles, so the length and cost of transmission lines is relatively low. Most of these turbines are grouped around the Tehachapi Pass, where air flow from the Pacific Ocean funnels through the Tehachapi Mountains. Throughout this series of Landsat images, displayed in natural color, new lines are etched in the landscape, like a giant geoglyph. These roads connect to bright spots indicating the locations of wind towers. Most appeared between 2010 and 2014, but many new towers were built in the northern portion of the images at the foothills of the mountain range between 2014 and 2018. The first wind towers, which stood 45 to 60 feet tall, were built in this region in the 1980s. New wind towers are up to 500 feet tall and each produce 1 to 2.4 megawatts of power. The United States Wind Turbine Database shows locations and owners of every wind turbine in the U.S. According to the viewer, the number of wind turbines in this part of the Landsat images is 3,250 with a rated capacity of 2,905 megawatts (as of May 2023). |
Energy | |||||||||||||||||||||||||||||||
| Wind Power | Earth As Art | erosion, kaluts | A bold paint stroke on a busy purple canvas is… | A bold paint stroke on a busy purple canvas is actually part of the Dasht-e Lut Desert in southeastern Iran. The linear features are kaluts, huge rocky formations shaped by wind erosion. The streamlined forms vary in size, but some kaluts stretch more than 100 kilometers (62 miles). |
||||||||||||||||||||||||||||||||
| Wind Power in Texas, United States | Image of the Week | wind power, wind turbines | Wind power is produced by using large generators… | Wind power is produced by using large generators to harness the kinetic energy of wind. It is gaining importance as a large-scale source of renewable energy, and new wind farms are being developed worldwide. |
||||||||||||||||||||||||||||||||
| Wind, Waves Alter Coastal Barriers | Image of the Week | islands | In the United States, barrier beaches and spits… | In the United States, barrier beaches and spits line up along nearly a quarter of the country’s coasts, mostly facing the Atlantic Ocean and Gulf of Mexico. Spits are like islands that connect to a mainland at one end. These barrier systems protect their adjacent mainlands from the full fury of ocean wind and wave energy. They promote critical marsh and wetland habitats. They are living landscapes that grow, shrink, and migrate over time. These images of the southeastern elbow of Cape Cod capture the impact of natural forces that have raised up, shifted, and torn down the Nauset-Monomoy coastal barrier system. In the June 1984 scene acquired by Landsat 5, an unbroken barrier spit protects the Atlantic-facing coast of Chatham, MA, and its harbor. South of the mainland, North and South Monomoy Islands stand apart from each other and the coast. Thirty-one years later, Landsat 8 reveals a landscape reshaped by the natural ebb and flow of waves, currents, winds, and tides. The changes are both subtle and substantial. Storms have breached the barrier spit in several places. By September 2015, the Monomoy islands have grown together. At the same time, waters around North Monomoy are shallower with sandbars and shoals closer to the water surface. Time and the forces of nature will continue this reshaping of the barrier system. As they do, Landsat’s continuous monitoring will be there to document it. |
||||||||||||||||||||||||||||||||
| Winter Ice Cover, Lake Superior (USA/Canada) | Image of the Week | ice, lakes, shipping | The extreme cold of the 2013-2014 winter season… | The extreme cold of the 2013-2014 winter season created historic ice cover on the North American Great Lakes and much slower than normal spring melt. The persistent and widespread ice has affected shipping transportation throughout the Great Lakes region. At one point, the Lake Superior ice cover was estimated to be nearly 95% with an average thickness of 22.6 centimeters (8.9 inches). Pressure ridges and ice motion can also cause plates of ice to buckle and stack, creating local ridges up to 1.5 meters (5 feet) thick in some places. Even though the ice has now started to melt, some areas of this year’s ice cover could last into June. The abnormal thickness and extent of this year’s ice cover caused challenges to the ice breakers that allow shipping to and from ports such as Duluth Harbor. When cutting through very thick ice, it can take many hours to go a very short distance. At one point, as many as 70 ships were awaiting entry into Lake Superior, and the ships were being grouped together as escorted convoys to maximize ice-breaking efforts and allow safe passage. These three Landsat 8 ”natural-color” (3-band composite) images show the Lake Superior area north of Duluth, Minnesota, in February and April 2014. The first image (February 16) shows the ice cover near its maximum. The second image (April 5) shows reduced ice coverage, along with an ice breaker channel that was created to allow ships to enter Duluth Harbor. The third image shows the remaining ice cover as of April 21. Landsat imagery provides a consistent and repetitive view of the Earth’s surface and can be used to help monitor changing conditions over time. |
||||||||||||||||||||||||||||||||
| Winter Storm of 2016 | Image of the Week | airports, rivers, snow, storms, weather | On January 22–24, 2016, a major winter storm… | On January 22–24, 2016, a major winter storm dropped 2 or more feet of snow on much of the U.S. East Coast. Landsat 8 images acquired before and after the storm offer a dramatic view of the Washington, DC, area. Before the storm, there was no snow on the ground; however, on January 24 the landscape had become blanketed in white. |
||||||||||||||||||||||||||||||||
| Wisconsin | Shaded Relief | Shaded Relief Images of specific areas (generally… | Shaded Relief Images of specific areas (generally by state) have been selected from the National Elevation Dataset. For original data details, see NED. |
|||||||||||||||||||||||||||||||||
| Wisconsin | State Mosaics | Wisconsin has more than 15,000 lakes. It also has… | Wisconsin has more than 15,000 lakes. It also has 7,446 streams and rivers, which if placed end to end would stretch nearly 27,000 miles–more than enough to circle the globe at the equator. |
|||||||||||||||||||||||||||||||||
| Wondrous Wetlands | Earth As Art | grassland, rivers | Seventeen rivers flow into the Bangweulu Wetlands… | Seventeen rivers flow into the Bangweulu Wetlands in Zambia, but only one drains out. Green tendrils randomly sweep through the image, a landscape dominated by various grasslands, open water, and dense Papyrus grass and Phragmites reeds. The entire wetland covers an area about the size of Connecticut. |
||||||||||||||||||||||||||||||||
| Woolsey Fire | Image Comparison Sliders | burn scars, near-infrared, shortwave infrared | ||||||||||||||||||||||||||||||||||
| World Cup in Qatar 2022 | Image of the Week | population, stadium, urban growth | While the best soccer players in the world show… | While the best soccer players in the world show off their footwork skills, the best Earth observation satellite program in the world displays its skill at detecting change over time. Landsat images show the rapidly growing city of Doha in Qatar. It's the country's capital and the location of the 2022 men's World Cup. It grew from around 500,000 people in the late 1990s to 1.5 million in 2011. The city's 2022 estimated population is nearly 1.9 million. Lusail is the largest stadium hosting the World Cup with a seating capacity of 80,000. It will host the final on December 18th. |
Cities, Deserts | |||||||||||||||||||||||||||||||
| WorldView-2 Detail | Earthshots | near-infrared | On the edge of the Seno Plain, up against the… |
On the edge of the Seno Plain, up against the Bandiagara escarpment, a brighter red appears in a few areas. This is denser tree cover and vegetation near a seasonal watercourse. But it’s not all tree cover. There is farmland under those trees in a farming strategy called recessive farming, that is, farming when flood waters recede after the rainy season. So the red seen in the Landsat imagery is not only from the trees but also from crops. The trees are darker red tones, and crops are light red. An image from the WorldView-2 satellite shows much more detail, 1.8-meter resolution. Plots of farm fields occupy most of this close-up image. Individual trees are the bright red spots. Villages are the bluish-gray patches. While WorldView-2 does not offer the frequent repeat coverage of Landsat, it does help show enough detail to see whether tree coverage is changing over time. Click this image to see an enlarged view. |
Agriculture | |||||||||||||||||||||||||||||||
| Wyoming | Shaded Relief | Shaded Relief Images of specific areas (generally… | Shaded Relief Images of specific areas (generally by state) have been selected from the National Elevation Dataset. For original data details, see NED. |
|||||||||||||||||||||||||||||||||
| Wyoming | State Mosaics | Wyoming is home to the country’s first official… | Wyoming is home to the country’s first official national park–Yellowstone, the country’s first national forest–Shoshone, and the country’s first national monument–Devil’s Tower. |
|||||||||||||||||||||||||||||||||
| Wyperfeld National Park, Australia | Earthshots | fire scars, lakes | These images show Wyperfeld National Park,… |
These images show Wyperfeld National Park, Victoria, in southeastern Australia. The park is native shrubland—the Australian “bush”—and appears in the Landsat images in dark tones. Grazing land appears pink, and cropland is a green-yellow pattern. Fires occur in the park almost every year, leaving huge fire scars: bright, bared earth that quickly regrows. This area’s dry climate lies between wet coastal forest and interior desert. Within these images, the Wimmera River flows from the wetter south to the drier north, where it dies in a chain of lakes. In these Landsat images, the southernmost lake (Lake Hindmarsh) is always filled, the northernmost (Lake Agnes) is always dry, and the middle lake (Lake Albacutya) is wet in 1977 but dry thereafter, having last filled from 1974 to 1982. Before European settlement, this region was near-forest—shrubs and small trees growing in varying density—with an understory of shrubs or grass. From the 1840s on, much of this bush was burned off to clear land for farming. Forested area (including shrubland) decreased in this region of Australia from an estimated 90% in 1869 to only 30–40% by 1987. Wheat yields in this region were high, so people tried farming even the areas with poorer or sandier soils. Crop failure in these sandy areas gave Wyperfeld the deceptive name “the Big Desert.” These sandy areas can be seen in the Landsat images as sand ridges in the park and as pink areas outside the parks, representing grazing land. |
Fires, Forests | |||||||||||||||||||||||||||||||
| Yanacocha Mine, Peru | Earthshots | gold, open pits | The expanding Yanacocha Mine dominates the… |
The expanding Yanacocha Mine dominates the land change seen in this series of images. Operated by the Newmont Mining Corporation in Greenwood Village, Colorado, the Yanacocha Mine is the second largest gold mine in the world, and the largest in Latin America. Consisting of seven distinct deposits, the open pits cover over 30,000 hectares of land. The mine is located about 45 kilometers from Cajamarca in northern Peru on top of Yanacocha Mountain at an altitude of 4,700 meters, nestled in the Andes Mountains. Mining operations at Yanacocha have been continuously expanding since 1993. Production peaked in 2005 when the mine produced 3.33 million ounces of gold. In 2014, just over 1 million ounces of gold came out of the mine. As of December 31, 2014, reserves are estimated to be 155 metric tons of gold. In these false-color Landsat images, the expansion of the open pit mining is shown in varying shades of pink. Green is vegetation, and agricultural areas near the city of Cajamarca (visible as bright pink and purple shades) appear as bright green in the bottom center of the images. |
Mining | |||||||||||||||||||||||||||||||
| Yarki Island and Lake Baikal, Russia | Image of the Week | islands, lakes, rivers, sediment | Located in southern Siberia in Russia, Lake… | Located in southern Siberia in Russia, Lake Baikal is the deepest lake in the world (1,700 m) and contains 20 percent of the fresh surface water on the planet. Because of its geologic age and geographic isolation, more than 80 percent of the lake’s freshwater species are found only at Lake Baikal. A narrow sand spit stretches across the lake’s north end to form Yarki Island, which separates the northernmost shoreline from the open water. This long, discontinuous land surface is the result of accumulated sediments from several rivers flowing in from the north, combined with the interaction of these sediments with incoming waves, wind, and storms from the main lake to the south. The shallow lagoon that is created behind Yarki Island is filled with relatively warm waters and peat deposits, and forms an important bird sanctuary. This Landsat image shows the area around Yarki Island and northernmost Lake Baikal. The green tones in the lagoon area depict vegetative sediments. The mouth of the Verkhnaya Angara River can be seen on the right side of the image. |
||||||||||||||||||||||||||||||||
| Yellowknife Wetlands | Earth As Art | lakes | Extensive wetlands lie near the town of… | Extensive wetlands lie near the town of Yellowknife, near the Great Slave Lake in Northwest Territories, Canada. The shallow lakes seen in this image have formed in grooves in the landscape that were carved by glaciers during the last Ice Age. |
||||||||||||||||||||||||||||||||
| Yellowstone Lake | Earthshots | fire scars, lakes, recovery | As you look through this time series, see if… |
As you look through this time series, see if you can identify new fires that occurred after the big 1988 fires. Even the latest image is a patchwork of undisturbed forest, areas at different stages of recovery from fire, and fresh burn scars. Fires continue to burn in Yellowstone, and future fires are expected. Scientists have noticed that the average number of lightning-started fires has been increasing each year since the 1990s. In the near future, the western United States will likely have increasingly intense wildfires. |
Fires, Forests, Natural-Disasters | |||||||||||||||||||||||||||||||
| Yellowstone National Park, USA | Earthshots | burn severity, fire scars, infrared, lakes, recovery | The summer of 1988 was unusually dry in the… |
The summer of 1988 was unusually dry in the western United States. Dry cold fronts brought high wind and lightning but no rain. Along with high temperatures, these conditions created extreme fire danger. Yellowstone National Park encompasses about 2,221,800 total acres. By mid-July 1988, 8,500 acres had burned in greater Yellowstone. That’s not too unusual. But by the end of July, the dry conditions were quickly making the fires uncontrollable, and the fires grew to about 99,000 acres. On August 20, strong winds increased the size of the fires and 150,000 acres burned on that one day. The fires did not stop until snow came in September. In total, more than 793,000 acres, or 36 percent of the park, burned. Yellowstone is representative of temperate mountain ecosystems throughout western North America. What is learned from the massive 1988 fires and subsequent recovery of these ecosystems can be applied to other regions. |
Fires, Forests, Natural-Disasters | |||||||||||||||||||||||||||||||
| Yucca Flat, Nevada, USA | Earthshots | aerial photos, craters, declassified | One of the most cratered… |
One of the most cratered landscapes on Earth is part of the Nevada desert called Yucca Flat. The craters are the remnants of decades of nuclear tests conducted by the U.S. government since early in the Cold War. At the Nevada Test Site, located about 65 miles northwest of Las Vegas, 928 nuclear tests took place: 100 were atmospheric and the rest were underground. It’s those underground tests that made the craters—so they are technically not impact craters but subsidence craters. The flat basin of the Nellis Air Force Gunnery and Bombing Range, which is also filled with arid grasses, forbs, and shrubs, provided security and secrecy for these tests. |
Deserts | |||||||||||||||||||||||||||||||
| Yukon Delta | Earth As Art | deltas, rivers | After beginning in northern British Columbia and… | After beginning in northern British Columbia and flowing through Yukon in Canada, the Yukon River crosses Alaska, USA, before emptying into the Bering Sea. Countless lakes, sloughs, and ponds are scattered throughout this scene of the Yukon Delta. The river's sinuous, branching waterways seem like blood vessels branching out to enclose an organ. It is one of the largest river deltas in the world, and currently (2010) protected as part of the Yukon Delta National Wildlife Refuge. |
||||||||||||||||||||||||||||||||
| Yukon Delta | Earth As Art | deltas, ice, lakes, rivers | An intricate maze of small lakes and waterways… | An intricate maze of small lakes and waterways define the Yukon Delta at the confluence of Alaska's Yukon and Kuskokwim Rivers with the frigid Bering Sea. Wildlife abounds on the delta and offshore where sheets of sea ice form during the coldest months of the year. |
||||||||||||||||||||||||||||||||
| Zabol | Earthshots | canal, lake, reservoir | The lakes visible in these close-up images are… |
The lakes visible in these close-up images are the Chah-Nimeh reservoirs. These natural cavities in the southern Sistan plain are near Zabol, Iran, which is seen in the upper left of these images. The water in these reservoirs provides drinking water for Zabol, whose 2013 population was about 122,000. Canals connecting the reservoirs can be seen along with a canal that that branches off the Helmand River, on the right. A field study conducted in December 2009 and January 2010 found a low level of water flow in the Helmand River, which failed to reach Lake Hamoun. Instead, the water was diverted to the Chah-Nimeh reservoirs. |
Deserts, Water, Wetlands | |||||||||||||||||||||||||||||||
| Zapata Peninsula | Image of the Week | coral reefs, marshlands | The Zapata Peninsula is located in western Cuba.… | The Zapata Peninsula is located in western Cuba. Most of this sparsely populated area lies within the Ciénaga de Zapata National Park and UNESCO-designated Biosphere Reserve. |
 — rift that began the calving events, Petermann Glacier, Greenland")
 — area showing rift that began the calving events, Petermann Glacier, Greenland")


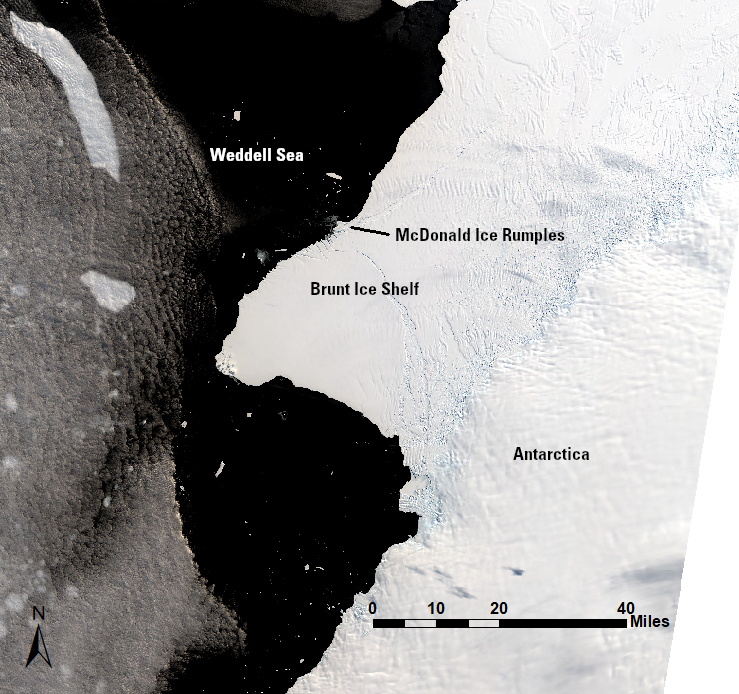


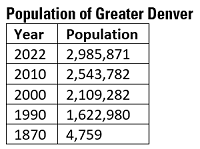
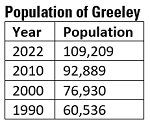


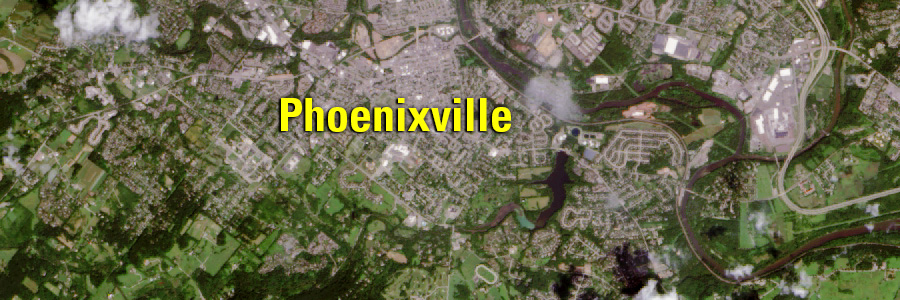
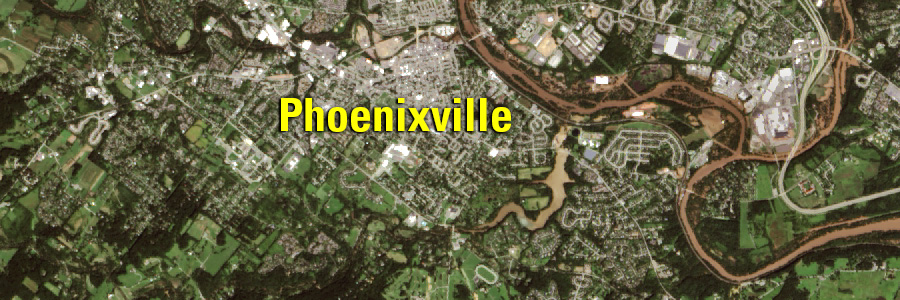


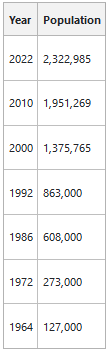
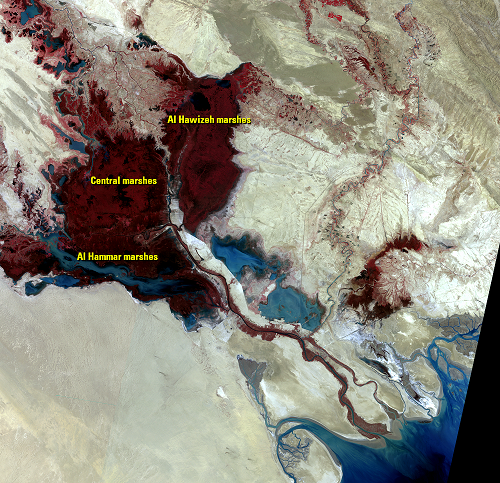
.")


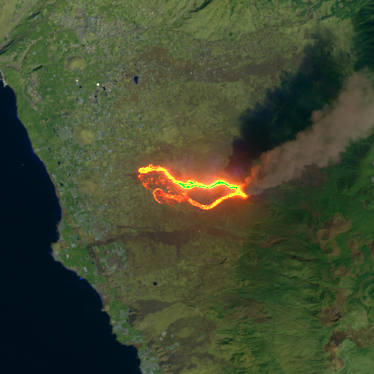
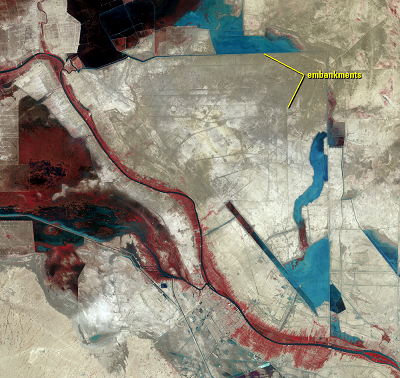
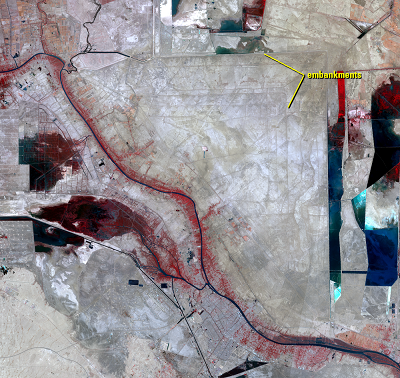
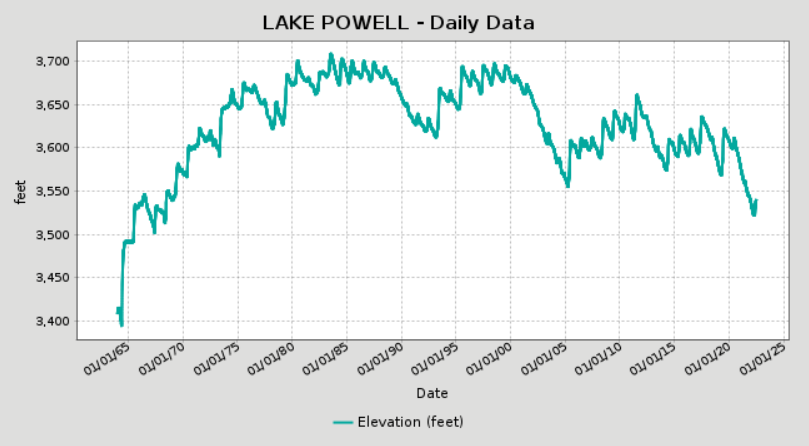
