
Missing Mangroves
Earth Resources Observation and Science (EROS) Center - Earthshots
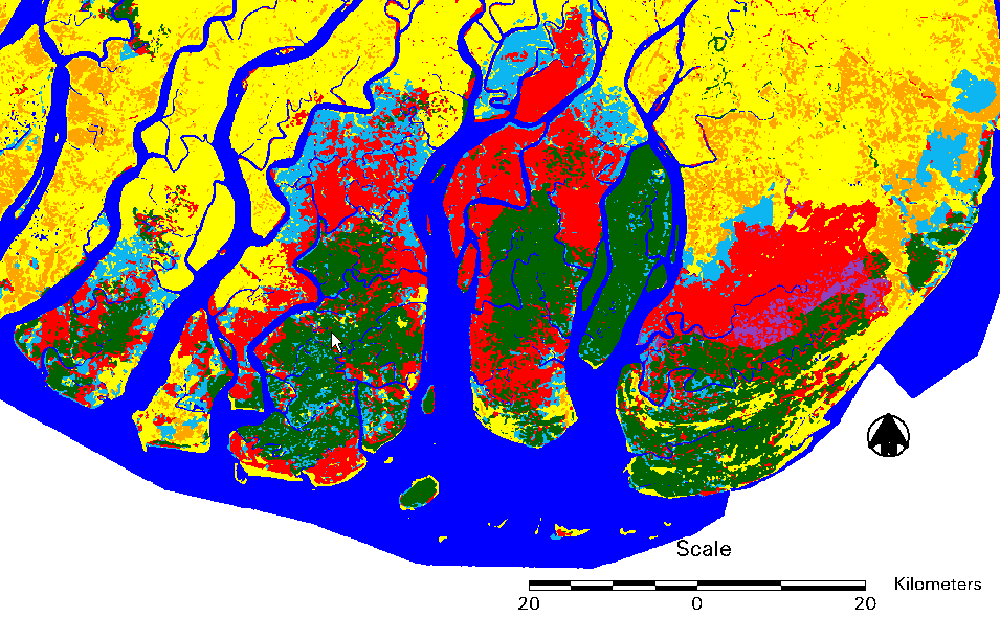
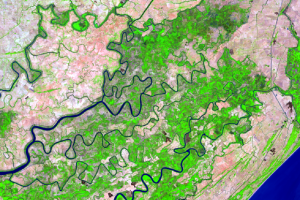
Scientists have been tracking the distribution of the mangrove forests in the Ayeyarwady Delta using satellite observations dating back to the 1970s. The change map shows when and where mangrove loss occurred. Green indicates current mangrove forest as of 2005. However, red dominates the map, which means that much of the mangrove loss occurred during the 1990s.
.")
Imagery
Downloads
Related Content
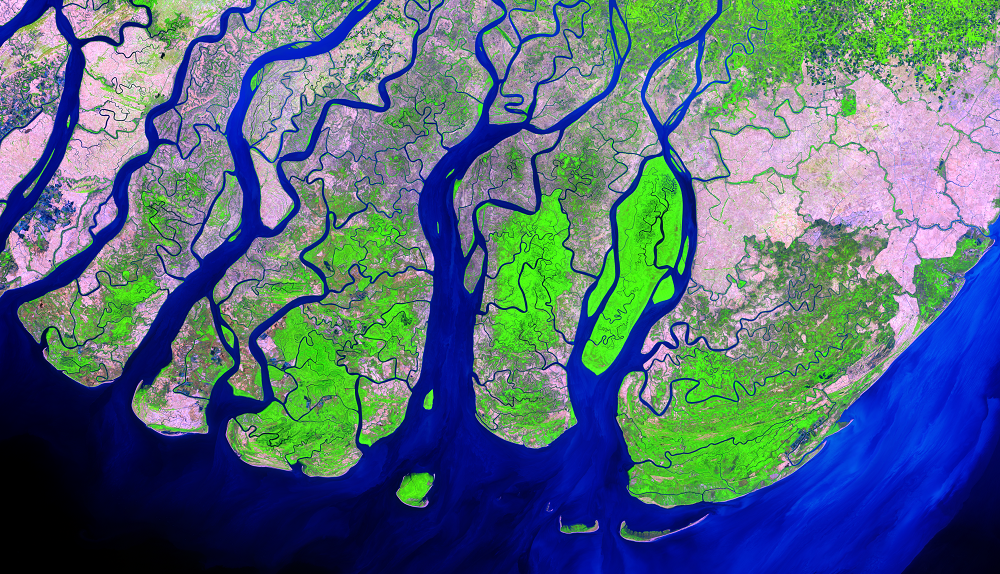
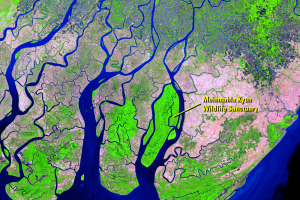
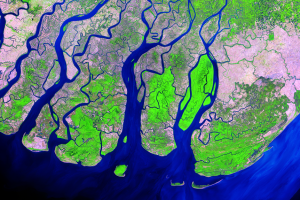
Ayeyarwady Delta, Myanmar
The Ayeyarwady Delta—also called the Irrawaddy Delta—is a vast alluvia...
Mangrove Benefits
Mangroves are sturdy species. They can recover from storm disturbances...
Missing Mangroves
Scientists have been tracking the distribution of the mangrove forests...
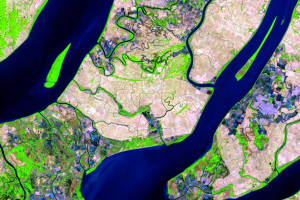
Degradation
People are drawn to delta and coastal regions, and about 7.7 million p...
Aquaculture
Mangroves in the Ayeyarwady Delta are also being replaced by aquacultu...