
The BLM National Operations Center (NOC), through a National Aeronautical and Space Administration (NASA) ROSES grant, has partnered with the U.S. Geological Survey and the University of California, Los Angeles researchers to create an online mapping application called LandCART: Landscape Cover Analysis and Reporting Tools. LandCART will enhance the BLM’s ability to produce estimates of Assessment, Inventory, and Monitoring (AIM) indicators using NASA Earth observation data in places and times where in situ data are not available. This tool will address user-defined management questions, particularly trend analysis questions, and provide documentation required by the National Environmental Policy Act (NEPA). Therefore, LandCART will support exporting of the input and output data, along with information from the underlying algorithm, to ensure reproducibility and appropriate NEPA documentation. Predictions will be accompanied by error and confidence estimates to enhance their utility in decision making. LandCART is currently in a beta testing stage with all the programming, design, and calculations performed in Google Earth Engine and the application served in Earth Engine Apps with expectations of publishing within the Google Cloud Platform as the project is completed. Four tools have been developed thus far: (1) Mapping Tool – to predict and visualize one area of interest (AOI), one time period of interest (TOI), and one indicator of interest (IOI); (2) Cover Change Tool – to predict and visualize one AOI, two TOIs, and one IOI; (3) Timeseries Tool (see figures) – to predict, visualize, and download one AOI, annual data from 1984 to present, and all available indicators as needed; and (4) Spatial Comparison Tool – to predict and visualize two AOIs, one TOI, and one IOI. Current case studies using LandCART data include sage grouse brood habitat mapping and change detection, wild horse and burro habitat mapping, and trend analysis of grazing allotments and management decisions for those areas. The project is in its 4th of four years with the expectation of publishing a fully functional online application for use by all BLM staff as well as the general public.
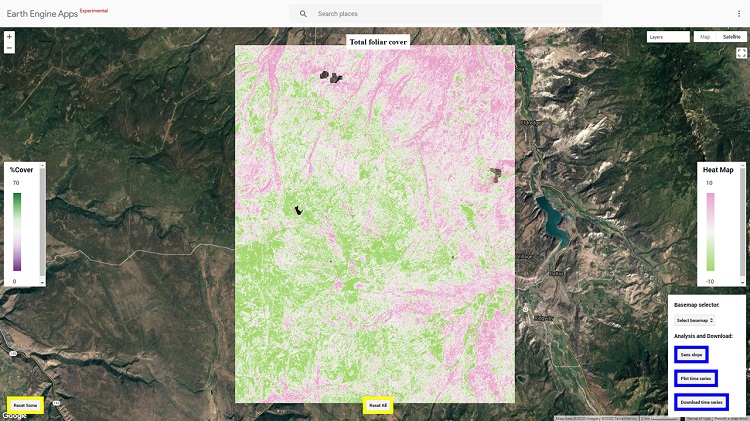
Heat map of change of growing season fractional total foliar cover prediction from 1984 to 2018, near Montrose, Colorado, displayed in the beta testing version of LandCART. In the figure, north is oriented toward the top and the rectangular area shown is 22 km E-W and 28 km N-S. Base map data ©2020 Google Imagery ©2020 TerraMetrics.