
The Bureau of Land Management (BLM) National Operations Center (NOC), through a National Aeronautics and Space Administration (NASA) Research Opportunities in Space and Earth Science grant, partnered with researchers from the U.S. Geological Survey and University of California–Los Angeles to create an online mapping application called LandCART: Landscape Cover Analysis and Reporting Tools. LandCART V1.0 was released on February 16, 2022. LandCART enhances the BLM’s ability to produce estimates of Assessment, Inventory, and Monitoring (AIM) indicators using NASA Earth observation data in places and times where in situ data are not available. The tool is being used to address user-defined management questions—particularly change and trend analysis questions—and to provide documentation required by the National Environmental Policy Act (NEPA). LandCART can export the predicted data with associated Federal Geographic Data Committee (FGDC)-compliant metadata to ensure reproducibility and appropriate NEPA documentation. Predictions are accompanied by error and confidence estimates to enhance their utility in decision making. Four tools are available in the LandCART app. (1) The LandCART Cover Tool calculates an AIM indicator for one location at one time. It produces a predicted indicator map, a distribution histogram, and simple summary statistics. (2) The LandCART Cover Change Tool calculates an AIM indicator for one area at two different times. It produces two indicator maps, a difference map, and comparative histograms, and conducts a two-sample Kolmogorov-Smirnoff test of differences for the histograms and a one-sample Kolmogorov-Smirnoff test for similarity between the difference histogram and a normal distribution. (3) The LandCART Time Series Tool calculates a time series for a chosen AIM indicator and a difference map to illustrate what change has taken place between the first and last step of the time series. It produces multiple indicator maps and comparative histograms for each time step in the time series, plots the time series median values, and conducts a Sen's slope test for trend. Annual predictions can be developed for 1984 to present. (4) The LandCART Spatial Compare Tool calculates an AIM indicator for two different locations at one time. It produces two indicator maps and comparative histograms and conducts a Kolmogorov-Smirnoff test of differences for the histograms. LandCART can be used by land managers in a decision-making framework for ecological transformation and adaptive management. The application can be accessed at http://landcart.org.
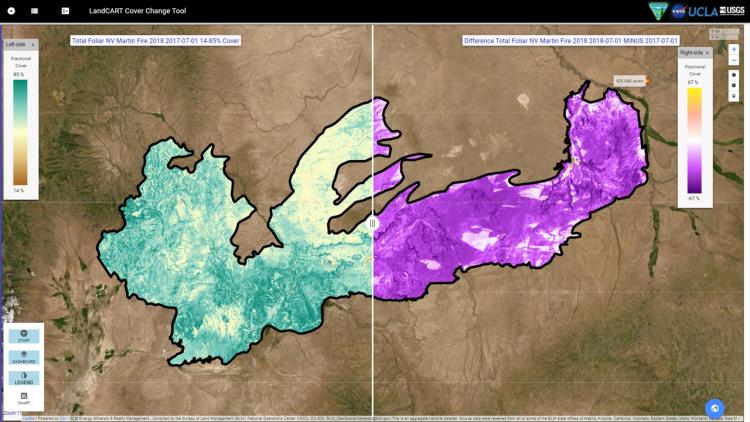
Distribution of Total Foliar vegetation (left) and change of Total Foliar vegetation from 2017 to 2018 (right) within the boundary of the 2018 Martin Fire in Nevada. Purple indicates a large decrease in Total Foliar vegetation, white indicates no change, and yellow indicates an increase. Predicted and displayed with the LandCART V1.0 Cover Change Tool.
Disclaimer: Any use of trade, firm, or product names is for descriptive purposes only and does not imply endorsement by the U.S. Government.