
Glaciers are an iconic part of the landscape in south-central Alaska and cover approximately half of Kenai Fjords National Park. Glaciers play a role in local terrestrial, freshwater, and marine ecosystems and are one of the highlights for local tours. Like most glaciers in Alaska, the glaciers in Kenai Fjords have been shrinking. Although these changes have been documented via repeat photos and quantified in decadal and multi-decadal studies, annual changes of most glaciers in the fjords were previously unquantified.
Because glaciers are constantly either retreating or advancing, the position of the terminus, or end of the glacier, is a benchmark for measuring change over time. The termination type, which is the class of landform at the terminus edge, is another important characteristic of glacier dynamics. The research team developed a database of annual and seasonal terminus positions (when imagery was available) for 19 maritime glaciers in Kenai Fjords National Park from the last 38 years. They used Landsat 4–8 imagery from 1984 through 2021 to manually map the lower glacier ice margins and to measure seasonal changes of each glacier. The glacier retreat rates were compared based on termination types. Of these glaciers, six were tidewater, three were lake-terminating, six were land-terminating, and four terminated in more than one environment throughout the study period. The mapped ice margins were used to quantify seasonal terminus position and areal change, including distinguishing between ice loss at glacier termini and along glacier margins. Overall, 13 glaciers substantially retreated, 14 lost substantial area, and two underwent both net advance and area gain. The glaciers that had insubstantial length and area changes were predominantly tidewater, and the glaciers that experienced the greatest rates of change were lake-terminating. Cumulatively, the lower reaches of these 19 glaciers lost 42 square kilometers of ice, which was nearly evenly distributed between the terminus and the lateral margins.
The rapid rate of glacier change and subsequent land cover changes are noticeable to visitors and park managers at Kenai Fjords National Park. This study quantifies those changes in terms of glacier length and area and highlights the potential usefulness for continuous monitoring in dynamic landscapes such as Kenai Fjords National Park to improve understanding of glacier change. The associated manuscript can be found here.
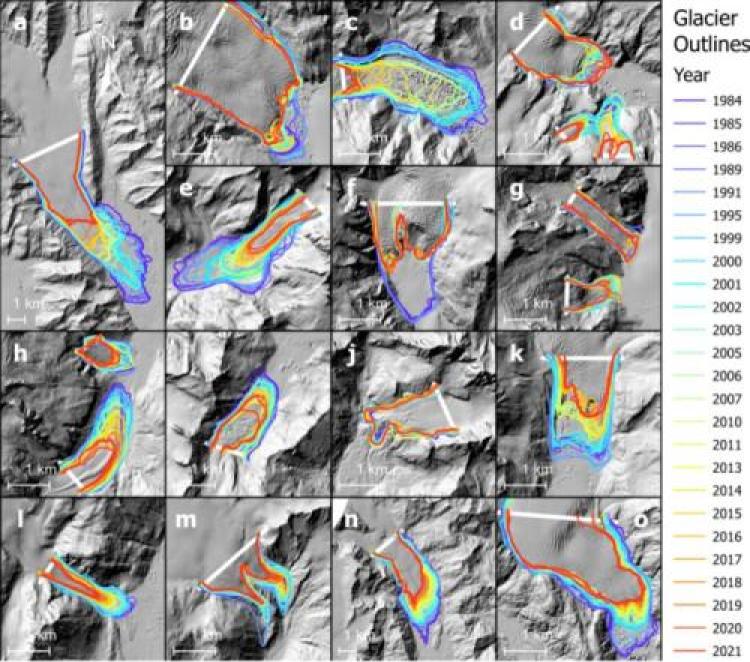
Maps of all seasonal outlines traced for the 19 glaciers in the study. The color scale ranges from purple as the oldest (1984) to red as the youngest (2021). Glacier reference lines are shown in white. Maps (a) and (n) are shown at 1:250 000 scale, and all others are at 1:100 000 scale. The base image is a hillshade of a digital elevation model (DEM) from a structure-from-motion data acquisition in 2016 coordinated by the U.S. Fish and Wildlife Service.
Disclaimer: Any use of trade, firm, or product names is for descriptive purposes only and does not imply endorsement by the U.S. Government.