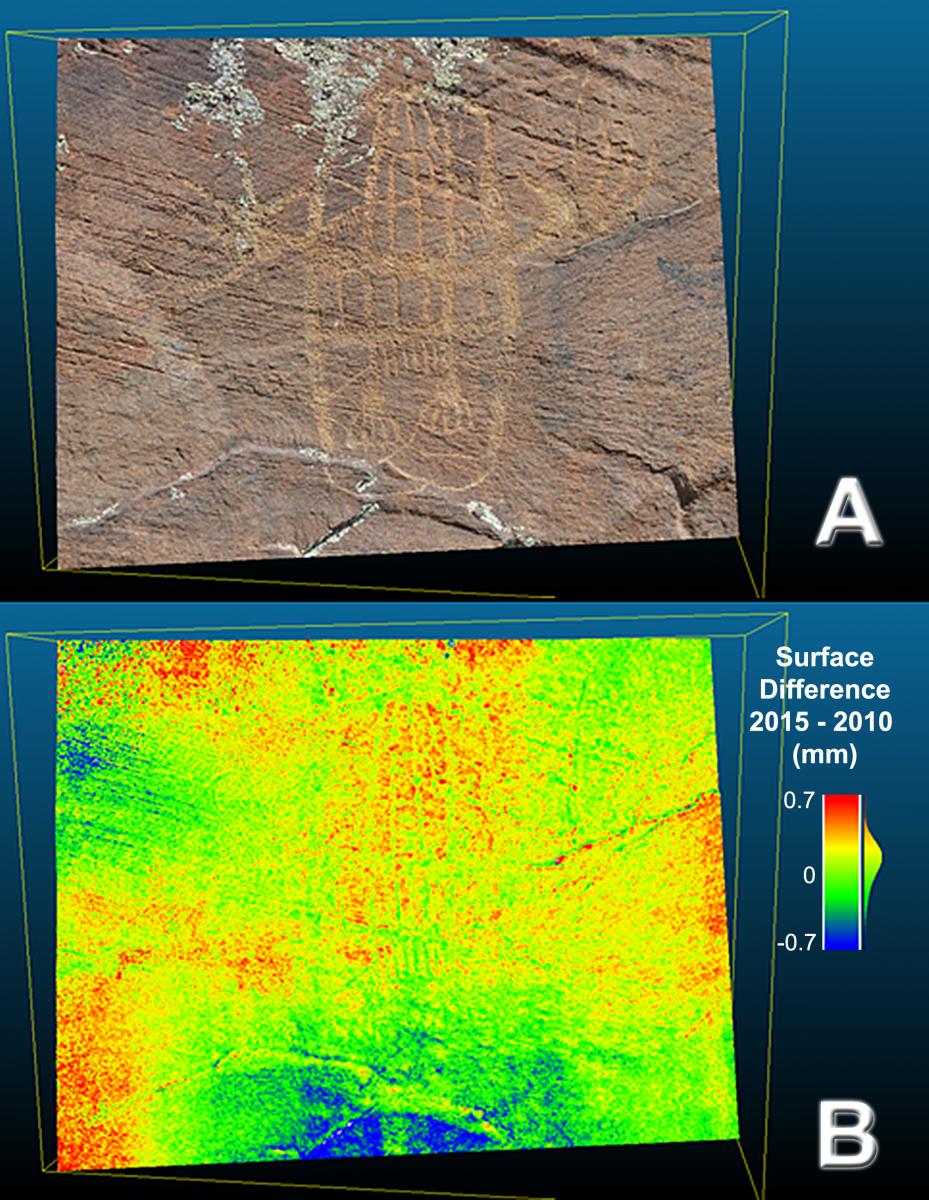
During analysis of potential impacts to cultural resources as a result of extraction activities at the Meeteetse Draw Bentonite Mine in Wyoming’s Big Horn Basin, concerns of indirect impacts to prehistoric rock art sites from dust abrasion and vibration resulted in the formulation of an annual monitoring plan for seven sites. BLM staff acquired digital stereo imagery of one panel at each site beginning in 2008; regular annual acquisitions began in 2013 after active mining operations began. Stereo images were processed into 3D point clouds using PhotoScan 1.1.6 (Agisoft, St Petersburg, Russia), with models scaled using multiple calibrated scalebars. Six of seven models showed model error of less than 1 mm, while a seventh site, which had only two scalebars in the model, showed an unusually high error of 1.1 cm. BLM personnel used CloudCompare 2.6.2 (Cloud Compare Open Source Project) to compare the earliest reference surface to the most recent surface. At all sites, the mean difference between reference and comparison surfaces was less than 1 mm, with a mean difference of 60 µm between years from all sites. In all cases, the mean difference between temporally modelled surfaces was less than 2 standard deviations of the differences (95% of the normal distribution). None of the surface changes were significant at α = 0.05, meaning that all measured differences were within the margin of error and could be random noise. Furthermore, the image acquisition technique resulted in model precision that could realistically be expected to detect change only in excess of approximately 5 mm, so the differences seen thus far are below the detection threshold of the technique. Improving camera resolution and acquisition technique should improve the detection threshold. The panels will continue to be monitored for the operational life of the mine.

One of the seven panels monitored, showing the colored 3D point cloud derived from 2015 images (A) and the surface comparison (B) showing differences between the 2010- and 2015-modeled surfaces of 1 mm. The point cloud is composed of >5.4 million points, each coded with RGB values derived directly from the original stereo imagery.

