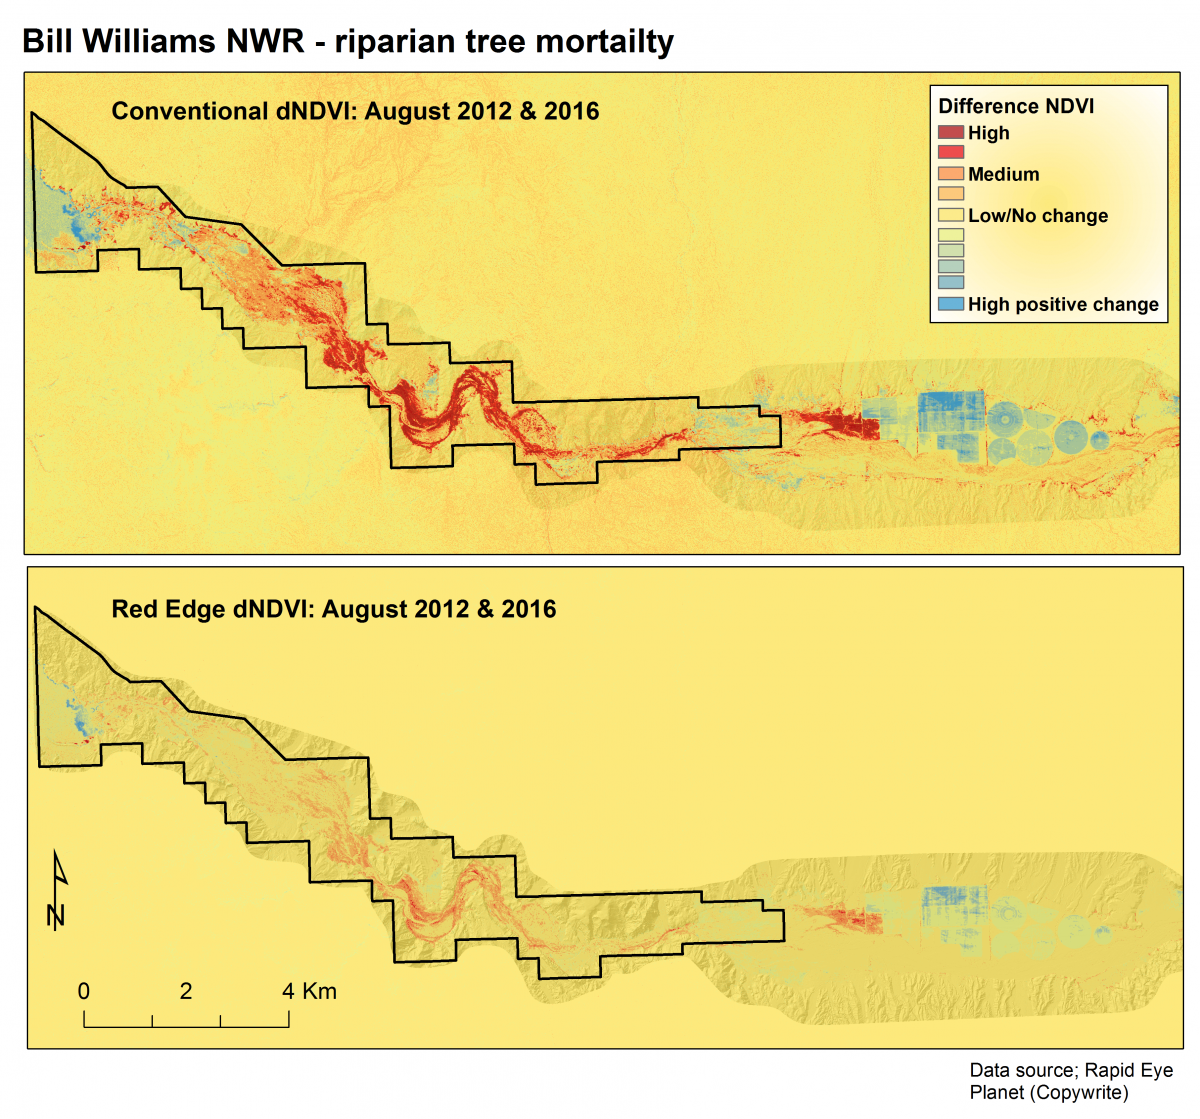
The Bill Williams River is a tributary to the lower Colorado River and maintains one of the few examples of naturally regenerating cottonwood-willow gallery forest in the region. Gallery forest provides habitat for the endangered Southwest Willow Flycatcher (Empidonax traillii extimus) and other important waterfowl, mammal, and amphibian species. Tree mortality and dieback of cottonwoods (Populus spp.), willows (Salix spp.), and saltcedar (Tamarix spp.) have increased within the riparian corridor since 2013 and become widespread in 2016.
High temporal and spatial resolution imagery from the RapidEye sensor are being tested to monitor these changes and distinguish recent tree mortality and dieback (e.g. foliage loss) on the Bill Williams NWR (BWNWR) located in western Arizona. RapidEye images for August 2012 and 2016 were obtained for BWNWR and processed using the ENVI v. 5.4 software package. RapidEye’s five spectral bands are well suited for monitoring vegetation changes, and consist of blue (440–510nm), green (520–590nm), red (630–685nm), red edge (RE, 690–730), and near-infrared (NIR, 760–850) with a 12-bit dynamic range and 5-m pixel size. For both years (2012 and 2016), the conventional normalized difference vegetation index (NDVI = NIR – Red / NIR + Red) and the normalized difference vegetation red edge index (NDRE = RE – Red / RE + Red) were calculated. The band math tool was used to calculate two separate difference metrics (dNDVI and dNDRE) as follows: dNDVI = NDVI(2012) – NDVI(2016) and dNDRE = NDRE(2012) – NDRE(2016). In addition, vegetation canopy height from airborne laser altimetry (lidar) collected in 2014 was used to visually identify differing tree cohorts possibly susceptible to dieback.
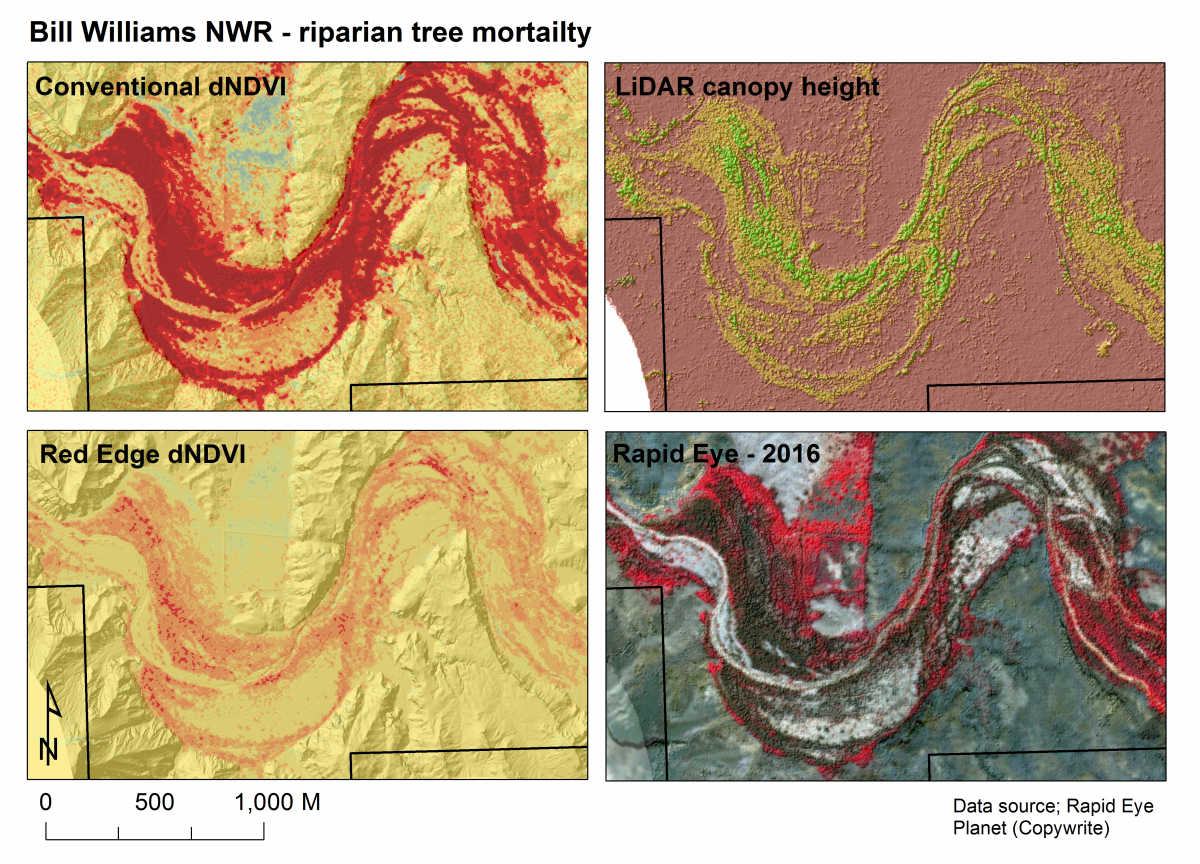
Study results showed tree dieback on BWNWR was readily detected using both NDVI and NDRE images, with higher magnitude of dieback estimated using dNDVI. Field verification is being used to determine which index is superior for estimating the extent and magnitude of tree mortality and dieback on BWNWR. It was also evident from lidar canopy height data that multiple tree cohorts and species have been impacted by stress factors. These data provide a basis to generate and test hypotheses about primary causal agents leading to tree declines on the refuge. RapidEye imagery obtained from Planet.com since 2008 allows for frequent coverage of all 47 refuges across the FWS Southwest Region.

Difference NDVI and NDRE detecting potential tree mortality and dieback areas on the Bill Williams NWR (black outline) using NDVI and NDRE values calculated from August 2012 and 2016 RapidEye satellite imagery.

Visual comparison of dNDVI and dNDRE with lidar tree canopy height and RapidEye imagery (bands 5,3,2). Darkened areas (black) within the RapidEye image are suspected areas of high tree mortality and dieback.

