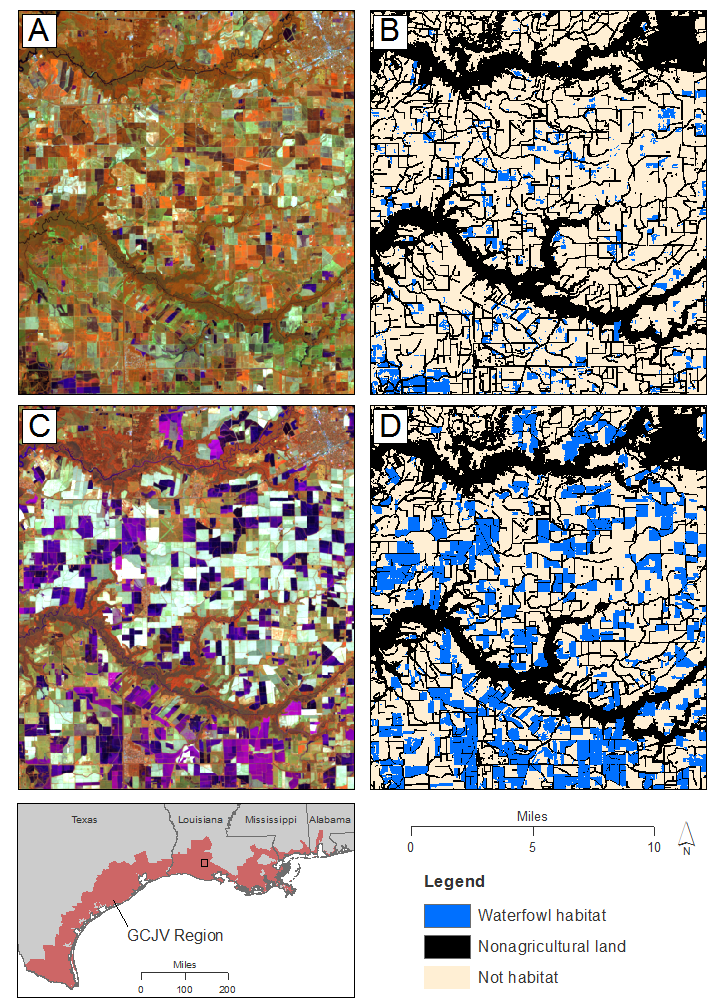
The western U.S. Gulf of Mexico coast provides important habitat for migrating waterfowl and shorebirds. The Gulf Coast Joint Venture (GCJV) uses bioenergetic models (i.e., models that incorporate species-specific population objectives, temporal residency, energy demand of birds, and foraging values of habitats) to translate fall–winter waterfowl population targets and summer–fall shorebird population targets into habitat objectives for this important region. These objectives are expected to represent landscape conditions needed to support desired population levels. GCJV scientists, in collaboration with geographers at the USGS Wetland and Aquatic Research Center, use remote sensing to conduct annual periodic assessments of waterfowl and shorebird habitat on flooded agricultural lands and moist-soil impoundments within the GCJV region. The assessments are conducted several times per year during important migration periods for each of these two bird guilds. Spectral indices derived from Landsat imagery, including the land-surface water index, the modified normalized water index, the enhanced normalized difference vegetation index, and the normalized difference built-up index, are used to classify bird habitats.
Assessments have been conducted for 2005 to the present, and are used to help determine if regional habitat objectives are being met, while also providing insights into inter-annual and intra-annual variation in habitat. In addition, these data are used to assist with planning and assessment of conservation delivery practices. For example, the GCJV uses waterfowl habitat assessments to measure the contribution of the Texas Prairie Wetlands Project, a partnership that works with private landowners to restore, enhance, and create shallow-water wetlands, to the overall regional waterfowl habitat abundance.

Waterfowl habitat on inland agricultural lands during fall and winter of 2016–2017 for a selected area in southwestern Louisiana. (A and C) Satellite imagery during fall 2016 (A) and winter 2017 (C). Imagery is a false-color composite of Landsat 8 imagery (bands 5, 6, 4) in which water appears blue or purple, vegetation appears red or brown, and bare land appears yellow or green. (B and D) Waterfowl habitat assessments for fall 2016 (B) and winter 2017 (D). In these maps, waterfowl habitat (blue) includes flooded agricultural fields, temporary and seasonal wetlands, and moist soil impoundments. Non-agricultural lands (black) are areas that have been excluded from assessments, which include forests, permanent water bodies, and urban areas.

