WaterSmart is an interdisciplinary and collaborative project designed to help optimize water use in California’s agricultural areas. USGS is developing automated cropland classification algorithms (ACCA) that rapidly and routinely map croplands and cropland fallow areas annually. To help refine the ACCA in California, extensive field data of land use and land cover were collected in July 2014 to correspond with peak or near-peak growing conditions of most annual crops. ACCA results will be used in models to map irrigated crop water productivity (WP) using integrated remote sensing data to pinpoint areas with poor WP due to climate stress and other factors. If WP is increased in underperforming areas in the irrigated croplands, the "new water" made available will be quantified, leading to informed application of management practices and use associated water savings exactly where they are needed. The WP mapping approach involves (a) water use mapping through surface energy balance models, (b) crop productivity mapping through spectro-biophysical modeling and spatial interpolation using remote sensing, and (c) WP mapping by dividing crop productivity by water use. This research highlights USGS capabilities to supply science to decision makers so that they can act locally, where issues interlinking water, climate, and food are of critical importance for the sustaining environment, ecology, and the economy.

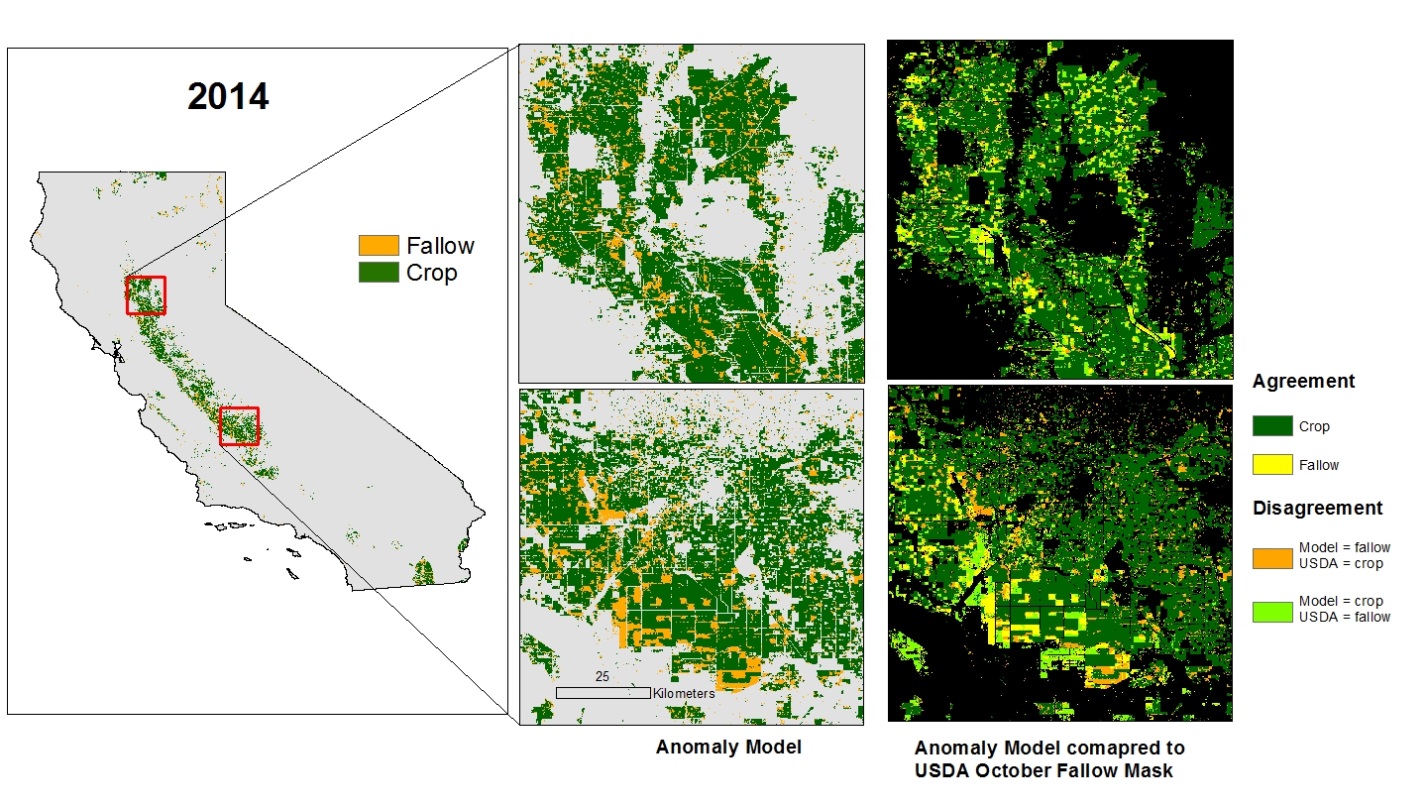
Automated mapping of croplands and cropland fallows. The above-mentioned ACCA model (Figure left, with zoomed insets center) compares the MODIS monthly greenness to historical greenness patterns observed between 2001 and 2013. In this model, a current pixel is considered fallow if all spring and fall months (March-May and September-November) have normal greenness, and all summer months (June-August) are relatively brown. Current month greenness is evaluated against the average historical NDVI value between 2001 and 2013. The insets at right show how well this model fits with the model produced by the U.S. Department of Agriculture (USDA), which uses Landsat 8, Deimos, and Farm Service Agency data. Statistics confirm there is significant agreement between the ACCA and the USDA models. The ACCA model can easily translate to new areas because it considers the historical greenness at each location.

