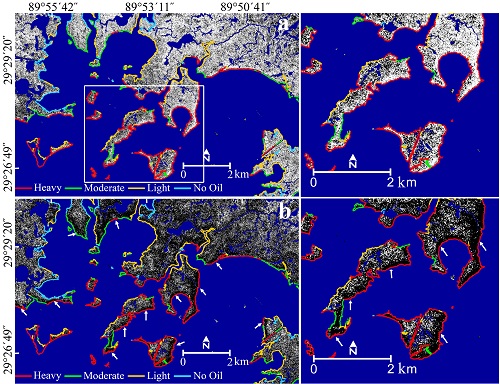
Marsh canopy structure indicators of leaf area index (LAI) and leaf angle distribution (LAD) were mapped yearly from 2009 to 2012 in the Barataria Bay, Louisiana, coastal region – an area severely impacted by the 2010 Deepwater Horizon (DWH) oil spill. The mapping relied on summer collections of NASA's UAVSAR polarimetric synthetic aperture radar (PolSAR) image data. The yearly Spartina alterniflora structure maps captured a pattern of accentuated decrease localized within backshore marsh that occurred widely throughout the oil-impacted study area in 2011, a year after the oil spill. Previous studies showed that DWH oil contaminated the backshore marsh to various degrees (https://doi.org/10.1016/j.marpolbul.2014.10.032) and that biomass decreased in marsh that was moderately contaminated by DWH oil (http://www.sciencedirect.com/science/article/pii/S0048969716304752/), supporting the possibility that the observed decrease in LAI in 2011 was due to oiling in 2010. Those results increase the possibility of a causal relationship, especially when combined with the spatial alignment in many areas between the backshore LAI decrease and heavy to moderate shoreline oiling. The differential decrease in backshore LAI uncovered by the PolSAR mapping and its frequent alignment with heavily oiled shorelines is a compelling and important finding. Because the inferential nature of that association and the inability to discount unknown factors preclude a conclusive result, further exploration through experiments and case studies can be used to help establish causation.
http://doi.org/10.1016/j.rse.2016.08.001

LAI decrease in S. alterniflora backshore marsh associated with heavily and moderately oiled shorelines: LAI differences (a) 2010–2009 and (b) 2011–2010. Progressively brighter gray tones partitioned as discrete 0.88 LAI classes represent increasing differences from zero (−0.44 to +0.44 shown as black). Black represents all differences <−0.44 LAI. Colored vectors depict 2010 observed shoreline oiling categories (see legends). Arrows placed on the 2011–2010 overview and close-up locate backshore marsh features exhibiting a 2010 to 2011 LAI decrease.

